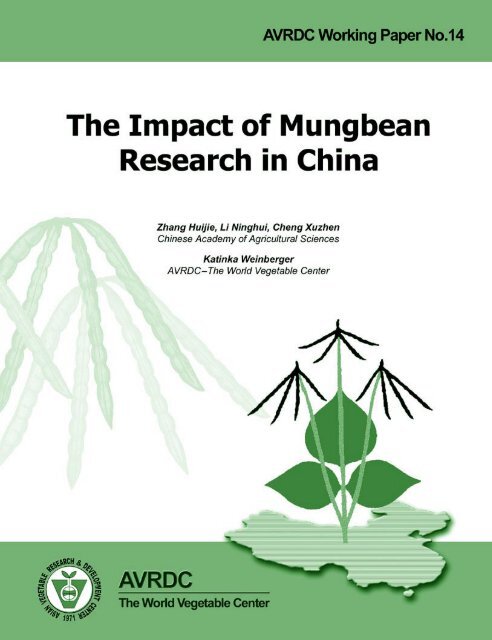
The Impact of Mungbean Research in China
The Impact of Mungbean Research in China
The Impact of Mungbean Research in China

Create successful ePaper yourself
Turn your PDF publications into a flip-book with our unique Google optimized e-Paper software.
AVRDC—<strong>The</strong> World Vegetable Center—is committed toimprov<strong>in</strong>g nutrition and reduc<strong>in</strong>g poverty through vegetableresearch and developmentAVRDC Work<strong>in</strong>g Paper SeriesThis <strong>in</strong>formal series <strong>in</strong>cludes papers prepared for major symposia (proceed<strong>in</strong>gs <strong>of</strong>which may not appear for 1 or 2 years), important statements <strong>of</strong> speeches, selectedsem<strong>in</strong>ar papers, or prelim<strong>in</strong>ary papers that require rapid dissem<strong>in</strong>ation to a small,selected audience. Material appear<strong>in</strong>g <strong>in</strong> this series may later f<strong>in</strong>d its way <strong>in</strong>to formalpublication <strong>in</strong> refereed journals or as an AVRDC technical bullet<strong>in</strong>.© 2003 AVRDC—<strong>The</strong> World Vegetable CenterAVRDC—<strong>The</strong> World Vegetable CenterPO Box 42, Shanhua, Ta<strong>in</strong>an, Taiwan 741, ROCtel: +886-6-583-7801fax: +886-6-583-0009e-mail: avrdcbox@netra.avrdc.org.twwww: http://www.avrdc.orgWork<strong>in</strong>g paper no. 14AVRDC Publication 03-550For more <strong>in</strong>formation contact K. We<strong>in</strong>berger, Assistant Scientist - Socio-economist, AVRDC atSuggested Citation:Z. Huijie, L. N<strong>in</strong>ghui, C. Xuzhen, and K. We<strong>in</strong>berger. <strong>The</strong> impact <strong>of</strong> mungbean research <strong>in</strong> Ch<strong>in</strong>a. Shanhua,Taiwan: AVRDC—<strong>The</strong> World Vegetable Center, AVRDC Publication No. 03-550, Work<strong>in</strong>g Paper No. 14.26 pp.
Contents1 Introduction 12 <strong>Mungbean</strong> research <strong>in</strong> Ch<strong>in</strong>a 22.1 Crop improvement research 22.2 Varieties sown today 22.2.1 Ma<strong>in</strong> season type with high yield and good quality 32.2.2 Early matur<strong>in</strong>g types 32.2.3 <strong>Mungbean</strong> sprout varieties 32.2.4 Green manure varieties 33 Ch<strong>in</strong>a’s mungbean production policies 44 <strong>Mungbean</strong> production <strong>in</strong> Ch<strong>in</strong>a 54.1 Dry bean production trends 54.2 <strong>Mungbean</strong> production trends 64.2.1 Production levels 64.2.2 Major production areas 85 <strong>Mungbean</strong> consumption <strong>in</strong> Ch<strong>in</strong>a 105.1 Nutritional value <strong>of</strong> mungbean 105.2 <strong>Mungbean</strong> consumption trends 116 International mungbean trade 127 Price analysis <strong>of</strong> mungbean <strong>in</strong> Ch<strong>in</strong>a 167.1 Price trends from 1986–2000 167.2 Price changes due to seasonal variation 177.3 Price differences among regions 188 Producer and consumer surplus through mungbean research 198.1 Methodology 198.2 Estimation <strong>of</strong> consumer and producer surplus 209 <strong>Impact</strong> <strong>of</strong> mungbean research on development <strong>of</strong> human capital 2210 Summary 23Bibliography 24Annexes 25i
List <strong>of</strong> TablesTable 1. Ten lead<strong>in</strong>g prov<strong>in</strong>ces <strong>of</strong> mungbean output <strong>in</strong> Ch<strong>in</strong>a <strong>in</strong> 1995 and 2000 9Table 2. Nutrient content <strong>of</strong> mungbean <strong>in</strong> various forms 10Table 3. Share <strong>of</strong> mungbeans <strong>in</strong> total agricultural imports and exports, 1986–2000 12Table 4. Development <strong>of</strong> real price for different commodities 17Table 5. Category statistics by season 17Table 6. Test for equality <strong>of</strong> means <strong>of</strong> price between seasons 17Table 7. Category statistics by region 18Table 8. Test for equality <strong>of</strong> means <strong>of</strong> price between regions 18Table 9.Net present values, benefit and cost returns, and <strong>in</strong>ternal rate <strong>of</strong> return<strong>of</strong> mungbean, closed economy 20Table 10. Net present values, benefit and cost returns, and <strong>in</strong>ternal rate <strong>of</strong> return<strong>of</strong> mungbean, export<strong>in</strong>g economy and AVRDC research cost <strong>in</strong>cluded 21List <strong>of</strong> FiguresFig. 1. Production trends <strong>of</strong> dry beans <strong>in</strong> Ch<strong>in</strong>a, 1986–2000 5Fig. 2. <strong>Mungbean</strong> production, area harvested and yield, 1986–2000 6Fig. 3. Total gra<strong>in</strong> output <strong>in</strong> Ch<strong>in</strong>a, 1986–2000 7Fig. 4. Major mungbean grow<strong>in</strong>g prov<strong>in</strong>ces <strong>in</strong> Ch<strong>in</strong>a 8Fig. 5. <strong>Mungbean</strong> production <strong>in</strong> Henan, 1986–2000 9Fig. 6. Annual per capita mungbean and pulses consumption, 1986–2000 11Fig. 7. <strong>Mungbean</strong> exports <strong>in</strong> quantity and value, 1986–2000 13Fig. 8. <strong>Mungbean</strong> imports <strong>in</strong> quantity and value, 1986–2000 14Fig. 9. Share <strong>of</strong> mungbean net exports <strong>in</strong> total production, 1986–2000 15Fig. 10. <strong>Mungbean</strong> real price, 1986–2000 16Fig. 11. <strong>The</strong> basic supply-and-demand model <strong>of</strong> research benefits 19ii
1 IntroductionCh<strong>in</strong>a has experienced rapid economic development<strong>in</strong> the past two decades. Economic reformshave brought about higher <strong>in</strong>comes, stable food supplies,and changes <strong>in</strong> people’s food consumptionpatterns. In general, Ch<strong>in</strong>ese are demand<strong>in</strong>g higherquality, more nutritious foods <strong>in</strong> their diets. <strong>The</strong>sechanges drive the agricultural supply side, <strong>in</strong>duc<strong>in</strong>ga shift to the production <strong>of</strong> more high-quality foods.<strong>Mungbean</strong> has been a valuable source <strong>of</strong> nutrition<strong>in</strong> Ch<strong>in</strong>ese diets for centuries. <strong>Mungbean</strong> is<strong>of</strong>ten praised as a “green pearl” because <strong>of</strong> its richness<strong>in</strong> prote<strong>in</strong>, starch, m<strong>in</strong>erals, vitam<strong>in</strong> B, andam<strong>in</strong>o acids. <strong>Mungbean</strong> is consumed as a seed,sprout, or <strong>in</strong> processed forms that <strong>in</strong>clude cold jellies,noodles, cakes, and brews. <strong>Mungbean</strong> is alsoused <strong>in</strong> traditional medic<strong>in</strong>es.This study aims to understand the impact <strong>of</strong>mungbean research <strong>in</strong> Ch<strong>in</strong>a. It covers:• a detailed description <strong>of</strong> mungbean variety improvement<strong>in</strong> Ch<strong>in</strong>a;• agricultural policies related to mungbean production;• production trends <strong>of</strong> mungbean and related legumes;• nutritional qualities and consumption trends <strong>of</strong>mungbean;• Ch<strong>in</strong>a’s <strong>in</strong>ternational trade <strong>of</strong> mungbean;• price analysis <strong>of</strong> mungbean <strong>in</strong> Ch<strong>in</strong>a;• producer and consumer surplus analysis; andthe• impact <strong>of</strong> mungbean research on the development<strong>of</strong> human capital.Dur<strong>in</strong>g the 1950s, Ch<strong>in</strong>a was a major producer<strong>of</strong> mungbean. For <strong>in</strong>stance, <strong>in</strong> 1957 the area sownunder mungbean was 1.64 million ha and the outputwas approximately 800,000 tons. However,mungbean yield was relatively low at only 488 kg/ha, ma<strong>in</strong>ly due to the low-<strong>in</strong>put cultivation technologyand impure seed supplies.<strong>Mungbean</strong> production <strong>in</strong> Ch<strong>in</strong>a decl<strong>in</strong>ed throughthe 1960s and 1970s as the national governmentplaced higher priority on other gra<strong>in</strong>s. <strong>The</strong>n an <strong>in</strong>itiativeon mungbean research <strong>in</strong> the 1980s stoppedthe decl<strong>in</strong>e and dramatically changed productionpractices <strong>in</strong> the country. Through the development<strong>of</strong> high yield<strong>in</strong>g varieties and improved productionpractices, yields <strong>in</strong>creased to 914 kg/ha <strong>in</strong> 1986and 1154 kg/ha <strong>in</strong> 2000. <strong>The</strong> land <strong>in</strong> mungbean production<strong>in</strong> 2000 was 772,000 ha and overall productionwas 891,000 tons. Due to high consumer demand,mungbean production levels have stabilizedwhereas production <strong>of</strong> most other gra<strong>in</strong> crops havedecreased. <strong>The</strong> crop is an important export good <strong>in</strong>Ch<strong>in</strong>a.1
2 <strong>Mungbean</strong> research <strong>in</strong> Ch<strong>in</strong>a2.1 Crop improvement research<strong>Mungbean</strong> has traditionally been a m<strong>in</strong>or crop<strong>in</strong> Ch<strong>in</strong>a. Before the late 1970s, production waslargely based upon low-<strong>in</strong>put cultivation techniquesand impure seed supplies. <strong>The</strong> result was low yieldsthat ranged from 300 to 750 kg/ha.In order to improve yields, variety improvementprograms were <strong>in</strong>itiated. <strong>The</strong> collection, conservation,evaluation, improvement, and utilization <strong>of</strong>mungbean varieties were <strong>of</strong>ficially <strong>in</strong>cluded <strong>in</strong>to theKey Technologies R&D Program, M<strong>in</strong>istry <strong>of</strong> Scienceand Technology <strong>in</strong> 1978, and f<strong>in</strong>anced by thegovernment with 25 million RMB (approx. 4.5 millionUS$) between 1978 and 2000. 1 Over theseyears, Ch<strong>in</strong>ese scientists collected several thousandaccessions from nearly 30 prov<strong>in</strong>ces. Amongthese accessions, 5218 were <strong>in</strong>cluded <strong>in</strong>to theCh<strong>in</strong>ese food legumes catalogue, 4936 were stored<strong>in</strong> the national genebank, and about 60% were analyzedfor nutritional properties and resistances tovarious diseases, <strong>in</strong>sect pests, and other adversities.Superior types were further screened for earlymaturity, large seed size, high yield, high prote<strong>in</strong>or starch, and resistances to drought, salt, andmajor diseases and <strong>in</strong>sect pests. <strong>The</strong> most promis<strong>in</strong>gl<strong>in</strong>es were utilized for variety improvement,start<strong>in</strong>g <strong>in</strong> 1980.Initial efforts <strong>in</strong> variety improvement did not leadto significant <strong>in</strong>creases <strong>in</strong> yields. <strong>The</strong>n <strong>in</strong> 1983, theInstitute <strong>of</strong> Crop Germplasm Resources <strong>of</strong> the Ch<strong>in</strong>eseAcademy <strong>of</strong> Agricultural Sciences (CAAS) beganconduct<strong>in</strong>g research <strong>in</strong> cooperation with theAsian Regional Center <strong>of</strong> the Asian Vegetable <strong>Research</strong>and Development Center (AVRDC-ARC).More than 200 AVRDC-improved mungbean l<strong>in</strong>eswere <strong>in</strong>troduced to Ch<strong>in</strong>a through AVRDC-ARC.After several years <strong>of</strong> research, a number <strong>of</strong> promis<strong>in</strong>gvarieties were selected from the AVRDCimprovedmaterials. New varieties <strong>in</strong>cluded ZhongLu #1 (VC1973A), Er Lu #2 (VC2778A), Su Lu #1(VC2768A), and Yue Y<strong>in</strong> #3 (VC1628A). All thesenew varieties were found suitable for various cropp<strong>in</strong>gsystems at different localities <strong>in</strong> Ch<strong>in</strong>a. In 1989,Zhong Lu #1 was planted on approximately 266,500ha, cover<strong>in</strong>g more than 45% <strong>of</strong> the mungbeanplant<strong>in</strong>gs <strong>in</strong> Ch<strong>in</strong>a. High yield<strong>in</strong>g cultivation technologies,which can be used together with the improvedmungbean varieties, were also developed.In recent years a number <strong>of</strong> advanced varietieswere developed us<strong>in</strong>g AVRDC-improved or superiorlocal types. <strong>The</strong>se varieties <strong>in</strong>cluded Zhong Lu #2(VC2917A selection), Yu Lu #2 (Boaizaihe ×VC2719A), Ji Lu #1 (Henan Guanyangdou ×Hengshui Ludou), Ji Lu #2 (Gaoyang Ludou ×VC2719A), Wei Lu #1 (Jiagankuojiao × VC2719A),J<strong>in</strong> Lu #1 (VC2768A selection), and J<strong>in</strong> Lu #2 (selection<strong>of</strong> irradiated VC2917A). So far, nearly 20new mungbean varieties have been released by theNational or Prov<strong>in</strong>cial Crop Review Committees andextended <strong>in</strong>to large-scale plant<strong>in</strong>g. From this secondgroup <strong>of</strong> varieties, Zhong Lu #2 is the mostwidely sown. In 1998, it was planted on 297,000ha, cover<strong>in</strong>g more than 40% <strong>of</strong> the mungbeanplant<strong>in</strong>gs <strong>in</strong> Ch<strong>in</strong>a.Cultivated areas have stabilized to about800,000 ha while cultivated areas <strong>of</strong> most other gra<strong>in</strong>crops have decreased <strong>in</strong> Ch<strong>in</strong>a. <strong>Mungbean</strong> is typicallyrotated with wheat.2.2 Varieties sown todaySome Ch<strong>in</strong>ese varieties are world famous, suchas M<strong>in</strong>gguang <strong>Mungbean</strong> <strong>in</strong> Anhui, ZhangjiakouY<strong>in</strong>ge <strong>Mungbean</strong> <strong>in</strong> Hebei, and Shandong <strong>Mungbean</strong><strong>in</strong> Shangdong. All these high quality local varietiesform an important basis <strong>of</strong> mungbean exports fromCh<strong>in</strong>a to the world market. A large number <strong>of</strong>mungbean varieties adapted for different conditionshave been developed. Popular varieties are ZhongLu #1, Zhong Lu #2, Er Lu #2, Su Lu #1, Yu Lu #2,Ji Lu #2, Wei Lu #1, Yul<strong>in</strong> Ludou, Jil<strong>in</strong> Ludou,Zhangjiakou Ludou, and Neimeng Ludou. <strong>The</strong>seand other varieties are divided <strong>in</strong>to four categories:ma<strong>in</strong> season varieties with high yield and good quality,early matur<strong>in</strong>g varieties, mungbean sprout varieties,and green manure varieties.1Estimate provided by Chen Xushen, Pr<strong>of</strong>essor at the Ch<strong>in</strong>ese Academy <strong>of</strong> Agricultural Sciences (CAAS).2
2.2.1 Ma<strong>in</strong> season type with highyield and good qualityZhong Lu #1 (VC1973A) was <strong>in</strong>troduced fromabroad by CAAS. It is widely adaptable and productive.Expected yields range from 1500 to 2250kg/ha, with a maximum yield <strong>of</strong> 4500 kg/ha reportedfrom a research station. This is the most popularvariety <strong>in</strong> Ch<strong>in</strong>a.Zhong Lu #2 is a selection from VC2719A. Itsyields are high and reliable. Expected yields rangefrom 1800 to 2250 kg/ha, with a maximum yield <strong>of</strong>4050 kg/ha reported. It has been extended <strong>in</strong>to thema<strong>in</strong> mungbean production areas <strong>of</strong> Ch<strong>in</strong>a.Er Lu #2 is a selection from VC2778A. Its expectedyield is 1950 kg/ha. <strong>The</strong> variety is widelyplanted <strong>in</strong> Hubei, Henan, and Shanxi prov<strong>in</strong>ces.Su Lu #1 (VC2768A) was <strong>in</strong>troduced by CAASfrom abroad. It is suitable for mechanized farm<strong>in</strong>g.Expected yields range from 1500 to 2250 kg/ha,with a maximum yield <strong>of</strong> 3000 kg/ha reported. It isespecially suitable <strong>in</strong> such areas as Beij<strong>in</strong>g, Henan,Anhui, Jiangsu, and Guangdong prov<strong>in</strong>ces. It isnamed differently <strong>in</strong> different places, e.g., Su Lu #1<strong>in</strong> Jiangsu, Yuey<strong>in</strong> yihao <strong>in</strong> Guangdong, and J<strong>in</strong>luyihao <strong>in</strong> Shanxi.Yu Lu #2 was generated by cross<strong>in</strong>g VC1562Aand local variety Bo Ai Zai. Yu Lu #2 has wide adaptabilityand can grow <strong>in</strong> ma<strong>in</strong> mungbean produc<strong>in</strong>gareas. Its expected yield is 1800 kg/ha, with yieldsreach<strong>in</strong>g as high as 3513 kg/ha. This is the firstvariety developed <strong>in</strong> Ch<strong>in</strong>a by cross<strong>in</strong>g different l<strong>in</strong>es.Ji Lu #2 was generated by cross<strong>in</strong>g VC2719Aand local variety Miaoyang ludou. Ji Lu #2 is especiallysuitable for plant<strong>in</strong>g <strong>in</strong> Hebei prov<strong>in</strong>ce andsimilar ecological areas. Expected yields rangefrom 1500 to 2200 kg/ha.2.2.2 Early matur<strong>in</strong>g varietiesFangshan <strong>Mungbean</strong> 634 (C0067) is a localvariety <strong>in</strong> Fangshan, Beij<strong>in</strong>g. Its expected yield isabout 1500 kg/ha. It is especially suitable for plant<strong>in</strong>g<strong>in</strong> northeastern Ch<strong>in</strong>a, Huabei district, andHenan, Shandong, and Shanxi prov<strong>in</strong>ces.Wei Lu #1 was generated by cross<strong>in</strong>g VC2719with local varieties <strong>of</strong> Weifang <strong>in</strong> Shangdong prov<strong>in</strong>ce.When cultivated <strong>in</strong> summer, expected yieldis 2250 kg/ha and maximum yield is 2550 kg/ha;when cultivated <strong>in</strong> spr<strong>in</strong>g, expected yield is 2650kg/ha and maximum yield is 3000 kg/ha.2.2.3 <strong>Mungbean</strong> sprout varietiesGaoyang Xiao <strong>Mungbean</strong> is a local variety <strong>in</strong>Hebei. Expected yields range from 1500 to 2250kg/ha. It is especially suitable for plant<strong>in</strong>g <strong>in</strong> northeastCh<strong>in</strong>a, Huabei district, and Jiangsu, Shandong,and Henan prov<strong>in</strong>ces.M<strong>in</strong>g Lu 245 is a selection from local varieties<strong>of</strong> Inner Mongolia by CAAS. Expected yields rangefrom 1125 to 1500 kg/ha. It is especially suitablefor plant<strong>in</strong>g <strong>in</strong> areas such as Beij<strong>in</strong>g, Tianj<strong>in</strong>, andJiangsu, Shandong, Henan, and Hunan prov<strong>in</strong>ces.2.2.4 Green manure varietiesZhi Xiao Li M<strong>in</strong>g 317 is a variety selected fromlocal varieties <strong>in</strong> Hebei. Its branches and leavesare suitable for green manure and forage. It growswell <strong>in</strong> Tianj<strong>in</strong>, Liaon<strong>in</strong>g, Henan and Anhui, and also<strong>in</strong> the chilly area <strong>of</strong> Bashang <strong>in</strong> Hebei.Nan Lu #2 is a selection from V1381. Expectedyields range from 1500 to 2200 kg/ha, with yieldsreach<strong>in</strong>g as high as 3000 kg/ha. It is especiallysuitable for plant<strong>in</strong>g <strong>in</strong> such areas as Beij<strong>in</strong>g, Hebei,Henan, Hubei, and Sichuang prov<strong>in</strong>ces.3
3 Ch<strong>in</strong>a’s mungbean production policies<strong>The</strong> Ch<strong>in</strong>ese government has always paid greatattention to gra<strong>in</strong> production and emphasized itsgrowth <strong>in</strong> the development <strong>of</strong> the overall ruraleconomy. <strong>The</strong>refore, a reform <strong>of</strong> the gra<strong>in</strong> distributionsystem was put <strong>in</strong>to place. At present, a strategicadjustment <strong>in</strong> Ch<strong>in</strong>a’s agriculture structure hasbeen implemented based on the situation that theaggregate supply <strong>of</strong>, and aggregate demand formajor agricultural products are either balanced oraggregate supply surpasses aggregated demand<strong>in</strong> the years <strong>of</strong> good harvests.<strong>The</strong> ma<strong>in</strong> elements <strong>of</strong> the gra<strong>in</strong> distribution systemreform are: 1) the purchase <strong>of</strong> all surplus gra<strong>in</strong>from farmers at protected prices; 2) enterprises engaged<strong>in</strong> gra<strong>in</strong> bus<strong>in</strong>ess operate on the basis <strong>of</strong>purchas<strong>in</strong>g price plus reasonable pr<strong>of</strong>it marg<strong>in</strong>; 3)funds for purchas<strong>in</strong>g gra<strong>in</strong> from farmers must beearmarked for that specific purpose; and 4) the reform<strong>of</strong> gra<strong>in</strong> enterprises shall be conducted <strong>in</strong> arapid manner. In 2001, a further reform took placeand measures such as lift<strong>in</strong>g controls <strong>in</strong> market<strong>in</strong>gareas were adopted (M<strong>in</strong>istry <strong>of</strong> Agriculture <strong>of</strong> Ch<strong>in</strong>a2002). <strong>The</strong> reform and improvement <strong>of</strong> the gra<strong>in</strong> distributionsystem have positively contributed to thestabilization <strong>of</strong> gra<strong>in</strong> production and ensur<strong>in</strong>g foodsecurity. Futures markets have contributed to thesteady <strong>in</strong>crease <strong>of</strong> the national economy.<strong>Mungbean</strong>s are categorized as a m<strong>in</strong>or miscellaneousgra<strong>in</strong> crop <strong>in</strong> Ch<strong>in</strong>a. Its production issubject to the reforms <strong>of</strong> the gra<strong>in</strong> distribution system.<strong>Mungbean</strong> was among the first products whoseprices were opened to the market, and its productionand consumption are subject to market forces.Without market regulation, mungbean productionis <strong>in</strong>fluenced by its supply and demand as well asprice differences with other gra<strong>in</strong> products.<strong>The</strong> mungbean futures market has been carriedout at the Zhengzhou Commodity Exchanges<strong>in</strong>ce 1993 and mungbean futures trad<strong>in</strong>g has operatedsuccessfully. Now “Zhengzhou Ludou” hasbecome an important signal represent<strong>in</strong>g the supplyand demand <strong>of</strong> Ch<strong>in</strong>ese mungbean (ZhengzhouCommodity Exchange 2002).4
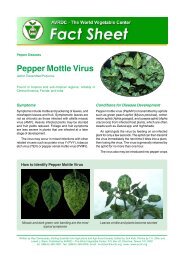
4 <strong>Mungbean</strong> Production <strong>in</strong> Ch<strong>in</strong>a4.1 Dry bean production trendsS<strong>in</strong>ce <strong>of</strong>ficial data for mungbean production is notavailable for all years, we will beg<strong>in</strong> by look<strong>in</strong>g atproduction trends <strong>of</strong> “dry beans”, as made availableby Food and Agriculture Organization <strong>of</strong> theUnited Nations (FAO). Among total pulses, drybeans account for one <strong>of</strong> the largest groups. <strong>The</strong>group <strong>of</strong> dry beans <strong>in</strong>cludes Phaseolus and Vignaspecies such as mungbean, adzuki bean, blackgram, and scarlet runner bean. Dur<strong>in</strong>g the past 15years, Ch<strong>in</strong>a’s total production <strong>of</strong> dry beans rangedfrom 1.2 to 1.8 million MT, except <strong>in</strong> 1991 and 1992,when the production area was sharply decreasedafter Ch<strong>in</strong>a’s ‘Drought <strong>of</strong> the Century’ <strong>in</strong> 1991 andearly 1992 (Fig. 1). <strong>The</strong> yield <strong>of</strong> dry bean fluctuatedbetween about 975 to 1500 kg/ha dur<strong>in</strong>g 1986 to1991, dipped to 900 kg/ha <strong>in</strong> 1992 and then grewsteadily to 1467 kg/ha <strong>in</strong> 2001. On average, theyield <strong>of</strong> dry beans has <strong>in</strong>creased 1.6% per year,total production levels have <strong>in</strong>creased 1.0% per year,but the area <strong>in</strong> production has decl<strong>in</strong>ed at the rate<strong>of</strong> 0.6% per year. 22,0001,8001,6001000 MT/ 1000ha/ kg/ha1,4001,2001,0008006004001986 1987 1988 1989 1990 1991 1992 1993 1994 1995 1996 1997 1998 1999 2000 2001Area Yield ProductionFig. 1. Production trends <strong>of</strong> dry beans <strong>in</strong> Ch<strong>in</strong>a, 1986–2000Average annual growth rates: production = 1%, yield = 1.6%; area cultivated = -0.6%.Source: FAOSTAT (2001).2 <strong>The</strong> estimation is based on the least square growth rate. <strong>The</strong> regression equation takes the form log X t= a + bt. In theseequations, X is the variable and t is time. If b* is the least-squares estimate <strong>of</strong> b, then the average annual growth rate isobta<strong>in</strong>ed as [antilog (b*)-1] and is multiplied by 100 to express it as a percentage.5
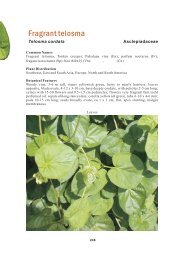
4.2 <strong>Mungbean</strong> production trendsS<strong>in</strong>ce mungbean is classified as a miscellaneousgra<strong>in</strong>, data for mungbeans are difficult tocome by. <strong>The</strong> M<strong>in</strong>istry <strong>of</strong> Agriculture providesmungbean production data from 1995 to 2000. Forsome years, data is derived from local statisticalyearbooks. F<strong>in</strong>ally, for some years data is basedon extrapolation from prov<strong>in</strong>cial statistical data.4.2.1 Production levelsDur<strong>in</strong>g the 1950s, Ch<strong>in</strong>a was a major producer<strong>of</strong> mungbean. For example, <strong>in</strong> 1957 the area grownunder mungbean was 1.64 million ha and outputwas nearly 800,000 tons. <strong>Mungbean</strong> yield was relativelylow at only 488 kg/ha, ma<strong>in</strong>ly due to the low<strong>in</strong>putcultivation technology and impurity <strong>of</strong> seed.<strong>Mungbean</strong> production decl<strong>in</strong>ed dur<strong>in</strong>g the1960s. Due to the overall shortage <strong>of</strong> food, thegovernment put more emphasis on other gra<strong>in</strong>s,such as rice and soybean. Dur<strong>in</strong>g the 1980s, however,mungbean production gradually recovered.Through <strong>in</strong>ternational cooperation, new varieties andimproved production practices were developed anddissem<strong>in</strong>ated to farmers.<strong>The</strong>se efforts led to a rise <strong>in</strong> production levels(Fig. 2). In 1986, the area under mungbean was547,000 ha, the total production was 500,000 tons,and yields averaged 915 kg/ha. <strong>The</strong> figure showsthat total production and area have risen with approximatelythe same pattern, with yields rema<strong>in</strong><strong>in</strong>grelatively constant until 1997, when a sharp <strong>in</strong>creasecan be observed. This is attributable to the<strong>in</strong>troduction <strong>of</strong> a new high yield<strong>in</strong>g variety, ZhongLu #2, which produces yields <strong>of</strong> 1800 to 2250 kg/ha and is very popular with farmers.Compared to the production <strong>of</strong> total pulses anddry beans, the share <strong>of</strong> mungbeans has risensteadily. In 1986, approximately 9% <strong>of</strong> all pulses13001200110010001000 MT/ 1000 ha/ kg/ha9008007006005004001986 1987 1988 1989 1990 1991 1992 1993 1994 1995 1996 1997 1998 1999 2000Production (1000 MT) Area (1000 ha) Yield (kg/ ha)Fig. 2. <strong>Mungbean</strong> production, area harvested and yield, 1986–2000Average annual growth rates: production = 2.4%, yield = 1.7%, area cultivated = 0.7%. Source: 1989, 1991 and 1992production figures and area figures from 1986–1994 are estimates based on prov<strong>in</strong>cial yearbooks. Production and areafigures for the rema<strong>in</strong><strong>in</strong>g years have been provided by the M<strong>in</strong>istry <strong>of</strong> Agriculture <strong>of</strong> Ch<strong>in</strong>a (unpublished).6
produced <strong>in</strong> Ch<strong>in</strong>a were mungbeans; <strong>in</strong> 2000, 19%<strong>of</strong> all pulses grown were mungbeans. In 1986, 35%<strong>of</strong> all dry beans grown were mungbeans; <strong>in</strong> 2000the share rose to 66%.In the 1990s, the scale <strong>of</strong> total mungbean productionwas enhanced based on achievements <strong>in</strong>research. In 2000, the total area under mungbeanwas nearly 772,000 ha, the total production was891,000 tons, and the average yield went up to 1154kg/ha. Between 1986 and 2000 the total production<strong>of</strong> mungbean <strong>in</strong>creased with an average annualgrowth rate <strong>of</strong> 2.4%. This is largely due to thegrowth <strong>in</strong> yield (1.7% annually), and to a lesserextent to an <strong>in</strong>crease <strong>in</strong> area grown (0.7% annually).This is comparable to soybean, the most importantpulse <strong>in</strong> Ch<strong>in</strong>a, which has shown annualgrowth rates <strong>of</strong> 2.9% <strong>in</strong> total production, 2.2% <strong>in</strong>yield, and 0.7% <strong>in</strong> area grown.<strong>Mungbean</strong> production <strong>in</strong> Ch<strong>in</strong>a has been <strong>in</strong>fluencedby several factors. Firstly, Ch<strong>in</strong>a’s capacity<strong>of</strong> gra<strong>in</strong> production has improved substantially dueto market reforms. <strong>The</strong> total gra<strong>in</strong> production surpassed400 million tons, 450 million tons and 500million tons <strong>in</strong> 1987, 1993 and 1996 respectively(Fig. 3). With the exception <strong>of</strong> year 2000 when poorweather reduced yields, the production <strong>of</strong> gra<strong>in</strong> andother major agricultural products has been ma<strong>in</strong>ta<strong>in</strong>edat a relatively high level s<strong>in</strong>ce 1996. An overallbalanced supply-and-demand pattern for agriculturalproducts has been formed, and currently abuyer’s market emerges, which marks the beg<strong>in</strong>n<strong>in</strong>g<strong>of</strong> a new historical era <strong>of</strong> agricultural productionfrom quantity to quality. Households’ <strong>in</strong>comeshave risen steadily. Dur<strong>in</strong>g 1996–2000, the annualgrowth rate <strong>of</strong> urban households’ <strong>in</strong>come was 6.2%and the annual growth rate <strong>of</strong> rural households’ <strong>in</strong>comewas 3.7%. Liv<strong>in</strong>g standards have <strong>in</strong>creased,<strong>in</strong> turn enhanc<strong>in</strong>g the demand for higher qualityfoods such as mungbean.Secondly, mungbean production is highly dependenton the price ratio between mungbean and600000Average annual growth = 1.9%500000400000Production (1000 MT)30000020000010000001986 1987 1988 1989 1990 1991 1992 1993 1994 1995 1996 1997 1998 1999 2000Fig. 3. Total gra<strong>in</strong> output <strong>in</strong> Ch<strong>in</strong>a, 1986–2000Source: M<strong>in</strong>istry <strong>of</strong> Agriculture <strong>of</strong> Ch<strong>in</strong>a (2001).7
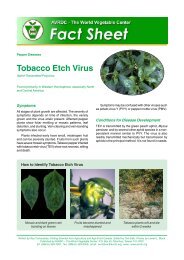
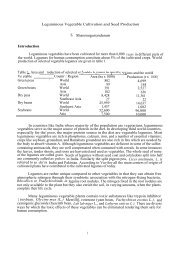
staple gra<strong>in</strong>s. Fluctuations <strong>in</strong> area harvested andtotal production over past years may be expla<strong>in</strong>edby decreas<strong>in</strong>g relative prices for mungbeans as comparedto staple gra<strong>in</strong>s.Thirdly, there is a strong demand for Ch<strong>in</strong>esemungbeans <strong>in</strong> the <strong>in</strong>ternational market. In the past,mungbean has been a m<strong>in</strong>or agricultural exportproduct. Yet, along with the changes <strong>in</strong> the pattern<strong>of</strong> domestic production and consumption,mungbean has ma<strong>in</strong>ta<strong>in</strong>ed its export position. Ch<strong>in</strong>esemungbean has a strong competitive abilitybecause <strong>of</strong> the relatively low cost <strong>in</strong> production.<strong>The</strong>re are many famous varieties <strong>in</strong> Ch<strong>in</strong>a be<strong>in</strong>gexported, such as M<strong>in</strong>gguang Ludou, ZhangjiakouLudou, and Shandong Ludou. Ch<strong>in</strong>a exported morethan 200,000 tons <strong>of</strong> mungbean <strong>in</strong> 1986. Dur<strong>in</strong>gthe 1990s, the years dur<strong>in</strong>g which more than 100,000tons <strong>of</strong> mungbeans were exported were the follow<strong>in</strong>g:1991 (150,000 tons), 1994 (190,000 tons), 1995(230,000 tons), 1998 (110,000 tons), and 1999(290,000 tons).Fourthly, beg<strong>in</strong>n<strong>in</strong>g with the Seventh Five-Year-Plan (1986–1990), the Ch<strong>in</strong>ese government has enhancedits <strong>in</strong>vestment <strong>in</strong>to mungbean research.Simultaneously, the government has also strengthened<strong>in</strong>ternational cooperation <strong>in</strong> science and technology.As reported earlier, progress <strong>of</strong> mungbeanscience and technology led to the development <strong>of</strong>improved varieties and production practices thatsignificantly <strong>in</strong>creased yields.4.2.2 Major production areas<strong>Mungbean</strong> is a remarkably adaptable crop. Itgrows well <strong>in</strong> hot weather and can tolerate moistureconditions that range from drought to waterlogg<strong>in</strong>g.It is grown <strong>in</strong> temperate, sub-arid, arid, andhighland areas, all <strong>of</strong> which can be found <strong>in</strong> Ch<strong>in</strong>a.<strong>The</strong> major production areas <strong>of</strong> mungbean arelocated <strong>in</strong> the Yellow River valley, Huai River valley,Huabei pla<strong>in</strong>, and northeastern Ch<strong>in</strong>a. <strong>The</strong> prov<strong>in</strong>cescan be separated <strong>in</strong>to two regions by the ma<strong>in</strong> varietiesgrown. One is the M<strong>in</strong>g Lu dou region, whichconta<strong>in</strong>s Jil<strong>in</strong> and Inner Mongolia; the other is theZai Lu dou region, which conta<strong>in</strong>s Henan, Shandong,Shanxi, Shannxi, Hebei, and Anhui (Fig. 4).One <strong>of</strong> the major mungbean grow<strong>in</strong>g areas, albeitdecl<strong>in</strong><strong>in</strong>g <strong>in</strong> importance, is Henan prov<strong>in</strong>ce. Itaccounts for 14% <strong>of</strong> the total mungbean produc-HeilongjiangX<strong>in</strong>jiangInnerMongoliaHebeiJil<strong>in</strong>SichuanShanxiShandongShannxi HenanHubei AnhuiRegionsM<strong>in</strong>g Lu douZai Lu douHunanFig. 4. Major mungbean grow<strong>in</strong>gprov<strong>in</strong>ces <strong>in</strong> Ch<strong>in</strong>a8
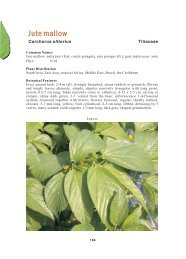
tion <strong>of</strong> Ch<strong>in</strong>a, with an annual output <strong>of</strong> over 100,000tons (Fig. 5). <strong>The</strong> highest output <strong>of</strong> mungbean production<strong>in</strong> Henan was 166,000 tons <strong>in</strong> 1989. Productionlevels decreased <strong>in</strong> the 1990s, except <strong>in</strong>1993 <strong>in</strong> which the output was 160,000 tons. In 2000,mungbean output was 127,000 tons, which is atthe highest level <strong>in</strong> recent years. <strong>The</strong> production <strong>of</strong>peanuts and soybeans <strong>in</strong> Henan is <strong>in</strong>creas<strong>in</strong>g,which may expla<strong>in</strong> the decl<strong>in</strong><strong>in</strong>g importance <strong>of</strong>mungbeans here.Jil<strong>in</strong>, Inner Mongolia, and Shannxi are othermajor mungbean produc<strong>in</strong>g areas <strong>in</strong> Ch<strong>in</strong>a (Table1). Recently mungbean production <strong>in</strong> Jil<strong>in</strong> rose rapidly,and Jil<strong>in</strong> has become the major producer <strong>in</strong>2000 with 148,000 tons mungbean output. This figureexceeds that <strong>of</strong> Henan. <strong>The</strong> development <strong>of</strong>mungbean output changed greatly <strong>in</strong> Inner Mongolia.<strong>The</strong> output <strong>in</strong> 1997 was only about 37,000 tons,but this figure rose sharply to 117,000 tons <strong>in</strong> 1998.Shannxi is well known for produc<strong>in</strong>g high qualitym<strong>in</strong>or miscellaneous gra<strong>in</strong> and its mungbean outputis around 70,000 tons per year.Table 1. Ten lead<strong>in</strong>g prov<strong>in</strong>ces <strong>of</strong> mungbeanoutput <strong>in</strong> Ch<strong>in</strong>a <strong>in</strong> 1995 and 20001995 2000OutputOutputProv<strong>in</strong>ce (1000 MT) Prov<strong>in</strong>ce (1000 MT)Henan 108 Jil<strong>in</strong> 148Sichuan 84 Henan 127Shannxi 50 Inner Mongolia 67Jil<strong>in</strong> 46 Shannxi 66Shandong 42 Sichuan 64Hubei 40 Hubei 62Hebei 38 Anhui 61Shanxi 34 Hunan 42Hunan 26 Chongq<strong>in</strong>g 32X<strong>in</strong>jiang 25 Helongjiang 31Subtotal 493 Subtotal 700National total 680 National total 891Source: M<strong>in</strong>istry <strong>of</strong> Agriculture <strong>of</strong> Ch<strong>in</strong>a (1995–2000), Ch<strong>in</strong>eseAgricultural Statistics Information.18.0Average annual growth = -2.0%16.014.012.0Production (1000 MT)10.08.06.04.02.00.01986 1987 1988 1989 1990 1991 1992 1993 1994 1995 1996 1997 1998 1999 2000Fig. 5. <strong>Mungbean</strong> production <strong>in</strong> Henan, 1986–2000Source: Henan Statistical Bureau (1986–2001).9
5 <strong>Mungbean</strong> consumption <strong>in</strong> Ch<strong>in</strong>a<strong>Mungbean</strong> has been consumed <strong>in</strong> Ch<strong>in</strong>a forcenturies. It is consumed as a seed, sprout, or <strong>in</strong>processed forms that <strong>in</strong>clude jellies, noodles,cakes, and brews. <strong>Mungbean</strong> is also used <strong>in</strong> traditionalmedic<strong>in</strong>es.Income growth and urbanization are likely toboost food demand considerably and change themix <strong>of</strong> foods consumed <strong>in</strong> Ch<strong>in</strong>a. As <strong>in</strong>comes grow,demand for meat, fish, vegetable oils, and dairyproducts will grow particularly fast. <strong>The</strong> country’stransition from rural semi-subsistence to urbanlifestyles will also have pr<strong>of</strong>ound impacts on consumptionpatterns, shift<strong>in</strong>g demand from self-grownrice, wheat, and vegetables to fish, meat, processedfoods, and restaurant meals. Consumers will alsopay more attention to food quality and they maydemand foods with specific attributes.5.1 Nutritional value <strong>of</strong> mungbean<strong>Mungbean</strong> is a highly nutritious pulse due toits rich prote<strong>in</strong> content and excellent digestibility.Table 2 gives an overview on some <strong>of</strong> the importantnutrients that mungbean conta<strong>in</strong>s <strong>in</strong> its variousforms <strong>of</strong> consumption. Note the high lys<strong>in</strong>e content,which makes mungbean a good complementaryfood for rice-based diets, <strong>in</strong> which lys<strong>in</strong>e isusually the first limit<strong>in</strong>g am<strong>in</strong>o acid (Chen et al.1987).<strong>Research</strong> at AVRDC has shown that the iron<strong>in</strong> mungbeans can be made more biologically avail-able if mungbean is cooked together with certa<strong>in</strong>vegetables, such as tomato, mustard greens, andcabbage (AVRDC 1997, 1998, 1999). It has beendemonstrated that consumption <strong>of</strong> mungbeans <strong>in</strong>this form can substantially <strong>in</strong>crease body iron stores<strong>of</strong> anemic schoolchildren (We<strong>in</strong>berger 2002).<strong>Mungbean</strong> seed and mungbean soup is a richsource <strong>of</strong> alkaloids, coumar<strong>in</strong>, and phytoster<strong>in</strong> thatplay an important role <strong>in</strong> promot<strong>in</strong>g the physiologicalmetabolism <strong>of</strong> human be<strong>in</strong>gs and animals.In traditional Ch<strong>in</strong>ese medic<strong>in</strong>e, parts <strong>of</strong> themungbean plant are used for treat<strong>in</strong>g various ailments,<strong>in</strong>clud<strong>in</strong>g hepatitis, gastritis, uraemia, toxicosis,red dysentery, cholera, corneal opacity andmacula (Zheng et al. 2002).5.2 <strong>Mungbean</strong> consumption trends<strong>Mungbean</strong> consumption has been relativelysteady compared to total pulse consumption <strong>in</strong>Ch<strong>in</strong>a. <strong>Mungbean</strong> consumption has <strong>in</strong>creased at arate <strong>of</strong> 0.7% per year from 1986–2000 while pulseconsumption overall has decl<strong>in</strong>ed at an averageannual rate <strong>of</strong> 5.8% (Fig. 6).<strong>The</strong> reason is not that production has decl<strong>in</strong>edso much; rather, pulses are <strong>in</strong>creas<strong>in</strong>gly be<strong>in</strong>g putto different uses. In 1986, 956,000 MT <strong>of</strong> the totalpulses produced were be<strong>in</strong>g used as animal feed;<strong>in</strong> 2000 this figure had grown to 2,132,000 MT (annualgrowth rate <strong>of</strong> 6.4%) (FAOSTAT, 2001). In con-Table 2. Nutrient content <strong>of</strong> mungbean <strong>in</strong> various formsNutrient Raw Mashed/ flour Noodles Sprouts DryKilocalories 306.0 361.5 381.0 61.0 116.0Prote<strong>in</strong> (g) 20.3 24.5 0.3 6.6 7.7Vitam<strong>in</strong> A (RE) 5.0 6.0 0.0 1.0 2.0Vitam<strong>in</strong> C (mg) 0.0 0.0 0.0 8.0 0.0Iron (mg) 6.6 6.4 0.5 1.1 2.5Z<strong>in</strong>c (mg) 3.4 3.7 0.1 0.6 1.3Folate (µg) 549.0 499.5 0.0 86.0 208.0Am<strong>in</strong>o acids (g) 10.2 12.0 0.1 3.1 3.9Lys<strong>in</strong>e (g) 1.6 1.9 0.0 0.5 0.6Source: Calloway et al. 199410
trast, annual per capita mungbean consumption <strong>in</strong>Ch<strong>in</strong>a fluctuated between 0.3 and 0.5 kg dur<strong>in</strong>g theperiod 1986–2000. 3 <strong>The</strong> share <strong>of</strong> mungbean consumption<strong>in</strong> total pulse consumption has risensteadily, from 14.2% <strong>in</strong> 1986 to 28% <strong>in</strong> 2000.3.53.0Consumption (kg/ capita/ year)2.52.01.5Average annual growth pulses = - 5.8%1.00.5Average annual growth mungbeans = 0.7%0.01986 1987 1988 1989 1990 1991 1992 1993 1994 1995 1996 1997 1998 1999 2000Total Pulses <strong>Mungbean</strong> Pulses trend <strong>Mungbean</strong> trendFig. 6. Annual per capita mungbean and pulses consumption, 1986–2000Source: Total pulses consumption data from FAOSTAT (2001), mungbean consumption see footnote 3.3 S<strong>in</strong>ce consumption data for mungbean is not available, it has been estimated as production plus imports, m<strong>in</strong>us exports, seeduse (22.65 kg/ha), and waste (15% <strong>of</strong> production), under the assumption <strong>of</strong> zero stock.11
6 International mungbean tradeCh<strong>in</strong>a’s foreign trade has been expand<strong>in</strong>g rapidly.Foreign trade has been play<strong>in</strong>g an importantrole <strong>in</strong> the national economy s<strong>in</strong>ce reform started<strong>in</strong> the late 1970s. As a result, Ch<strong>in</strong>a’s trade ratio toGDP ratio <strong>in</strong>creased from 13% <strong>in</strong> 1980 to 36% <strong>in</strong>1997. However, Ch<strong>in</strong>a’s agricultural trade has grownslowly, especially <strong>in</strong> comparison with its boom<strong>in</strong>gmerchandise trade. Dur<strong>in</strong>g the same period, thetotal value <strong>of</strong> Ch<strong>in</strong>a’s agricultural trade <strong>in</strong>creasedfrom 9.29 billion US$ to 25.15 billion US$, with anannual growth rate <strong>of</strong> 6.0% (Huang et al. 2000).<strong>The</strong> country’s goal <strong>of</strong> food self-sufficiency has ledpolicymakers to restra<strong>in</strong> imports <strong>of</strong> land-<strong>in</strong>tensivegra<strong>in</strong>s, the production <strong>of</strong> which has a high opportunitycost <strong>in</strong> land-scarce Ch<strong>in</strong>a (Gale 2002).<strong>The</strong> total value <strong>of</strong> mungbean exports has risenover the years, with an average annual growth rate<strong>of</strong> 5.8%. Over the same period, the value <strong>of</strong> agriculturalexports has grown at a rate <strong>of</strong> 3.0% (Table 3).Over the years the share <strong>of</strong> mungbeans <strong>in</strong> the value<strong>of</strong> all agricultural exports has varied between 0.3%and 0.9%, <strong>in</strong>dicat<strong>in</strong>g the relative importance <strong>of</strong> thiss<strong>in</strong>gle commodity.<strong>The</strong> value <strong>of</strong> total agricultural imports has risenmore strongly than that <strong>of</strong> exports, with a rate <strong>of</strong>6.2% annually. In contrast, the value <strong>of</strong> mungbeanimports has decreased strongly over the same period.While <strong>in</strong> 1986 the value <strong>of</strong> all mungbean importsaccounted for 13.6 million US$, the value <strong>of</strong>mungbean imports was only 1.4 million US$ <strong>in</strong> 2000.<strong>The</strong> value <strong>of</strong> mungbean imports to Ch<strong>in</strong>a decreasedat an annual rate <strong>of</strong> 14.4%. This becomes obviousalso <strong>in</strong> the share <strong>of</strong> mungbean imports among allimports. While it was still 0.25% <strong>in</strong> 1986, <strong>in</strong> theyear 2000 the value <strong>of</strong> mungbean imports accountedfor only 0.01% <strong>of</strong> all agricultural imports. S<strong>in</strong>ce totalmungbean consumption has <strong>in</strong>creased slightlyover the same time period (Fig. 6), this is an <strong>in</strong>dicationthat Ch<strong>in</strong>ese growers are able to meet thedomestic demand for mungbeans.Accord<strong>in</strong>g to data from the Customs GeneralAdm<strong>in</strong>istration <strong>of</strong> Ch<strong>in</strong>a (1993–2000), the quantityand price <strong>of</strong> exported mungbean has changedgreatly over the years s<strong>in</strong>ce 1986 (Fig. 7). In theperiod <strong>of</strong> 1986–1992, the biggest quantity <strong>of</strong>mungbean exports occurred <strong>in</strong> 1986 with more thanTable 3. Share <strong>of</strong> mungbeans <strong>in</strong> total agricultural imports and exports, 1986–2000ExportsImportsAgricultural a <strong>Mungbean</strong> b Share Agricultural a <strong>Mungbean</strong> b ShareYear (US$ mil) (US$ mil) (%) (US$ mil) (US$ mil) (%)1986 7 864 45 0.57 5 467 13.6 0.251987 9 082 28 0.31 7 561 9.5 0.131988 10 326 42 0.41 9 763 7.9 0.081989 10 476 33 0.32 11 068 8.8 0.081990 10 208 50 0.49 9 791 0.6 0.011991 11 624 51 0.44 9 429 0.2 0.001992 12 045 36 0.30 9 800 2.4 0.021993 12 197 48 0.39 8 569 4.4 0.051994 14 580 80 0.55 12 419 4.0 0.031995 14 364 104 0.72 18 272 0.2 0.001996 14 344 55 0.38 17 513 3.1 0.021997 13 447 59 0.44 16 324 1.6 0.011998 12 107 66 0.55 13 342 2.0 0.011999 11 776 109 0.93 12 863 0.4 0.002000 13 076 50 0.38 15 349 1.4 0.01Annual rate 3.1% 5.8% 6.2% -14.4%Source: a FAOSTAT (2001), b Ch<strong>in</strong>ese Foreign Economy and Trade Yearbook, 1987–2001.12
200,000 tons exported, followed <strong>in</strong> 1990 with morethan 150,000 tons. <strong>The</strong> highest price <strong>of</strong> export occurred<strong>in</strong> 1992 when the annual average export pricewas 563 US$/ton. <strong>The</strong> second highest price occurred<strong>in</strong> 1989, about 420 US$/ton. <strong>The</strong> annual averageprice <strong>of</strong> export was between 220 US$/tonand 320 US$/ton <strong>in</strong> the rema<strong>in</strong><strong>in</strong>g years. Dur<strong>in</strong>gthe period <strong>of</strong> 1986–1992, the annual average price<strong>of</strong> export was 352 US$/ton, the accumulated exportwas 888,000 tons, and the annual export wasnearly 130,000 tons.Dur<strong>in</strong>g 1993–2000, the quantity and price <strong>of</strong>export <strong>of</strong> mungbean <strong>in</strong>creased to some extent comparedto the period <strong>of</strong> 1986–1992. However, quantityand prices also differed greatly across years.In this period, the quantity <strong>of</strong> exports was largest <strong>in</strong>1999, when they were 290,000 tons. Meanwhile,the export price changed over years. <strong>The</strong> highestannual average price was 766 US$/ton <strong>in</strong> 1997,whereas the lowest annual average price was 377US$/ton two years later <strong>in</strong> 1999, when exports werehighest. Dur<strong>in</strong>g the period from 1993–2000, theannual average price <strong>of</strong> export was 551 US$/ton,the accumulated export was 1,160,000 tons, andthe annual quantity <strong>of</strong> export was about 145,000tons.Ch<strong>in</strong>a exports mungbean to more than 60 countriesand regions. <strong>The</strong> largest share <strong>of</strong> exports goesto Japan. In addition, Vietnam, Philipp<strong>in</strong>es, UnitedStates, Korea, Netherlands, Hong Kong, Taiwan,England, Canada, France, Indonesia and Belgium,are major importers <strong>of</strong> Ch<strong>in</strong>ese mungbean.For <strong>in</strong>stance <strong>in</strong> 2000, Ch<strong>in</strong>a exported 88,000MT <strong>of</strong> mungbean. Of these, 40,000 MT were exportedto Japan, account<strong>in</strong>g for 46% <strong>of</strong> all mungbeanexports. Other major importers <strong>of</strong> Ch<strong>in</strong>esemungbean (with imports exceed<strong>in</strong>g 1000 MT) werethe United States (8144 MT) Vietnam (7645 MT),Korea (7199 MT), Taiwan (4466 MT), Netherlands(4170 MT), Hong Kong (3730 MT), United K<strong>in</strong>gdom(2479 MT), Canada (2495 MT), Philipp<strong>in</strong>es (1760MT) and France (1289 MT); these countries togetheraccounted for 50.7% <strong>of</strong> the total export quantity.350000120000300000100000250000Export (MT)200000150000100000800006000040000Export Value (1000 US$)500002000001986 1987 1988 1989 1990 1991 1992 1993 1994 1995 1996 1997 1998 1999 20000Export (MT)Value (1000 US$)Fig. 7. <strong>Mungbean</strong> exports <strong>in</strong> quantity and value, 1986–2000Source: Ch<strong>in</strong>ese Foreign Economy and Trade Yearbook, 1987–2001.13
Compared to mungbean exports, the annualaverage quantity <strong>of</strong> imports has decreased sharplyover the years (see also Table 3). However, the averageprice <strong>of</strong> mungbean imports has rema<strong>in</strong>ed relativelysteady (Fig. 8). More specifically, imports <strong>of</strong>mungbean were relatively large <strong>in</strong> 1986 and 1987.After 1990, as the Ch<strong>in</strong>ese mungbean production<strong>in</strong>creased, the quantity <strong>of</strong> imports decreased. After1990, the import price steadied at the level <strong>of</strong> about300 US$/ton.Important providers <strong>of</strong> mungbean imports toCh<strong>in</strong>a are Myanmar, with 3885 MT <strong>in</strong> 2000, followedby Australia (559 MT) and Thailand (436 MT).Myanmar provided 78% <strong>of</strong> all mungbeans importedto Ch<strong>in</strong>a for consumption purposes.<strong>The</strong> data shows that Ch<strong>in</strong>a is and has alwaysbeen a net exporter <strong>of</strong> mungbean. <strong>The</strong> quantity <strong>of</strong>net exports has varied along with the fluctuation <strong>in</strong>export and import (Fig. 9). <strong>The</strong> degree <strong>of</strong> fluctuation<strong>in</strong> the quantity <strong>of</strong> net exports was higher dur<strong>in</strong>gthe 1990s than dur<strong>in</strong>g the 1980s. Dur<strong>in</strong>g the 1980s,the highest quantity <strong>of</strong> net exports was 164,000MT (1986), the lowest was 60,000 MT (1989), thegap thus be<strong>in</strong>g 104,000 MT. In contrast, dur<strong>in</strong>g the1990s, the highest quantity <strong>of</strong> net export was288,000 MT (1999), and the lowest was 56,000 MT(1992), the gap hence <strong>in</strong>creas<strong>in</strong>g to 232,000 MT.Net mungbean exports have made up a substantialshare <strong>of</strong> total mungbean production <strong>in</strong> severalyears, with a peak <strong>in</strong> 1999 (37.3%). No consistenttrend can be observed as the share is lessthan 10% <strong>in</strong> several years. Overall, it cannot bedenied that mungbeans are an important exportproduct for the Ch<strong>in</strong>ese economy.400001400035000120003000010000Imports (MT)25000200001500080006000Import Value (1000 US$)1000040005000200001986 1987 1988 1989 1990 1991 1992 1993 1994 1995 1996 1997 1998 1999 20000Import (MT)Import Value (1000 US$)Fig. 8. <strong>Mungbean</strong> imports <strong>in</strong> quantity and value, 1986–2000Source: Ch<strong>in</strong>ese Foreign Economy and Trade Yearbook, 1987–2001.14
40.035.030.0Net exports as share <strong>of</strong> total production25.020.015.010.05.00.01986 1987 1988 1989 1990 1991 1992 1993 1994 1995 1996 1997 1998 1999 2000Fig. 9. Share <strong>of</strong> mungbean net exports <strong>in</strong> total production, 1986–2000Source: Ch<strong>in</strong>ese Foreign Economy and Trade Yearbook, 1987–2001.15
7 Price analysis <strong>of</strong> mungbean <strong>in</strong> Ch<strong>in</strong>a<strong>The</strong> mungbean price varies across regions andseasons, driven by market power. Prices are highest<strong>in</strong> the eastern regions, followed by the centraland western regions. Periodically, the price has apeak <strong>in</strong> June and July and will decrease to its lowestpo<strong>in</strong>t <strong>in</strong> October, then <strong>in</strong>crease aga<strong>in</strong>. In themiddle <strong>of</strong> August, after harvest, the mungbean pricewill usually go down by approximately 20% comparedto the price <strong>in</strong> July. This downward trend willcont<strong>in</strong>ue (usually about 20% aga<strong>in</strong>) <strong>in</strong> Septemberdue to the new harvest sell<strong>in</strong>g on the market. InOctober, the price will atta<strong>in</strong> the lowest level, usually5% less than dur<strong>in</strong>g the previous month, becausethe newly produced mungbean surges <strong>in</strong> themarket. After that, the price will take an upwardtrend aga<strong>in</strong>, due to the decreased supply, at a rate<strong>of</strong> 5 to 10% per month. <strong>The</strong> biggest variation <strong>in</strong>prices occurs dur<strong>in</strong>g the months <strong>of</strong> October andNovember, as a result <strong>of</strong> the large quantities traded<strong>in</strong> this period, and the variation <strong>in</strong> this period willhave an important impact on the price level <strong>in</strong> theperiod <strong>of</strong> January to July <strong>of</strong> the follow<strong>in</strong>g year.7.1 <strong>The</strong> trend <strong>of</strong> mungbean pricechanges <strong>in</strong> 1986–2000<strong>The</strong> national average market price <strong>of</strong> mungbean<strong>in</strong>creased steadily from 1986 to 1997. It decreased<strong>in</strong> 1998–99 and then went up aga<strong>in</strong> <strong>in</strong> 2000, asshown <strong>in</strong> Fig. 10. <strong>The</strong>re were two major driv<strong>in</strong>g forcesfor the downward turn <strong>in</strong> 1998 and 1999: 1) the decrease<strong>in</strong> world market prices, and 2) a decrease<strong>in</strong> the quality <strong>of</strong> mungbean due to bad weather. <strong>The</strong>real price <strong>of</strong> mungbean has grown with an annualaverage growth rate <strong>of</strong> 5.7%, and prices have <strong>in</strong>creased2.3 fold between 1986 and 2000.For comparison, the producer price for paddyrice developed much less favorably for producers.2.5Average annual growth = 5.7%2.0Real price (Yuan/kg)1.51.00.50.01986 1987 1988 1989 1990 1991 1992 1993 1994 1995 1996 1997 1998 1999 2000Fig. 10. <strong>Mungbean</strong> real price, 1986–2000Source: Ch<strong>in</strong>a Price Information Center (2002). World Bank <strong>in</strong>dicators for Consumer Price Index Prices before 1997 have beenextrapolated based on chang<strong>in</strong>g patterns <strong>in</strong> the mungbean market.16
Unfortunately, data is available only from 1986through 1995, but the real price dur<strong>in</strong>g this timedecreased by an average <strong>of</strong> 0.6% annually, the producerreceiv<strong>in</strong>g slightly less <strong>in</strong> 1995 than he wouldhave received <strong>in</strong> 1986 (estimation based onFAOSTAT data). For two other gra<strong>in</strong> products, wheatand maize, data is available from 1990 through 1998(World Bank 2002). Real producer prices <strong>in</strong>creasedat an average annual rate <strong>of</strong> 1.1 and 3.0% for riceand wheat, respectively. In sum, among those fourcrops, the price development for mungbean wasmost favorable to producers (Table 4).Table 4. Development <strong>of</strong> real price for differentcommoditiesAverageCommodity annual growth rate Years<strong>Mungbean</strong> a 5.7% 1986–2000Paddy rice b -0.6% 1986–1995Wheat c 1.1% 1990–1998Maize c 3.0% 1990–1998Sources: a Ch<strong>in</strong>a Price Information Center (2002), b FAOSTATonl<strong>in</strong>e, c World Bank (2002).7.2 Price changes due to seasonalvariation<strong>The</strong> impacts <strong>of</strong> seasonal variation and regioncan be estimated based on market prices <strong>of</strong>mungbean. <strong>The</strong> Ch<strong>in</strong>a Price Information Centercollects this <strong>in</strong>formation. <strong>The</strong>ir survey covers hundreds<strong>of</strong> cities <strong>in</strong> all prov<strong>in</strong>ces <strong>in</strong> Ch<strong>in</strong>a. <strong>The</strong> marketprice <strong>of</strong> mungbean is collected three times permonth from selected markets located <strong>in</strong> thesampled cities. Unfortunately, only data from January1997 to May 1999 is available. Still, the <strong>in</strong>formationembodied <strong>in</strong> the data allows for an analysis<strong>of</strong> the variation pattern <strong>of</strong> mungbean prices by seasonand by region, s<strong>in</strong>ce it <strong>in</strong>cludes 8260 observations.An equality test by seasonal classificationis used to test whether the means <strong>of</strong> prices <strong>in</strong> fourseasons differ significantly.hypothesis can be rejected at the 1% significancelevel.Table 5. Category statistics by seasonSeason N Mean Std. dev.Spr<strong>in</strong>g 2925 2.74 0.67Summer 2063 2.90 0.69Autumn 1527 3.22 0.56W<strong>in</strong>ter 1745 3.05 0.64All 8260 2.93 0.67ANOVA df Value ProbabilityF-statistic 3, 8256 200.48 0.000Table 6 gives the results <strong>of</strong> the test <strong>of</strong> the nullhypothesis that the means <strong>of</strong> mungbean price <strong>in</strong>each pair <strong>of</strong> seasons are equal. Hence, there are 6tests. <strong>The</strong> t-test and F-statistic <strong>of</strong> each test <strong>in</strong>dicatethat each <strong>of</strong> the six null hypotheses can berejected at the 5% significance level. Thus, it canbe concluded that the changes <strong>in</strong> mungbean pricedue to seasonal variation are significant not onlyamong all seasons but also between each pair <strong>of</strong>seasons. That is, seasonal variation has a significanteffect on the change <strong>in</strong> mungbean price.Table 6. Test for equality <strong>of</strong> means <strong>of</strong> price betweenseasonsSummer Autumn W<strong>in</strong>ter RemarkSpr<strong>in</strong>g 8.08 23.61 15.16 t-test65.32 557.35 229.93 F-statisticSummer 14.78 6.72 t-test218.37 45.11 F-statisticAutumn 8.15 t-test66.44 F-statisticTable 5 gives the descriptive statistics <strong>of</strong>mungbean price by season and the results <strong>of</strong> thetest <strong>of</strong> the null hypothesis that all means are equal.By the F-statistic value given <strong>in</strong> the table, the null17
7.3 Price differences amongregionsSimilar to section 7.2 and based on the samedatabase, <strong>in</strong> this section the regional effects onthe price <strong>of</strong> mungbean are estimated. For analysis,all prov<strong>in</strong>ces are aggregated <strong>in</strong>to six regions:North: Beij<strong>in</strong>g, Tianj<strong>in</strong>, Hebei, Shanxi, InnerMongolia;Northeast: Liaon<strong>in</strong>g, Jil<strong>in</strong>, Heilongjiang;East: Shanghai, Jiansu, Zhejiang, Anhui, Fujian,Jiangxi, Shangdong;Central: Henan, Hubei, Hunan, Guangdong,Guangxi, Ha<strong>in</strong>an;Southwest: Chongq<strong>in</strong>g, Sichuan, Huizhou,Yunnan, Tibet;Northwest: Shaanxi, Gansu, Q<strong>in</strong>ghai, N<strong>in</strong>gxia,X<strong>in</strong>jiang.Table 7 shows that the free market price <strong>of</strong>mungbean is highest <strong>in</strong> the northeast, followed byTable 7. Category statistics by regionRegion N Mean Std. dev.North 1186 2.83 0.65Northeast 927 3.20 0.74East 2097 3.08 0.57Central 1976 2.85 0.77Southwest 859 2.82 0.55Northwest 1215 2.79 0.60All 8260 2.93 0.67ANOVA df Value ProbabilityF-statistic 5, 8254 81.87 0.000the price <strong>in</strong> the east. <strong>The</strong> lowest price is found <strong>in</strong>the northwest. <strong>The</strong> ANOVA <strong>in</strong>dicates that the nullhypothesis that all means are equal can be rejected.That is, as a whole, mungbean prices are not homogeneousamong the six regions. Hence, as awhole, regional differences have a significant effecton the change <strong>in</strong> mungbean price.However, the impact <strong>of</strong> regional differencesbetween different pair <strong>of</strong> regions on the change <strong>in</strong>mungbean price differs. <strong>The</strong>re are 15 pairs <strong>of</strong> regionsout <strong>of</strong> the six regions. While mungbean priceschange more significantly <strong>in</strong> some pairs <strong>of</strong> regions,they change less significantly <strong>in</strong> other pairs <strong>of</strong> regions.<strong>The</strong> t-test values and ANOVA F-test valuesfor the 15 pairs <strong>of</strong> regions are listed <strong>in</strong> Table 8.<strong>The</strong> test statistics <strong>in</strong>dicate that there is no statisticallysignificant difference <strong>in</strong> the follow<strong>in</strong>g pairs<strong>of</strong> regions: north and central, north and southwest,north and northwest, central and southwest, southwestand northwest. That is, the mungbean price<strong>in</strong> these regions is relatively homogeneous.However, there are significant differences <strong>in</strong> themungbean price between the follow<strong>in</strong>g pairs <strong>of</strong> regions:north and northeast, north and east, northeastand east, northeast and central, northeast andsouthwest, northeast and northwest, east and central,east and southwest, east and northwest, centraland northwest. Note that the mungbean price<strong>in</strong> the northeast region is significantly different fromthat <strong>in</strong> all other regions, and so is the price <strong>in</strong> east.In fact, as shown <strong>in</strong> Table 8, the price <strong>in</strong> northeastis the highest, followed by the price <strong>in</strong> the east.Table 8. Test for equality <strong>of</strong> means <strong>of</strong> price between regionsNortheast East Central Southwest Northwest RemarkNorth 12.42 11.78 1.05 0.27 1.29 t-test154.23 138.83 1.11 0.07 1.66 F-statisticNortheast 4.81 11.55 12.35 14.16 t-test23.17 133.49 152.46 200.47 F-statisticEast 10.87 11.56 13.86 t-test118.23 133.54 192.04 F-statisticCentral 1.22 2.36 t-test1.49 5.58 F-statisticSouthwest 0.99 t-test0.98 F-statistic18
In addition to these parameterizations, exogenousgrowth <strong>in</strong> supply and demand is considered.<strong>The</strong> exogenous growth rate <strong>in</strong> demand due to growth<strong>in</strong> population and <strong>in</strong>come is estimated as the populationgrowth rate + (<strong>in</strong>come elasticity * <strong>in</strong>comegrowth rate), while the exogenous growth rate <strong>of</strong>supply is the area growth rate and the yield growthrate that are not attributable to research. We approximatethe latter by us<strong>in</strong>g growth rates for totalgra<strong>in</strong> production.8.2 Estimation <strong>of</strong> consumer andproducer surplusBased on the methodology described above,this section describes the results obta<strong>in</strong>ed from theestimation <strong>of</strong> consumer and producer surplus. Annex3 summarizes the <strong>in</strong>formation that is used toestimate consumer and producer surplus <strong>of</strong>mungbean research <strong>in</strong> Ch<strong>in</strong>a from 1986 through2000. <strong>The</strong> basic model perta<strong>in</strong>s to a closedeconomy where the impacts are conf<strong>in</strong>ed to thedomestic economy <strong>of</strong> the nation as a whole. Thisis a somewhat simplistic assumption, s<strong>in</strong>ce Ch<strong>in</strong>adoes import and export mungbeans from the worldmarket <strong>in</strong> substantial quantities and Ch<strong>in</strong>a’s tradedquantities are so large that they can be expectedto affect the world market price, thus <strong>in</strong>fluenc<strong>in</strong>gdomestic consumer prices.<strong>The</strong> estimation <strong>of</strong> total producer and consumersurplus depends crucially on the size <strong>of</strong> k, the reduction<strong>in</strong> cost per unit <strong>of</strong> production. Unit cost reductionthrough mungbean research has beenachieved through several means. Firstly, total yieldhas <strong>in</strong>creased by an annual rate <strong>of</strong> 0.7%, ris<strong>in</strong>g froman average <strong>of</strong> 915 kg/ha <strong>in</strong> 1986 to 1154 kg/ha <strong>in</strong>2000. Consider<strong>in</strong>g that <strong>in</strong>put to production has rema<strong>in</strong>edconstant, this alone signifies a cost reduction<strong>of</strong> approximately 25% over the years. Secondly,the new varieties are resistant to pests and diseases,so that expenditure for pesticides are less,approximately by 50%. And thirdly, the new varietiesgrow more erect and mature at the same time,so that labor cost for harvest<strong>in</strong>g is reduced, aga<strong>in</strong>by approximately 50%. 5 Based on this <strong>in</strong>formation,an assumption <strong>of</strong> an average <strong>of</strong> 20% cost reductionfor farmer’s production seems reasonable.However, <strong>in</strong> the follow<strong>in</strong>g estimation we also <strong>in</strong>cludea more conservative estimate, at 10% cost reduction,and a more optimistic estimate, at 25% costreduction.Table 9 summarizes the net present value andthe <strong>in</strong>ternal rate <strong>of</strong> return (IRR) for the cash flow, aswell as the benefit/cost ratio <strong>of</strong> the <strong>in</strong>vestment underthe assumption <strong>of</strong> a closed economy, and <strong>in</strong>clud<strong>in</strong>gresearch costs only for Ch<strong>in</strong>a. Under allscenarios the change <strong>in</strong> surplus is estimated to belarger for consumers than for producers, by approximatelyone-third. Even under the most conservativeassumption <strong>of</strong> only 10% reduction <strong>in</strong> cost perunit to producers, the total net present value <strong>of</strong> benefits<strong>of</strong> mungbean research is estimated to be 52.9million US$. <strong>The</strong> benefit/cost ratio is 16.2, and the<strong>in</strong>ternal rate <strong>of</strong> return is 80.4%—this means thatevery US$ <strong>in</strong>vested paid <strong>of</strong>f with 80.4 cents. Underthe most optimistic scenario <strong>of</strong> a 25% cost reductionper unit production cost, the IRR rises to119.9%, <strong>in</strong>dicat<strong>in</strong>g that every dollar <strong>in</strong>vested reapeda payback <strong>of</strong> 120 cents. In this case, the total surpluschange from 1986 through 2000 accrues to129.9 million US$. <strong>The</strong> analysis <strong>in</strong>dicates thatTable 9. Net present values <strong>of</strong> costs and benefits, and <strong>in</strong>ternal rate <strong>of</strong> return (IRR) <strong>of</strong> mungbeanresearch, closed economyPresent Value <strong>of</strong> R&D BenefitsReturnsScenario Producer Consumer Total Costs (B-C) IRRk (1000 US$) (1000 US$) (1000 US$) (1000 US$) (1000 US$) B/C (%)25% 54 338.5 75 601.4 129 939.9 3 481.5 126 458.4 37.3 119.920% 44 061.0 61 302.3 105 363.4 3 481.5 101 881.9 30.3 108.810% 23 592.6 32 824.6 56 417.2 3 481.5 52 935.7 16.2 80.45 Traditional varieties are sprayed three to four times, while modern varieties are usually sprayed only twice. For harvest<strong>in</strong>g,traditional varieties are usually harvested four to five times, while modern varieties are harvested twice.20
mungbean research has generated high benefits,both for producers and consumers.In the second case we consider that Ch<strong>in</strong>aexports mungbeans to other countries. We also<strong>in</strong>clude AVRDC as a region, s<strong>in</strong>ce mungbean research(<strong>in</strong>clud<strong>in</strong>g tra<strong>in</strong><strong>in</strong>g <strong>of</strong> Ch<strong>in</strong>ese researchers)at AVRDC-ARC has been <strong>in</strong>fluential for the researchsuccess <strong>in</strong> Ch<strong>in</strong>a. Total cost <strong>of</strong> mungbean researchat AVRDC that can be attributed to distribution <strong>of</strong>genetic material to Ch<strong>in</strong>a has been estimated at2.4 million US$, <strong>in</strong>clud<strong>in</strong>g plant breed<strong>in</strong>g, plantphysiology, entomology, plant pathology, travel, andtra<strong>in</strong><strong>in</strong>g. 6Aga<strong>in</strong>, we consider three different scenarios forthe reduction <strong>in</strong> production cost, 10%, 20% and25%. Note that the surplus for Ch<strong>in</strong>ese consumersis now slightly lower than for Ch<strong>in</strong>ese producers,but that taken together the surplus change achievedthrough mungbean research is substantial, <strong>of</strong> 105.8million US$ for the Ch<strong>in</strong>ese economy and 22 millionUS$ for consumers <strong>in</strong> import<strong>in</strong>g countries <strong>in</strong>the best scenario, and 42.4 million US$ surpluschange for the Ch<strong>in</strong>ese economy and 9.5 millionUS$ surplus change for consumers <strong>in</strong> mungbeanimport<strong>in</strong>g countries <strong>in</strong> the most conservative estimate<strong>of</strong> 10% cost reduction. Compared to thebasel<strong>in</strong>e scenario <strong>of</strong> a closed economy, the totalIRR is very similar; however, it is slightly reducedfor the Ch<strong>in</strong>ese economy. Yet, even <strong>in</strong> the mostconservative estimate <strong>of</strong> only 10% cost it stillreaches 72.5%, mean<strong>in</strong>g that for every dollar <strong>in</strong>vested72.5 cents have been returned to the Ch<strong>in</strong>esesociety.<strong>The</strong> analysis has shown that the estimation <strong>of</strong>total benefits depends crucially on the size <strong>of</strong> kthat is assumed. Total benefits and the IRR do notdiffer substantially under the assumption <strong>of</strong> closedor trad<strong>in</strong>g economy, but the distribution <strong>of</strong> benefitsbetween Ch<strong>in</strong>ese consumers and those <strong>of</strong> import<strong>in</strong>gregions is affected.Table 10. Net present values <strong>of</strong> costs and benefits, and <strong>in</strong>ternal rate <strong>of</strong> return (IRR) <strong>of</strong> mungbeanresearch, export<strong>in</strong>g economy and AVRDC research cost <strong>in</strong>cludedPresent Value <strong>of</strong> R&D BenefitsReturnsScenario Producer Consumer Total Costs (B-C) IRRk Region (1000 US$) (1000 US$) (1000 US$) (1000 US$) (1000 US$) B/C (%)25% Ch<strong>in</strong>a 56 234.5 49 559.4 105 794.0 3 481.5 102 312.5 30.4 109.0Import<strong>in</strong>g regions 0 21 963.2 21 963.2 0 21 963.2AVRDC 0 0 0 2 131.7 -2 131.7 0Total NPV benefits 56 234.5 71 522.7 127 757.3 5 613.3 122 144.0 22.8 119.420% Ch<strong>in</strong>a 45 589.6 40 184.7 85 774.3 3 481.5 82 292.8 24.6 98.7Import<strong>in</strong>g regions 0 17 799.0 17 799.0 0 17 799.0AVRDC 0 0 0 2 131.7 -2 131.7 0Total NPV benefits 45 589.6 57 983.8 103 573.4 5 613.3 97 960.1 18.5 108.310% Ch<strong>in</strong>a 24 401.5 21 515.8 45 917.3 3 481.5 42 435.8 13.2 72.5Import<strong>in</strong>g regions 0 9 519.6 9 519.6 0 9 519.6AVRDC 0 0 0 2 131.7 -2 131.7 0Total NPV benefits 24 401.5 31 035.4 55 436.9 5 613.2 49 823.7 9.9 80.06 Estimate provided by S. Shanmugasundaram, Plant Breeder and Deputy Director General for <strong>Research</strong> at AVRDC.21
9 <strong>Impact</strong> <strong>of</strong> mungbean research on thedevelopment <strong>of</strong> human capital<strong>Research</strong> on mungbean germplasm resourceshas been conducted s<strong>in</strong>ce the period <strong>of</strong> SeventhFive-Year-Plan (1986–1990) and Eighth Five-Year-Plan (1991–1995). <strong>The</strong> Institute <strong>of</strong> Crop GermplasmResources <strong>of</strong> CAAS leads this research. <strong>The</strong> <strong>in</strong>stitute,<strong>in</strong> cooperation with other <strong>in</strong>stitutes from 25prov<strong>in</strong>ces, collects, stores, identifies, and coord<strong>in</strong>atesthe research usage <strong>of</strong> mungbean germplasmresources. Thirty researchers from the Institute <strong>of</strong>Crop Germplasm Resources and about 70 researchersfrom other <strong>in</strong>stitutes participated <strong>in</strong> this research.It is estimated that more than 100 scientists <strong>in</strong> thefield <strong>of</strong> mungbean research have been tra<strong>in</strong>ed dur<strong>in</strong>gthe course <strong>of</strong> the project.Furthermore, CAAS has cooperated withAVRDC s<strong>in</strong>ce 1983. Four researchers from CAAShave taken part <strong>in</strong> the tra<strong>in</strong><strong>in</strong>g courses at AVRDC-ARC. Meanwhile, CAAS founded the Association<strong>of</strong> <strong>Mungbean</strong> <strong>Research</strong> <strong>in</strong> order to strengthen researchefforts.<strong>The</strong> follow<strong>in</strong>g publications <strong>of</strong> mungbean research<strong>in</strong> Ch<strong>in</strong>a have been published:• “Compilation <strong>of</strong> Papers on Technology and Utilization<strong>of</strong> AVRDC—Improved <strong>Mungbean</strong>s <strong>in</strong>Ch<strong>in</strong>a,” which was edited by Institute <strong>of</strong> CropGermplasm Resources, CAAS, Department <strong>of</strong>Science & Technology, M<strong>in</strong>istry <strong>of</strong> Agriculture<strong>of</strong> the People’s Republic <strong>of</strong> Ch<strong>in</strong>a (MAPRC),and AVRDC-ARC, published by Ch<strong>in</strong>a AgriculturalPress <strong>in</strong> 1993.• “Proceed<strong>in</strong>g on Technology and Utilization <strong>of</strong><strong>Mungbean</strong> <strong>in</strong> Ch<strong>in</strong>a,” which was also edited byInstitute <strong>of</strong> Crop Germplasm Resources,CAAS, Department <strong>of</strong> Science & Technology,MAPRC and AVRDC-ARC, published by Ch<strong>in</strong>aAgricultural Press <strong>in</strong> 1999.• “<strong>Mungbean</strong>,” written by Cheng Xuzhen, publishedby Ch<strong>in</strong>a Agricultural Press <strong>in</strong> 1996.22
10 Summary<strong>Mungbean</strong> has been an important legume crop<strong>in</strong> Ch<strong>in</strong>a for centuries; however, production decl<strong>in</strong>eddur<strong>in</strong>g the 1960s due to the agricultural policies <strong>of</strong>the Ch<strong>in</strong>ese government. Dur<strong>in</strong>g the 1980s,mungbean production levels gradually recovered <strong>in</strong>large part due to the development <strong>of</strong> improved varietiesby Ch<strong>in</strong>ese researchers work<strong>in</strong>g with AVRDC.In 1986, the total area under mungbean was547,000 ha, total production was 500,000 tons andthe average yield was 914 kg/ha. Between 1986and 2000, total mungbean production <strong>in</strong>creased byan annual average <strong>of</strong> 2.4%, largely due to yield <strong>in</strong>creases(1.7% annually). In 2000, the total areaunder mungbean production was nearly 772,000 ha,total production was 891,000 tons, and the averageyield <strong>in</strong>creased to 1154 kg/ha.Much <strong>of</strong> the production today is located <strong>in</strong> theYellow River valley, Huai River valley, Huabei pla<strong>in</strong>,and northeastern Ch<strong>in</strong>a. <strong>The</strong> prov<strong>in</strong>ces can be separated<strong>in</strong>to two regions by the ma<strong>in</strong> varieties grown.One is the ‘M<strong>in</strong>g Lu dou’ region, which conta<strong>in</strong>sJil<strong>in</strong> and Inner Mongolia; the other is the ‘Zai Ludou’ region, which conta<strong>in</strong>s Henan, Shandong,Shanxi, Shannxi, Hebei, and Anhui.Compared to the production <strong>of</strong> total pulses anddry beans, the share <strong>of</strong> mungbeans has risensteadily. In 1986, 9% <strong>of</strong> all pulses produced <strong>in</strong> Ch<strong>in</strong>awere mungbeans; <strong>in</strong> 2000, the share rose to 19%.In 1986, 35% <strong>of</strong> all dry beans grown weremungbeans; <strong>in</strong> 2000 the share rose to 66%. Withregard to consumption, annual per capita mungbeanconsumption fluctuated between 0.3 and 0.5 kgdur<strong>in</strong>g the period 1986–2000. <strong>The</strong> share <strong>of</strong> mungbeanconsumption <strong>in</strong> total pulse consumption has risensteadily, from 14.2% <strong>in</strong> 1986 to 28.0% <strong>in</strong> 2000.Similarly, the total value <strong>of</strong> mungbean exportshas risen over the years, with an average annualgrowth rate <strong>of</strong> 5.8%, from 45 million US$ <strong>in</strong> 1986 to50 million US$ <strong>in</strong> 2000. Over the years, the share <strong>of</strong>mungbeans <strong>in</strong> the value <strong>of</strong> all agricultural exportshas varied between 0.3% and 0.9%, <strong>in</strong>dicat<strong>in</strong>g therelative importance <strong>of</strong> this s<strong>in</strong>gle commodity. In contrast,the value <strong>of</strong> mungbean imports has decreasedstrongly, at an annual rate <strong>of</strong> 14.4%. <strong>Mungbean</strong>saccounted for 0.25% <strong>of</strong> agricultural imports <strong>in</strong> 1986(13.6 million US$), but only 0.01% <strong>of</strong> agriculturalimports (1.4 million US$) <strong>in</strong> 2000. <strong>The</strong>se data <strong>in</strong>di-cate that Ch<strong>in</strong>ese mungbean growers are able tomeet the domestic demand for mungbeans. Ch<strong>in</strong>ais and has always been a net exporter <strong>of</strong> mungbean.<strong>The</strong> real price <strong>of</strong> mungbean has grown at anannual average growth rate <strong>of</strong> 5.7% between 1986and 2000, a more favorable rate for producers comparedto most other gra<strong>in</strong> crops. <strong>The</strong> price analysishas shown that mungbean prices vary across regionsand seasons. Prices are highest <strong>in</strong> easternregions and lowest <strong>in</strong> the west. Periodically, theprice has a peak <strong>in</strong> June and July and will decreaseto its lowest po<strong>in</strong>t <strong>in</strong> October, then <strong>in</strong>crease aga<strong>in</strong>.<strong>The</strong> biggest variation <strong>in</strong> prices occurs dur<strong>in</strong>g themonths <strong>of</strong> October and November as a result <strong>of</strong> thelarge quantities traded <strong>in</strong> this period and the variation<strong>in</strong> this period has an important impact on theprice level <strong>in</strong> the period <strong>of</strong> January to July <strong>of</strong> thefollow<strong>in</strong>g year.<strong>The</strong> cost-benefit analysis has shown that thebenefits <strong>of</strong> this research <strong>in</strong>vestment have been substantial.Under the scenario <strong>of</strong> a closed economy,and not <strong>in</strong>clud<strong>in</strong>g AVRDC’s research cost, the netpresent value <strong>of</strong> total benefits ranges from 129.9 to52.9 million US$, depend<strong>in</strong>g on the reduction <strong>in</strong> productioncost for farmers. <strong>The</strong> sensitivity analysis isbased on the assumption that the reduction <strong>in</strong> productioncost due to new improved varieties lies between25 and 10%. <strong>The</strong> IRR <strong>in</strong> this scenario rangesfrom 119.9 to 80.4%. Includ<strong>in</strong>g the benefits <strong>of</strong> thisresearch to consumers from other countries, andalso <strong>in</strong>clud<strong>in</strong>g the research cost for AVRDC, thenet present value <strong>of</strong> research benefits rema<strong>in</strong>s approximatelythe same, at 127.8 to 49.8 million US$.<strong>The</strong> IRR is slightly lower under this assumption,rang<strong>in</strong>g from 119.4% under the 25% cost reductionscenario to 80.0% under the 10% cost reductionscenario. In summary, mungbean research has beena highly productive <strong>in</strong>vestment.In the future, the scope <strong>of</strong> mungbean researchand production <strong>in</strong> Ch<strong>in</strong>a will get broader. Cooperationwith AVRDC, other <strong>in</strong>ternational research organizations,and NARS <strong>of</strong> other countries will bestrengthened. Breed<strong>in</strong>g programs will develop newvarieties that resist pests and are more suitable forproduction <strong>of</strong> starch, vermicelli, sprouts, and beverages.Other priorities are to improve the mungbeanseed production <strong>in</strong>dustry and to promote the <strong>in</strong>tegration<strong>of</strong> mungbean <strong>in</strong>to local cropp<strong>in</strong>g systems.23
BibliographyAlston, J.M., G.W. Norton, and P.G. Pardey. 1998.Science under scarcity: pr<strong>in</strong>ciples and practicesfor agricultural research evaluation and priority sett<strong>in</strong>g.Wall<strong>in</strong>gford, United K<strong>in</strong>gdom, CAB International(CABI).AVRDC. 1997. <strong>Mungbean</strong> as a better dietary ironsource for South Asia. In: AVRDC 1997 progressreport. Shanhua, Taiwan: Asian Vegetable <strong>Research</strong>and Development Center, AVRDC Publication No.98-481, pp. 129–131.AVRDC. 1998. Factors <strong>in</strong>volved <strong>in</strong> enhancement <strong>of</strong>iron bioavailability <strong>in</strong> vegetables by cook<strong>in</strong>g. In:AVRDC 1998 progress report. Shanhua, Taiwan:Asian Vegetable <strong>Research</strong> and Development Center,AVRDC Publication No. 99-492, pp. 89–92.AVRDC. 1999. Iron bioavailability <strong>of</strong> vegetables. In:AVRDC 1999 progress report. Shanhua, Taiwan:Asian Vegetable <strong>Research</strong> and Development Center,AVRDC Publication No. 00-503, pp. 70–72.Calloway, D.H., S.P. Murphy, and S. Bunch. 1994.User’s guide to the <strong>in</strong>ternational m<strong>in</strong>ilist nutrientdata base. Department <strong>of</strong> Nutritional Sciences,University <strong>of</strong> California, Berkeley, CA.Chen, C.Y, S.C.S. Tsou, and H.H. Wang. 1987.Utilization pattern <strong>of</strong> mungbean <strong>in</strong> the Ch<strong>in</strong>ese diet.In: S. Shanmugasundaram (ed.). <strong>Mungbean</strong>: proceed<strong>in</strong>gs<strong>of</strong> the second <strong>in</strong>ternational symposium.Shanhua, Taiwan: Asian Vegetable <strong>Research</strong> andDevelopment Center, AVRDC Publication No. 88-304, pp. 498–507.Ch<strong>in</strong>a Price Information Center. 2002. .Ch<strong>in</strong>ese Foreign Economy and Trade Yearbook.1987–2001. Ch<strong>in</strong>ese Foreign Economy and TradePress.Customs General Adm<strong>in</strong>istration <strong>of</strong> Ch<strong>in</strong>a. 1993–2000. Ch<strong>in</strong>ese Custom Statistical Yearbook.Gale, Fred (ed.). 2002. Ch<strong>in</strong>a’s food and agriculture:issues for the 21st century. Wash<strong>in</strong>gton DC:Market and Trade Economics Division, Economic<strong>Research</strong> Service, U.S. Department <strong>of</strong> Agriculture.Agriculture Information Bullet<strong>in</strong> No. 775.Henan Statistical Bureau. 1986–2001. Henan ruralstatistics. Henan Statistics Press.Huang, J., S. Rozelle, and F. Tuan. 2000. Tradeliberalization and Ch<strong>in</strong>a’s food economy <strong>in</strong> the 21 stcentury: implications to Ch<strong>in</strong>a’s national food security.University <strong>of</strong> California-Davis, unpublishedmanuscript.M<strong>in</strong>istry <strong>of</strong> Agriculture <strong>of</strong> Ch<strong>in</strong>a. 2001. Ch<strong>in</strong>ese agriculturaldevelopment report. People’s Republic <strong>of</strong>Ch<strong>in</strong>a.M<strong>in</strong>istry <strong>of</strong> Agriculture <strong>of</strong> Ch<strong>in</strong>a. 2002. <strong>The</strong> stateand outlook <strong>of</strong> Ch<strong>in</strong>a’s food security. People’s Republic<strong>of</strong> Ch<strong>in</strong>a.M<strong>in</strong>istry <strong>of</strong> Agriculture <strong>of</strong> Ch<strong>in</strong>a. 1995–2001. Ch<strong>in</strong>eseagricultural statistics <strong>in</strong>formation, issues from1995–2000. People’s Republic <strong>of</strong> Ch<strong>in</strong>a.We<strong>in</strong>berger, K. 2002. <strong>The</strong> impact <strong>of</strong> ironbioavailability-enhanced diets on health and nutrition<strong>of</strong> school children: evidence from a mungbeanfeed<strong>in</strong>g trial <strong>in</strong> Tamil Nadu. Paper presented at the<strong>in</strong>ternational conference on “Why has impact assessmentresearch not made more <strong>of</strong> a difference”<strong>in</strong> San José, Costa Rica, February 4–7, 2002.World Bank. 2002. World development <strong>in</strong>dicators,CD-ROM, Wash<strong>in</strong>gton DC: World Bank.Zheng, Diansheng, et al. (2002). <strong>The</strong> cultivated technologies<strong>of</strong> high quality m<strong>in</strong>or miscellaneous gra<strong>in</strong>crop. Ch<strong>in</strong>a Agriculture Press.Zhengzhou Commodity Exchange. 2002. .FAOSTAT. 2001. FAO Statistical Databases, CD-ROM, Rome: Food and Agriculture Organization <strong>of</strong>the United Nations.24
AnnexesAnnex 1. Estimation <strong>of</strong> mungbean supply elasticityDependent Variable: LNPRODMethod: Least SquaresSample: 1986 2000Included observations: 15Convergence achieved after 37 iterationsBackcast: 1984 1985Variable Coefficient Std. error t-test Prob.C 6.454271 0.017006 379.5298 0.0000LNREALP 0.317138 0.052420 6.049913 0.0001MA(1) -1.405472 0.586004 -2.398403 0.0353MA(2) -0.895469 0.587528 -1.524129 0.1557R-squared 0.768969 Mean dependent var 6.552028Adjusted R-squared 0.705961 S.D. dependent var 0.154749S.E. <strong>of</strong> regression 0.083913 Akaike <strong>in</strong>fo criterion -1.894885Sum squared resid 0.077456 Schwarz criterion -1.706072Log likelihood 18.21164 F-statistic 12.20425Durb<strong>in</strong>-Watson stat 1.900168 Prob(F-statistic) 0.000801Annex 2. Estimation <strong>of</strong> mungbean demand elasticityDependent Variable: LNCONSMethod: Least SquaresSample: 1986 2000Included observations: 15Convergence achieved after 22 iterationsBackcast: 1984 1985Variable Coefficient Std. error t-test Prob.C -0.869827 0.063525 -13.69258 0.0000LNREALP -0.230843 0.098478 -2.344101 0.0389MA(1) 1.115842 0.055864 19.97412 0.0000MA(2) 0.979504 0.001005 974.7231 0.0000R-squared 0.694433 Mean dependent var -0.906601Adjusted R-squared 0.611096 S.D. dependent var 0.113349S.E. <strong>of</strong> regression 0.070687 Akaike <strong>in</strong>fo criterion -2.237939Sum squared resid 0.054963 Schwarz criterion -2.049126Log likelihood 20.78455 F-statistic 8.332874Durb<strong>in</strong>-Watson stat 1.966269 Prob(F-statistic) 0.00357725
Annex 3. Values for estimation <strong>of</strong> producer and consumer surplusParameter Value SourceInitial quantity produced (Q 0) 500,000 MT Fig. 2Initial producer price (PP 0) 191.1 US$/ ton World Bank, World DevelopmentIndicators for exchange rate US$/ RMBInitial quantity consumed (C 0) 500,000 MT Fig. 2Initial consumer price (PC 0) 191.1 US$/ ton World Bank, World DevelopmentIndicators for exchange rate US$/ RMBSupply elasticity (ε 0) 0.317 Annex 1Demand elasticity (η 0) -0.231 Annex 2Population growth rate 1.2% World Bank, World Development IndicatorsIncome growth rate 7.2% World Bank, World Development IndicatorsIncome elasticity 0.263 Fan et al. (1995)Exogenous growth rate supply 1.9% Growth <strong>in</strong> total gra<strong>in</strong> output (Fig. 3)Probability <strong>of</strong> success 100%Maximum adoption rate 85%<strong>Research</strong> lag3 yearsAdoption lag10 yearsNet cost decrease 1%, 2%, 5%, 10% AssumptionTotal research cost to Ch<strong>in</strong>a 4.5 million US$ Chapter 2, World Bank, World DevelopmentIndicators for exchange rate US$/ RMBTotal research cost to AVRDC 2.4 million US$Real discount rate 5%26
AVRDC—<strong>The</strong> World Vegetable Center—