The Impact of Mungbean Research in China
The Impact of Mungbean Research in China
The Impact of Mungbean Research in China
You also want an ePaper? Increase the reach of your titles
YUMPU automatically turns print PDFs into web optimized ePapers that Google loves.
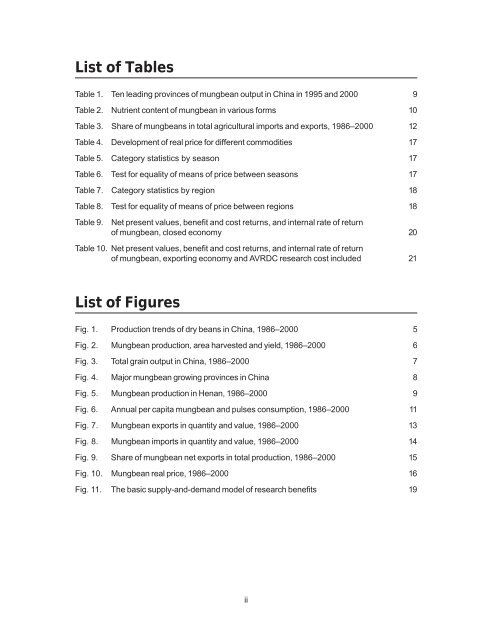
List <strong>of</strong> TablesTable 1. Ten lead<strong>in</strong>g prov<strong>in</strong>ces <strong>of</strong> mungbean output <strong>in</strong> Ch<strong>in</strong>a <strong>in</strong> 1995 and 2000 9Table 2. Nutrient content <strong>of</strong> mungbean <strong>in</strong> various forms 10Table 3. Share <strong>of</strong> mungbeans <strong>in</strong> total agricultural imports and exports, 1986–2000 12Table 4. Development <strong>of</strong> real price for different commodities 17Table 5. Category statistics by season 17Table 6. Test for equality <strong>of</strong> means <strong>of</strong> price between seasons 17Table 7. Category statistics by region 18Table 8. Test for equality <strong>of</strong> means <strong>of</strong> price between regions 18Table 9.Net present values, benefit and cost returns, and <strong>in</strong>ternal rate <strong>of</strong> return<strong>of</strong> mungbean, closed economy 20Table 10. Net present values, benefit and cost returns, and <strong>in</strong>ternal rate <strong>of</strong> return<strong>of</strong> mungbean, export<strong>in</strong>g economy and AVRDC research cost <strong>in</strong>cluded 21List <strong>of</strong> FiguresFig. 1. Production trends <strong>of</strong> dry beans <strong>in</strong> Ch<strong>in</strong>a, 1986–2000 5Fig. 2. <strong>Mungbean</strong> production, area harvested and yield, 1986–2000 6Fig. 3. Total gra<strong>in</strong> output <strong>in</strong> Ch<strong>in</strong>a, 1986–2000 7Fig. 4. Major mungbean grow<strong>in</strong>g prov<strong>in</strong>ces <strong>in</strong> Ch<strong>in</strong>a 8Fig. 5. <strong>Mungbean</strong> production <strong>in</strong> Henan, 1986–2000 9Fig. 6. Annual per capita mungbean and pulses consumption, 1986–2000 11Fig. 7. <strong>Mungbean</strong> exports <strong>in</strong> quantity and value, 1986–2000 13Fig. 8. <strong>Mungbean</strong> imports <strong>in</strong> quantity and value, 1986–2000 14Fig. 9. Share <strong>of</strong> mungbean net exports <strong>in</strong> total production, 1986–2000 15Fig. 10. <strong>Mungbean</strong> real price, 1986–2000 16Fig. 11. <strong>The</strong> basic supply-and-demand model <strong>of</strong> research benefits 19ii


