The Impact of Mungbean Research in China
The Impact of Mungbean Research in China
The Impact of Mungbean Research in China

Create successful ePaper yourself
Turn your PDF publications into a flip-book with our unique Google optimized e-Paper software.
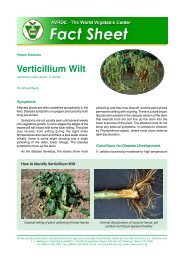
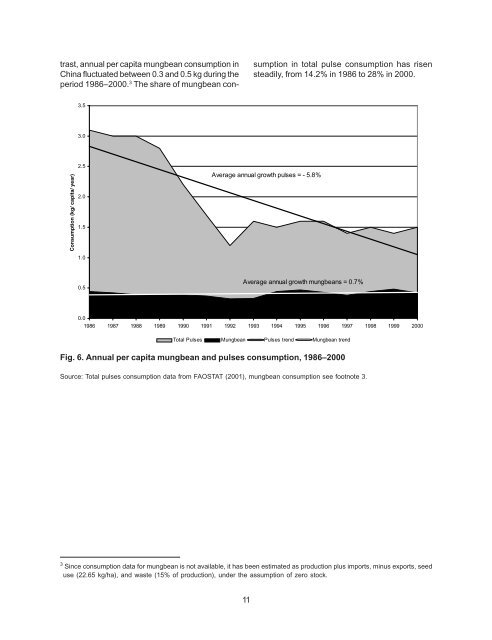
trast, annual per capita mungbean consumption <strong>in</strong>Ch<strong>in</strong>a fluctuated between 0.3 and 0.5 kg dur<strong>in</strong>g theperiod 1986–2000. 3 <strong>The</strong> share <strong>of</strong> mungbean consumption<strong>in</strong> total pulse consumption has risensteadily, from 14.2% <strong>in</strong> 1986 to 28% <strong>in</strong> 2000.3.53.0Consumption (kg/ capita/ year)2.52.01.5Average annual growth pulses = - 5.8%1.00.5Average annual growth mungbeans = 0.7%0.01986 1987 1988 1989 1990 1991 1992 1993 1994 1995 1996 1997 1998 1999 2000Total Pulses <strong>Mungbean</strong> Pulses trend <strong>Mungbean</strong> trendFig. 6. Annual per capita mungbean and pulses consumption, 1986–2000Source: Total pulses consumption data from FAOSTAT (2001), mungbean consumption see footnote 3.3 S<strong>in</strong>ce consumption data for mungbean is not available, it has been estimated as production plus imports, m<strong>in</strong>us exports, seeduse (22.65 kg/ha), and waste (15% <strong>of</strong> production), under the assumption <strong>of</strong> zero stock.11