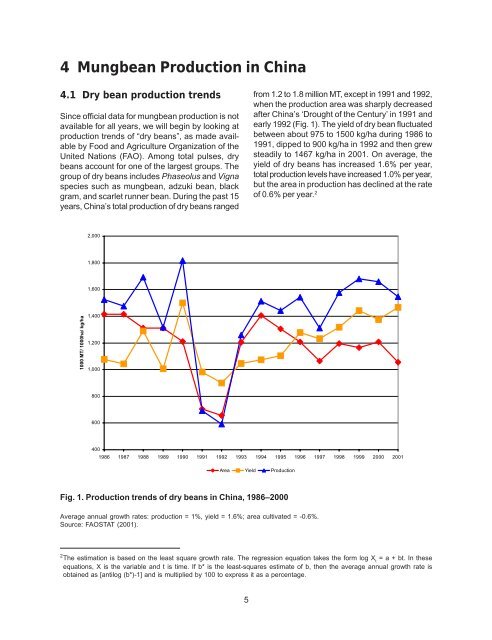
4 <strong>Mungbean</strong> Production <strong>in</strong> Ch<strong>in</strong>a4.1 Dry bean production trendsS<strong>in</strong>ce <strong>of</strong>ficial data for mungbean production is notavailable for all years, we will beg<strong>in</strong> by look<strong>in</strong>g atproduction trends <strong>of</strong> “dry beans”, as made availableby Food and Agriculture Organization <strong>of</strong> theUnited Nations (FAO). Among total pulses, drybeans account for one <strong>of</strong> the largest groups. <strong>The</strong>group <strong>of</strong> dry beans <strong>in</strong>cludes Phaseolus and Vignaspecies such as mungbean, adzuki bean, blackgram, and scarlet runner bean. Dur<strong>in</strong>g the past 15years, Ch<strong>in</strong>a’s total production <strong>of</strong> dry beans rangedfrom 1.2 to 1.8 million MT, except <strong>in</strong> 1991 and 1992,when the production area was sharply decreasedafter Ch<strong>in</strong>a’s ‘Drought <strong>of</strong> the Century’ <strong>in</strong> 1991 andearly 1992 (Fig. 1). <strong>The</strong> yield <strong>of</strong> dry bean fluctuatedbetween about 975 to 1500 kg/ha dur<strong>in</strong>g 1986 to1991, dipped to 900 kg/ha <strong>in</strong> 1992 and then grewsteadily to 1467 kg/ha <strong>in</strong> 2001. On average, theyield <strong>of</strong> dry beans has <strong>in</strong>creased 1.6% per year,total production levels have <strong>in</strong>creased 1.0% per year,but the area <strong>in</strong> production has decl<strong>in</strong>ed at the rate<strong>of</strong> 0.6% per year. 22,0001,8001,6001000 MT/ 1000ha/ kg/ha1,4001,2001,0008006004001986 1987 1988 1989 1990 1991 1992 1993 1994 1995 1996 1997 1998 1999 2000 2001Area Yield ProductionFig. 1. Production trends <strong>of</strong> dry beans <strong>in</strong> Ch<strong>in</strong>a, 1986–2000Average annual growth rates: production = 1%, yield = 1.6%; area cultivated = -0.6%.Source: FAOSTAT (2001).2 <strong>The</strong> estimation is based on the least square growth rate. <strong>The</strong> regression equation takes the form log X t= a + bt. In theseequations, X is the variable and t is time. If b* is the least-squares estimate <strong>of</strong> b, then the average annual growth rate isobta<strong>in</strong>ed as [antilog (b*)-1] and is multiplied by 100 to express it as a percentage.5
4.2 <strong>Mungbean</strong> production trendsS<strong>in</strong>ce mungbean is classified as a miscellaneousgra<strong>in</strong>, data for mungbeans are difficult tocome by. <strong>The</strong> M<strong>in</strong>istry <strong>of</strong> Agriculture providesmungbean production data from 1995 to 2000. Forsome years, data is derived from local statisticalyearbooks. F<strong>in</strong>ally, for some years data is basedon extrapolation from prov<strong>in</strong>cial statistical data.4.2.1 Production levelsDur<strong>in</strong>g the 1950s, Ch<strong>in</strong>a was a major producer<strong>of</strong> mungbean. For example, <strong>in</strong> 1957 the area grownunder mungbean was 1.64 million ha and outputwas nearly 800,000 tons. <strong>Mungbean</strong> yield was relativelylow at only 488 kg/ha, ma<strong>in</strong>ly due to the low<strong>in</strong>putcultivation technology and impurity <strong>of</strong> seed.<strong>Mungbean</strong> production decl<strong>in</strong>ed dur<strong>in</strong>g the1960s. Due to the overall shortage <strong>of</strong> food, thegovernment put more emphasis on other gra<strong>in</strong>s,such as rice and soybean. Dur<strong>in</strong>g the 1980s, however,mungbean production gradually recovered.Through <strong>in</strong>ternational cooperation, new varieties andimproved production practices were developed anddissem<strong>in</strong>ated to farmers.<strong>The</strong>se efforts led to a rise <strong>in</strong> production levels(Fig. 2). In 1986, the area under mungbean was547,000 ha, the total production was 500,000 tons,and yields averaged 915 kg/ha. <strong>The</strong> figure showsthat total production and area have risen with approximatelythe same pattern, with yields rema<strong>in</strong><strong>in</strong>grelatively constant until 1997, when a sharp <strong>in</strong>creasecan be observed. This is attributable to the<strong>in</strong>troduction <strong>of</strong> a new high yield<strong>in</strong>g variety, ZhongLu #2, which produces yields <strong>of</strong> 1800 to 2250 kg/ha and is very popular with farmers.Compared to the production <strong>of</strong> total pulses anddry beans, the share <strong>of</strong> mungbeans has risensteadily. In 1986, approximately 9% <strong>of</strong> all pulses13001200110010001000 MT/ 1000 ha/ kg/ha9008007006005004001986 1987 1988 1989 1990 1991 1992 1993 1994 1995 1996 1997 1998 1999 2000Production (1000 MT) Area (1000 ha) Yield (kg/ ha)Fig. 2. <strong>Mungbean</strong> production, area harvested and yield, 1986–2000Average annual growth rates: production = 2.4%, yield = 1.7%, area cultivated = 0.7%. Source: 1989, 1991 and 1992production figures and area figures from 1986–1994 are estimates based on prov<strong>in</strong>cial yearbooks. Production and areafigures for the rema<strong>in</strong><strong>in</strong>g years have been provided by the M<strong>in</strong>istry <strong>of</strong> Agriculture <strong>of</strong> Ch<strong>in</strong>a (unpublished).6