The Impact of Mungbean Research in China
The Impact of Mungbean Research in China
The Impact of Mungbean Research in China

You also want an ePaper? Increase the reach of your titles
YUMPU automatically turns print PDFs into web optimized ePapers that Google loves.
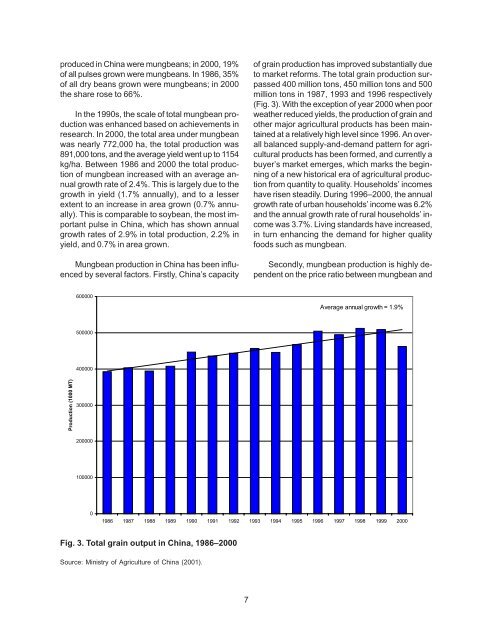
produced <strong>in</strong> Ch<strong>in</strong>a were mungbeans; <strong>in</strong> 2000, 19%<strong>of</strong> all pulses grown were mungbeans. In 1986, 35%<strong>of</strong> all dry beans grown were mungbeans; <strong>in</strong> 2000the share rose to 66%.In the 1990s, the scale <strong>of</strong> total mungbean productionwas enhanced based on achievements <strong>in</strong>research. In 2000, the total area under mungbeanwas nearly 772,000 ha, the total production was891,000 tons, and the average yield went up to 1154kg/ha. Between 1986 and 2000 the total production<strong>of</strong> mungbean <strong>in</strong>creased with an average annualgrowth rate <strong>of</strong> 2.4%. This is largely due to thegrowth <strong>in</strong> yield (1.7% annually), and to a lesserextent to an <strong>in</strong>crease <strong>in</strong> area grown (0.7% annually).This is comparable to soybean, the most importantpulse <strong>in</strong> Ch<strong>in</strong>a, which has shown annualgrowth rates <strong>of</strong> 2.9% <strong>in</strong> total production, 2.2% <strong>in</strong>yield, and 0.7% <strong>in</strong> area grown.<strong>Mungbean</strong> production <strong>in</strong> Ch<strong>in</strong>a has been <strong>in</strong>fluencedby several factors. Firstly, Ch<strong>in</strong>a’s capacity<strong>of</strong> gra<strong>in</strong> production has improved substantially dueto market reforms. <strong>The</strong> total gra<strong>in</strong> production surpassed400 million tons, 450 million tons and 500million tons <strong>in</strong> 1987, 1993 and 1996 respectively(Fig. 3). With the exception <strong>of</strong> year 2000 when poorweather reduced yields, the production <strong>of</strong> gra<strong>in</strong> andother major agricultural products has been ma<strong>in</strong>ta<strong>in</strong>edat a relatively high level s<strong>in</strong>ce 1996. An overallbalanced supply-and-demand pattern for agriculturalproducts has been formed, and currently abuyer’s market emerges, which marks the beg<strong>in</strong>n<strong>in</strong>g<strong>of</strong> a new historical era <strong>of</strong> agricultural productionfrom quantity to quality. Households’ <strong>in</strong>comeshave risen steadily. Dur<strong>in</strong>g 1996–2000, the annualgrowth rate <strong>of</strong> urban households’ <strong>in</strong>come was 6.2%and the annual growth rate <strong>of</strong> rural households’ <strong>in</strong>comewas 3.7%. Liv<strong>in</strong>g standards have <strong>in</strong>creased,<strong>in</strong> turn enhanc<strong>in</strong>g the demand for higher qualityfoods such as mungbean.Secondly, mungbean production is highly dependenton the price ratio between mungbean and600000Average annual growth = 1.9%500000400000Production (1000 MT)30000020000010000001986 1987 1988 1989 1990 1991 1992 1993 1994 1995 1996 1997 1998 1999 2000Fig. 3. Total gra<strong>in</strong> output <strong>in</strong> Ch<strong>in</strong>a, 1986–2000Source: M<strong>in</strong>istry <strong>of</strong> Agriculture <strong>of</strong> Ch<strong>in</strong>a (2001).7