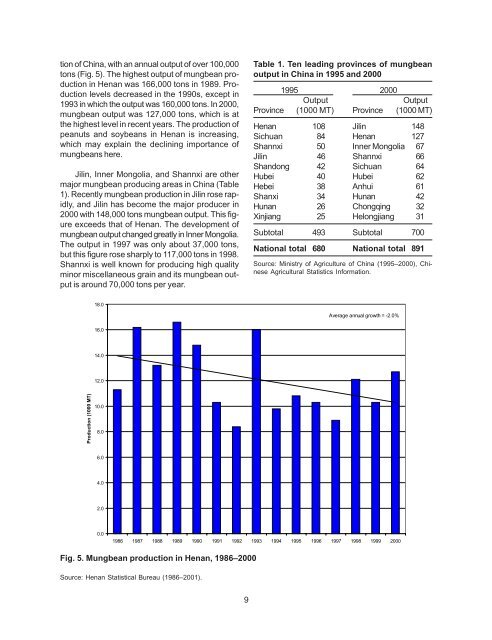
tion <strong>of</strong> Ch<strong>in</strong>a, with an annual output <strong>of</strong> over 100,000tons (Fig. 5). <strong>The</strong> highest output <strong>of</strong> mungbean production<strong>in</strong> Henan was 166,000 tons <strong>in</strong> 1989. Productionlevels decreased <strong>in</strong> the 1990s, except <strong>in</strong>1993 <strong>in</strong> which the output was 160,000 tons. In 2000,mungbean output was 127,000 tons, which is atthe highest level <strong>in</strong> recent years. <strong>The</strong> production <strong>of</strong>peanuts and soybeans <strong>in</strong> Henan is <strong>in</strong>creas<strong>in</strong>g,which may expla<strong>in</strong> the decl<strong>in</strong><strong>in</strong>g importance <strong>of</strong>mungbeans here.Jil<strong>in</strong>, Inner Mongolia, and Shannxi are othermajor mungbean produc<strong>in</strong>g areas <strong>in</strong> Ch<strong>in</strong>a (Table1). Recently mungbean production <strong>in</strong> Jil<strong>in</strong> rose rapidly,and Jil<strong>in</strong> has become the major producer <strong>in</strong>2000 with 148,000 tons mungbean output. This figureexceeds that <strong>of</strong> Henan. <strong>The</strong> development <strong>of</strong>mungbean output changed greatly <strong>in</strong> Inner Mongolia.<strong>The</strong> output <strong>in</strong> 1997 was only about 37,000 tons,but this figure rose sharply to 117,000 tons <strong>in</strong> 1998.Shannxi is well known for produc<strong>in</strong>g high qualitym<strong>in</strong>or miscellaneous gra<strong>in</strong> and its mungbean outputis around 70,000 tons per year.Table 1. Ten lead<strong>in</strong>g prov<strong>in</strong>ces <strong>of</strong> mungbeanoutput <strong>in</strong> Ch<strong>in</strong>a <strong>in</strong> 1995 and 20001995 2000OutputOutputProv<strong>in</strong>ce (1000 MT) Prov<strong>in</strong>ce (1000 MT)Henan 108 Jil<strong>in</strong> 148Sichuan 84 Henan 127Shannxi 50 Inner Mongolia 67Jil<strong>in</strong> 46 Shannxi 66Shandong 42 Sichuan 64Hubei 40 Hubei 62Hebei 38 Anhui 61Shanxi 34 Hunan 42Hunan 26 Chongq<strong>in</strong>g 32X<strong>in</strong>jiang 25 Helongjiang 31Subtotal 493 Subtotal 700National total 680 National total 891Source: M<strong>in</strong>istry <strong>of</strong> Agriculture <strong>of</strong> Ch<strong>in</strong>a (1995–2000), Ch<strong>in</strong>eseAgricultural Statistics Information.18.0Average annual growth = -2.0%16.014.012.0Production (1000 MT)10.08.06.04.02.00.01986 1987 1988 1989 1990 1991 1992 1993 1994 1995 1996 1997 1998 1999 2000Fig. 5. <strong>Mungbean</strong> production <strong>in</strong> Henan, 1986–2000Source: Henan Statistical Bureau (1986–2001).9
5 <strong>Mungbean</strong> consumption <strong>in</strong> Ch<strong>in</strong>a<strong>Mungbean</strong> has been consumed <strong>in</strong> Ch<strong>in</strong>a forcenturies. It is consumed as a seed, sprout, or <strong>in</strong>processed forms that <strong>in</strong>clude jellies, noodles,cakes, and brews. <strong>Mungbean</strong> is also used <strong>in</strong> traditionalmedic<strong>in</strong>es.Income growth and urbanization are likely toboost food demand considerably and change themix <strong>of</strong> foods consumed <strong>in</strong> Ch<strong>in</strong>a. As <strong>in</strong>comes grow,demand for meat, fish, vegetable oils, and dairyproducts will grow particularly fast. <strong>The</strong> country’stransition from rural semi-subsistence to urbanlifestyles will also have pr<strong>of</strong>ound impacts on consumptionpatterns, shift<strong>in</strong>g demand from self-grownrice, wheat, and vegetables to fish, meat, processedfoods, and restaurant meals. Consumers will alsopay more attention to food quality and they maydemand foods with specific attributes.5.1 Nutritional value <strong>of</strong> mungbean<strong>Mungbean</strong> is a highly nutritious pulse due toits rich prote<strong>in</strong> content and excellent digestibility.Table 2 gives an overview on some <strong>of</strong> the importantnutrients that mungbean conta<strong>in</strong>s <strong>in</strong> its variousforms <strong>of</strong> consumption. Note the high lys<strong>in</strong>e content,which makes mungbean a good complementaryfood for rice-based diets, <strong>in</strong> which lys<strong>in</strong>e isusually the first limit<strong>in</strong>g am<strong>in</strong>o acid (Chen et al.1987).<strong>Research</strong> at AVRDC has shown that the iron<strong>in</strong> mungbeans can be made more biologically avail-able if mungbean is cooked together with certa<strong>in</strong>vegetables, such as tomato, mustard greens, andcabbage (AVRDC 1997, 1998, 1999). It has beendemonstrated that consumption <strong>of</strong> mungbeans <strong>in</strong>this form can substantially <strong>in</strong>crease body iron stores<strong>of</strong> anemic schoolchildren (We<strong>in</strong>berger 2002).<strong>Mungbean</strong> seed and mungbean soup is a richsource <strong>of</strong> alkaloids, coumar<strong>in</strong>, and phytoster<strong>in</strong> thatplay an important role <strong>in</strong> promot<strong>in</strong>g the physiologicalmetabolism <strong>of</strong> human be<strong>in</strong>gs and animals.In traditional Ch<strong>in</strong>ese medic<strong>in</strong>e, parts <strong>of</strong> themungbean plant are used for treat<strong>in</strong>g various ailments,<strong>in</strong>clud<strong>in</strong>g hepatitis, gastritis, uraemia, toxicosis,red dysentery, cholera, corneal opacity andmacula (Zheng et al. 2002).5.2 <strong>Mungbean</strong> consumption trends<strong>Mungbean</strong> consumption has been relativelysteady compared to total pulse consumption <strong>in</strong>Ch<strong>in</strong>a. <strong>Mungbean</strong> consumption has <strong>in</strong>creased at arate <strong>of</strong> 0.7% per year from 1986–2000 while pulseconsumption overall has decl<strong>in</strong>ed at an averageannual rate <strong>of</strong> 5.8% (Fig. 6).<strong>The</strong> reason is not that production has decl<strong>in</strong>edso much; rather, pulses are <strong>in</strong>creas<strong>in</strong>gly be<strong>in</strong>g putto different uses. In 1986, 956,000 MT <strong>of</strong> the totalpulses produced were be<strong>in</strong>g used as animal feed;<strong>in</strong> 2000 this figure had grown to 2,132,000 MT (annualgrowth rate <strong>of</strong> 6.4%) (FAOSTAT, 2001). In con-Table 2. Nutrient content <strong>of</strong> mungbean <strong>in</strong> various formsNutrient Raw Mashed/ flour Noodles Sprouts DryKilocalories 306.0 361.5 381.0 61.0 116.0Prote<strong>in</strong> (g) 20.3 24.5 0.3 6.6 7.7Vitam<strong>in</strong> A (RE) 5.0 6.0 0.0 1.0 2.0Vitam<strong>in</strong> C (mg) 0.0 0.0 0.0 8.0 0.0Iron (mg) 6.6 6.4 0.5 1.1 2.5Z<strong>in</strong>c (mg) 3.4 3.7 0.1 0.6 1.3Folate (µg) 549.0 499.5 0.0 86.0 208.0Am<strong>in</strong>o acids (g) 10.2 12.0 0.1 3.1 3.9Lys<strong>in</strong>e (g) 1.6 1.9 0.0 0.5 0.6Source: Calloway et al. 199410