RESULTS OF OPERATIONSWe operate in three business segments: Broadband, Transport and Services. For the fourth quarter of <strong>2010</strong>, revenue grew to $410.5million, up 5.4% from $389.3 million in the fourth quarter of 2009. For the year <strong>2010</strong>, revenue grew to $1,642.3 million, up 7.6%from $1,525.7 million in 2009. In the three-month period, increased revenue in the Broadband segment offset lower revenue in theTransport and Services segments. For the year <strong>2010</strong>, revenue increased in all three segments.Consolidated gross profit margin in the fourth quarter of <strong>2010</strong> was 38.0%, compared with 45.3% in the year-ago quarter. Grossmargin included a charge of $16.5 million for excess purchase commitments. Excluding this charge, consolidated gross margin for thefourth quarter of <strong>2010</strong> was 42.0%. For the year <strong>2010</strong>, consolidated gross margin grew to 48.1%, up 4.5 percentage points from 43.6%in 2009. Products and services gross margins decreased in the three-month period. For the year <strong>2010</strong>, products gross marginsimproved and services margins declined.Operating expenses in the fourth quarter of <strong>2010</strong> were $162.5 million, compared with $141.1 million in the year-ago quarter. For theyear <strong>2010</strong>, operating expenses were $615.9 million, compared with $572.3 million in 2009.Operating loss in the fourth quarter of <strong>2010</strong> was $6.7 million, compared with operating earnings of $35.1 million in the year-agoquarter. For the year <strong>2010</strong>, operating earnings grew to $173.7 million, up $80.2 million from $93.5 million in 2009.Net loss for the fourth quarter of <strong>2010</strong> was $10.9 million or $0.03 per share (basic and diluted), compared with net earnings of $62.1million or $0.16 per share (basic and diluted) in the year-ago quarter. Net earnings for the year <strong>2010</strong> grew to $155.6 million or $0.41per share (basic and diluted), up 37.0% from $113.6 million or $0.29 per share (basic and diluted) in 2009.Revenue (in millions)Fourth <strong>Quarter</strong>Year<strong>2010</strong> 2009 Change <strong>2010</strong> 2009 ChangeProducts $350.3 $324.6 7.9% $1,400.0 $1,295.4 8.1%Services 60.2 64.7 (7.0)% 242.3 230.3 5.2%Total revenue $410.5 $389.3 5.4% $1,642.3 $1,525.7 7.6%Products revenue grew year-over-year in both the three-month period and the year <strong>2010</strong>. Services revenue decreased in the threemonthperiod and increased in the year <strong>2010</strong>.In the fourth quarter of <strong>2010</strong>, we early adopted two new required accounting standards related to revenue recognition: AccountingStandards Update (ASU) 2009-13, Multiple-Deliverable Revenue Arrangements, and ASU 2009-14, Certain Revenue ArrangementsThat Include Software Elements. These new standards generally result in earlier revenue recognition than under previous standards forcertain deliverables in multiple-element arrangements. We adopted these standards effective as of the beginning of <strong>2010</strong>; therefore,the previously reported quarterly results have been revised to reflect the impact of the adoption. Revenue and net earnings in the fourthquarter of <strong>2010</strong> increased by $8.8 million and $0.5 million, respectively. For the year <strong>2010</strong>, revenue and net earnings increased by$9.1 million and $0.5 million, respectively. We adopted these standards in the fourth quarter of <strong>2010</strong> because we were entering intoseveral multi-year agreements. We believe the new rules best reflect the economics of those agreements over time.In the fourth quarter of <strong>2010</strong>, we agreed with a North American customer to add a data product to other <strong>Tellabs</strong> products already soldto that customer through a distributor. This helps the customer better manage inventory and deployment schedules. As a result, werecognized $20.8 million in revenue in the fourth quarter of <strong>2010</strong> that otherwise would have been recognized in the first quarter of2011.On a geographic basis, revenue from customers in North America (United States and Canada) was $240.5 million (or 59% of totalrevenue) in the fourth quarter of <strong>2010</strong>, compared with $255.4 million (or 66% of total revenue) in the year-ago quarter. For the year<strong>2010</strong>, North American revenue grew to $1,142.6 million (or 70% of total revenue), up 13.7% from $1,005.3 million (or 66% of totalrevenue) in 2009. The decrease in revenue for the three-month period was driven primarily by lower revenue for data and digitalcross-connect systems from a major North American carrier. The increase in revenue for the year <strong>2010</strong> was driven primarily by higherrevenue for data and digital cross-connect systems from the same customer.Revenue from customers outside North America grew to $170.0 million (or 41% of total revenue) in the fourth quarter of <strong>2010</strong>, up27.0% from $133.9 million (or 34% of total revenue) in the year-ago quarter. For the year <strong>2010</strong>, revenue from customers outsideNorth America was $499.7 million (or 30% of total revenue), compared with $520.4 million (or 34% of total revenue) in 2009. Theincrease in revenue for the three-month period was driven primarily by higher revenue from data products in the Europe, Middle Eastand Africa region. The decline in revenue for the year <strong>2010</strong> was driven primarily by lower revenue from data products in the AsiaPacific region.
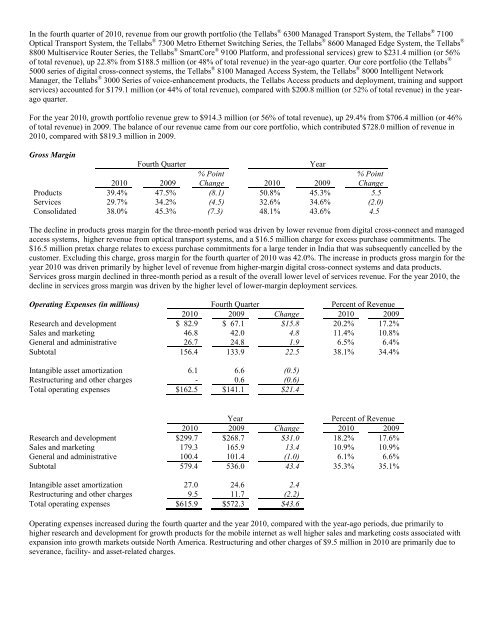
In the fourth quarter of <strong>2010</strong>, revenue from our growth portfolio (the <strong>Tellabs</strong> ® 6300 Managed Transport System, the <strong>Tellabs</strong> ® 7100Optical Transport System, the <strong>Tellabs</strong> ® 7300 Metro Ethernet Switching Series, the <strong>Tellabs</strong> ® 8600 Managed Edge System, the <strong>Tellabs</strong> ®8800 Multiservice Router Series, the <strong>Tellabs</strong> ® SmartCore ® 9100 Platform, and professional services) grew to $231.4 million (or 56%of total revenue), up 22.8% from $188.5 million (or 48% of total revenue) in the year-ago quarter. Our core portfolio (the <strong>Tellabs</strong> ®5000 series of digital cross-connect systems, the <strong>Tellabs</strong> ® 8100 Managed Access System, the <strong>Tellabs</strong> ® 8000 Intelligent NetworkManager, the <strong>Tellabs</strong> ® 3000 Series of voice-enhancement products, the <strong>Tellabs</strong> Access products and deployment, training and supportservices) accounted for $179.1 million (or 44% of total revenue), compared with $200.8 million (or 52% of total revenue) in the yearagoquarter.For the year <strong>2010</strong>, growth portfolio revenue grew to $914.3 million (or 56% of total revenue), up 29.4% from $706.4 million (or 46%of total revenue) in 2009. The balance of our revenue came from our core portfolio, which contributed $728.0 million of revenue in<strong>2010</strong>, compared with $819.3 million in 2009.Gross MarginFourth <strong>Quarter</strong>Year<strong>2010</strong> 2009% PointChange <strong>2010</strong> 2009% PointChangeProducts 39.4% 47.5% (8.1) 50.8% 45.3% 5.5Services 29.7% 34.2% (4.5) 32.6% 34.6% (2.0)Consolidated 38.0% 45.3% (7.3) 48.1% 43.6% 4.5The decline in products gross margin for the three-month period was driven by lower revenue from digital cross-connect and managedaccess systems, higher revenue from optical transport systems, and a $16.5 million charge for excess purchase commitments. The$16.5 million pretax charge relates to excess purchase commitments for a large tender in India that was subsequently cancelled by thecustomer. Excluding this charge, gross margin for the fourth quarter of <strong>2010</strong> was 42.0%. The increase in products gross margin for theyear <strong>2010</strong> was driven primarily by higher level of revenue from higher-margin digital cross-connect systems and data products.Services gross margin declined in three-month period as a result of the overall lower level of services revenue. For the year <strong>2010</strong>, thedecline in services gross margin was driven by the higher level of lower-margin deployment services.Operating Expenses (in millions) Fourth <strong>Quarter</strong> Percent of Revenue<strong>2010</strong> 2009 Change <strong>2010</strong> 2009Research and development $ 82.9 $ 67.1 $15.8 20.2% 17.2%Sales and marketing 46.8 42.0 4.8 11.4% 10.8%General and administrative 26.7 24.8 1.9 6.5% 6.4%Subtotal 156.4 133.9 22.5 38.1% 34.4%Intangible asset amortization 6.1 6.6 (0.5)Restructuring and other charges - 0.6 (0.6)Total operating expenses $162.5 $141.1 $21.4YearPercent of Revenue<strong>2010</strong> 2009 Change <strong>2010</strong> 2009Research and development $299.7 $268.7 $31.0 18.2% 17.6%Sales and marketing 179.3 165.9 13.4 10.9% 10.9%General and administrative 100.4 101.4 (1.0) 6.1% 6.6%Subtotal 579.4 536.0 43.4 35.3% 35.1%Intangible asset amortization 27.0 24.6 2.4Restructuring and other charges 9.5 11.7 (2.2)Total operating expenses $615.9 $572.3 $43.6Operating expenses increased during the fourth quarter and the year <strong>2010</strong>, compared with the year-ago periods, due primarily tohigher research and development for growth products for the mobile internet as well higher sales and marketing costs associated withexpansion into growth markets outside North America. Restructuring and other charges of $9.5 million in <strong>2010</strong> are primarily due toseverance, facility- and asset-related charges.


