Tellabs Financial Performance: 4th Quarter Earnings 2010
Tellabs Financial Performance: 4th Quarter Earnings 2010
Tellabs Financial Performance: 4th Quarter Earnings 2010
You also want an ePaper? Increase the reach of your titles
YUMPU automatically turns print PDFs into web optimized ePapers that Google loves.
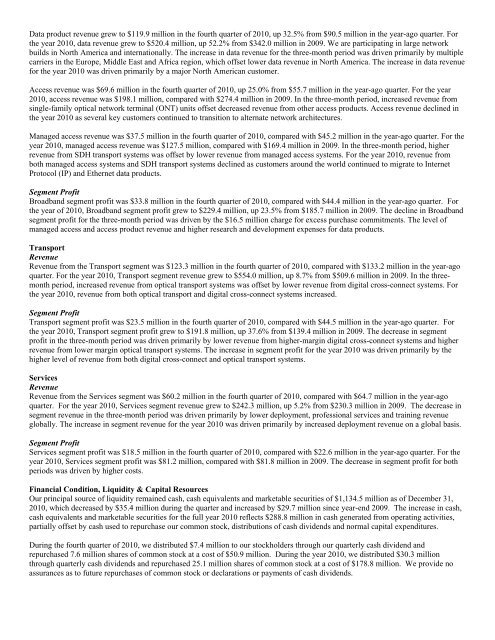
Data product revenue grew to $119.9 million in the fourth quarter of <strong>2010</strong>, up 32.5% from $90.5 million in the year-ago quarter. Forthe year <strong>2010</strong>, data revenue grew to $520.4 million, up 52.2% from $342.0 million in 2009. We are participating in large networkbuilds in North America and internationally. The increase in data revenue for the three-month period was driven primarily by multiplecarriers in the Europe, Middle East and Africa region, which offset lower data revenue in North America. The increase in data revenuefor the year <strong>2010</strong> was driven primarily by a major North American customer.Access revenue was $69.6 million in the fourth quarter of <strong>2010</strong>, up 25.0% from $55.7 million in the year-ago quarter. For the year<strong>2010</strong>, access revenue was $198.1 million, compared with $274.4 million in 2009. In the three-month period, increased revenue fromsingle-family optical network terminal (ONT) units offset decreased revenue from other access products. Access revenue declined inthe year <strong>2010</strong> as several key customers continued to transition to alternate network architectures.Managed access revenue was $37.5 million in the fourth quarter of <strong>2010</strong>, compared with $45.2 million in the year-ago quarter. For theyear <strong>2010</strong>, managed access revenue was $127.5 million, compared with $169.4 million in 2009. In the three-month period, higherrevenue from SDH transport systems was offset by lower revenue from managed access systems. For the year <strong>2010</strong>, revenue fromboth managed access systems and SDH transport systems declined as customers around the world continued to migrate to InternetProtocol (IP) and Ethernet data products.Segment ProfitBroadband segment profit was $33.8 million in the fourth quarter of <strong>2010</strong>, compared with $44.4 million in the year-ago quarter. Forthe year of <strong>2010</strong>, Broadband segment profit grew to $229.4 million, up 23.5% from $185.7 million in 2009. The decline in Broadbandsegment profit for the three-month period was driven by the $16.5 million charge for excess purchase commitments. The level ofmanaged access and access product revenue and higher research and development expenses for data products.TransportRevenueRevenue from the Transport segment was $123.3 million in the fourth quarter of <strong>2010</strong>, compared with $133.2 million in the year-agoquarter. For the year <strong>2010</strong>, Transport segment revenue grew to $554.0 million, up 8.7% from $509.6 million in 2009. In the threemonthperiod, increased revenue from optical transport systems was offset by lower revenue from digital cross-connect systems. Forthe year <strong>2010</strong>, revenue from both optical transport and digital cross-connect systems increased.Segment ProfitTransport segment profit was $23.5 million in the fourth quarter of <strong>2010</strong>, compared with $44.5 million in the year-ago quarter. Forthe year <strong>2010</strong>, Transport segment profit grew to $191.8 million, up 37.6% from $139.4 million in 2009. The decrease in segmentprofit in the three-month period was driven primarily by lower revenue from higher-margin digital cross-connect systems and higherrevenue from lower margin optical transport systems. The increase in segment profit for the year <strong>2010</strong> was driven primarily by thehigher level of revenue from both digital cross-connect and optical transport systems.ServicesRevenueRevenue from the Services segment was $60.2 million in the fourth quarter of <strong>2010</strong>, compared with $64.7 million in the year-agoquarter. For the year <strong>2010</strong>, Services segment revenue grew to $242.3 million, up 5.2% from $230.3 million in 2009. The decrease insegment revenue in the three-month period was driven primarily by lower deployment, professional services and training revenueglobally. The increase in segment revenue for the year <strong>2010</strong> was driven primarily by increased deployment revenue on a global basis.Segment ProfitServices segment profit was $18.5 million in the fourth quarter of <strong>2010</strong>, compared with $22.6 million in the year-ago quarter. For theyear <strong>2010</strong>, Services segment profit was $81.2 million, compared with $81.8 million in 2009. The decrease in segment profit for bothperiods was driven by higher costs.<strong>Financial</strong> Condition, Liquidity & Capital ResourcesOur principal source of liquidity remained cash, cash equivalents and marketable securities of $1,134.5 million as of December 31,<strong>2010</strong>, which decreased by $35.4 million during the quarter and increased by $29.7 million since year-end 2009. The increase in cash,cash equivalents and marketable securities for the full year <strong>2010</strong> reflects $288.8 million in cash generated from operating activities,partially offset by cash used to repurchase our common stock, distributions of cash dividends and normal capital expenditures.During the fourth quarter of <strong>2010</strong>, we distributed $7.4 million to our stockholders through our quarterly cash dividend andrepurchased 7.6 million shares of common stock at a cost of $50.9 million. During the year <strong>2010</strong>, we distributed $30.3 millionthrough quarterly cash dividends and repurchased 25.1 million shares of common stock at a cost of $178.8 million. We provide noassurances as to future repurchases of common stock or declarations or payments of cash dividends.


