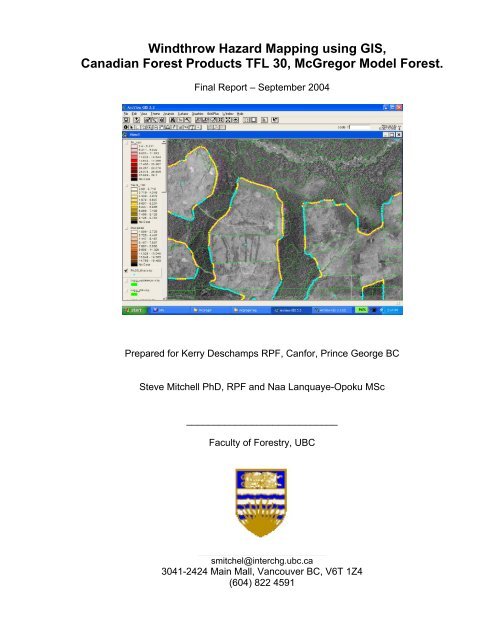
Windthrow Hazard Mapping using GIS, Canadian Forest Products ...
Windthrow Hazard Mapping using GIS, Canadian Forest Products ...
Windthrow Hazard Mapping using GIS, Canadian Forest Products ...

You also want an ePaper? Increase the reach of your titles
YUMPU automatically turns print PDFs into web optimized ePapers that Google loves.
models have been successfully developed for very uniform stands in Europe andeastern Canada. We are in the process of validating the UK model <strong>Forest</strong>GALES foruniform stands of BC species including lodgepole pine and interior spruce.The empirical approach used in this study is more suitable where stands are complexand varied in structure and composition, and where geography and soils areheterogeneous. In the empirical approach, regression models are built which relatepresence or magnitude of wind damage in sampling units to the environmental andmanagement attributes of these units. For the construction of empirical models,information about large numbers of sample units is necessary. Aerial photographinterpretation and geographic information systems (<strong>GIS</strong>) provide the opportunity toassemble stand or landscape level information for large areas, generate spatialvariables, analyze, and map the results.Summary of MethodsBuilding DatasetsThe procedures used to assemble data and build models are summarized in Table 1.The sampling units were 25m long by 25m deep segments of cutblock boundaries.The sampling frame was all boundaries of cutblocks harvested between 1987 and1997 on six 1:20,000 mapsheets selected to represent the range of conditions in TFL30.Table 1. Summary of procedures used to build the windthrow risk model.StepProcedure1 Information Assembly• Obtained <strong>GIS</strong> layers for ecosystem, stand, logging history, roads andhydrology data.• Obtained 1:20,000 black and white summer 1998 aerial photographs.• Obtained TRIM point elevation data.• Obtained BC Hydro wind resource data (1km scale).• Obtained 1:5,000 paper maps of edge windfirming treatments.• Obtained extreme wind simulations for TFL 30 produced by Brendan Murphyand Peter Jackson of UNBC for McGregor Model <strong>Forest</strong> Association.2 Data Translation to ArcView format• Coverages received in ArcInfo interchange (*.e00) format were converted toArcView shape files <strong>using</strong> ArcView import wizard.3 <strong>Windthrow</strong> detection and mapping• Identified potential edge windthrow on aerial photo stereopairs.• Digitized windthrow on-screen <strong>using</strong> ortho-image made up from thesephotographs as a base.• Estimated percent canopy loss within each windthrow polygon.• Corrected forest cover and logging history polygons to match openingboundaries on orthophotos.4 Creation of sample units• Created buffer of 25m along the cutblock boundaries from logging history3
coverage.• Divided each buffer into 25m long*25m deep segments.• Used custom Avenue Scripts and calculated edge exposure scores <strong>using</strong>UTM coordinates of segments.5 Determination of topographic variables• Produced Digital Elevation Model (DEM) <strong>using</strong> interpolation between TRIMelevation points.• Determined topographic variables aspect, elevation, slope from DEM.• Calculated TOPEX-to-distance scores and ground curvature.6 Construction of segment database• Overlaid coverages with edge segments and extracted segment database.• Deleted points crossing harvested areas.7 • Initial data analysis• Imported database into SAS.• Deleted segments in non-forest types.• Calculated % of segment damaged and created set of response variablesbased on % of segment area damaged, and % of canopy loss.• Built and graphed contingency tables for damage outcome (low severitydamage threshold, WTT310, see below) versus independent variables• Correlation between independent variables• Spatial correlation with semivariance statistic8 Model fitting and testing• Creation of model fitting and model testing data sets independent of eachother in terms of spatial correlation. Created 125m*125m panels and retainedonly 1 segment per panel to reduce spatial correlation.• Randomly assigned these segments to 3 datasets.• Fit logistic regression models <strong>using</strong> dataset one. Stepwise regression.• Tested predictions <strong>using</strong> other 2 datasets.• Used variables from best performing models to refit overall model <strong>using</strong>complete dataset.• Repeated fitting process for 25m buffer with 3 different response variables: >30% of segment area damaged and >10% crown loss (WTT310, low severitythreshold), > 50% of segment area damaged and >50% crown loss (WTT550,moderate severity threshold) > 90% of segment area damaged and >50%crown loss (WTT950, high severity threshold)A magnifying stereoscope was used to detect and map windthrow on aerialphotographs. <strong>Windthrow</strong> was digitized directly on the computer screen <strong>using</strong> the digitalorthophotograph as a base. Canopy loss was estimated and assigned to eachpolygon.The BC wind resource data obtained from BC Hydro provided mean wind speeds forthe study area and their frequencies for sixteen cardinal directions. This was useful inproviding the variables mean wind speed and “cattack” for the modelling (cattack is4
angle between peak wind direction and bearing of segment cutblock). BrendanMurphy and Peter Jackson of UNBC provided their 2km grid simulations for TFL 30,for peak winds during moderate, severe and strong wind events as recorded at thePrince George Airport.Coverages were overlaid by the use of ArcView geoprocessing wizard’s “assign databy location” option. Each point represents a 25*25m segment. After boundariescrossing recent clearcuts were deleted, the remaining points were exported andanalyzed <strong>using</strong> SAS statistical software (Table 1a).Table 1a. Number of segments, n, used for statistical analysisProcessNumber of segmentsOverlay of all coverages in ArcView 27,205After deleting segments with age < 20 and cc < 5 (Dataset ‘E’) 22,077After panelling into 125m*125m panels, taking the first segmentfrom each panel and randomly assigning 1/3 of these segments to3 datasets:Dataset ‘1’ 1609Dataset ‘2’ 1606Dataset ‘3’ 1508Contingency tables were built <strong>using</strong> Dataset ‘E’ and a low threshold windthrow eventclassification (WTT3010) against selected independent class variables.Correlations between numeric variables were determined <strong>using</strong> the Pearson simplecorrelation coefficients to identify highly correlated variables. Where two variableswere highly correlated, only one was included in model fitting.Spatial correlation:Neighbouring sample units tend to have similar properties. This is even morepronounced where values for sample units are obtained from polygon or gridded data,in which case all sample points within a given polygon or grid cell will have identicalvalues for the associated variable. Environmental and spatial effects will therefore berelated. This condition may cause a model fitted with such a data to exhibit spatialautocorrelation (Manly 1991). Controlling for the effect of geographical closeness isnecessary in these situations to avoid overfitting (Figure 1).5
Relative Semivariance10.90.80.70.60.50.40.30.20.101 2 3 4 5 6 7 8 9 10 11 12# of 25m segments apartwtcnstrmaxselv100heightmwspeedbrgcnFigure 1. A plot of relative semivariance (semivariance value for a given inter-segmentdistance divided by the semivariance value at 12 segments apart) for: WTCN,windthrow at segment centroid; STRMAXS, maximum wind speed during strong windevent; ELV100, elevation; HEIGHT, stand height; MWSPEED, BCHydro mean annualwind speed; BRGCN, direction from cutblock boundary to cutblock centroid.Spatial autocorrelation was determined <strong>using</strong> semivariance, which expresses thedegree of relationship between points on a surface (Carr 1995). Semivariance is halfthe variance of the differences between all possible points spaced a constant distanceapart. Values increase quickly with distance for damage, stand, and managementvariables that vary within small distances, and more slowly for variables that vary overlarger distances such as elevation and wind speed. To reduce the spatialautocorrelation among observations, the minimum neighbourhood over which samplepoints were selected to estimate a grid node was held at 125m (e.g. five 25m*25msegments. Hence in a 125m*125m panel only one segment was selected for analysisor testing.6
Determination of independent variablesCalculation of Topex2000:Topex is a measure of topographic exposure at a given location. There are two basicforms of topex, ‘classical topex’, and ‘topex-to-distance’. Classical topex is the sum ofthe angle to skyline in degrees for the 8 cardinal directions. The minimum value is 0,meaning that the lowest topex score is 0 and this would occur on a mountain top withhigh exposure. Higher topex scores indicate increasing topographic shelter.In topex-to-distance, classical topex is modified in the following ways in order tofacilitate map-based calculations:1. the maximum distance in each direction is limited - in Topex1000 to 1000m, inTopex2000 to 2000m, etc.;2. the greatest angle to ground within this distance is used;3. negative values are permitted.A low score still indicates higher exposure – a mountaintop would have a verynegative score.Derivation of management variablesBlocks contiguous to each other were dissolved together into single blocks prior toboundary segmenting to better represent the wind (fetch) effects within openings. Aset of variables describing segment edge orientation, segment position relative toopening centroid, number of directions of boundary exposure and fetch werecalculated <strong>using</strong> coordinates of segment centroids.Determination of dependent variablesBecause windthrow is a rare event and measures of damage such as ‘% of segmentarea loss’ and ‘% crown loss’ are non-normally distributed, normal regressionapproaches are not appropriate for windthrow prediction. Logistic regression allows usto predict discrete outcomes (e.g. segment is damaged or undamaged) and is moresuitable to the problem of rare events. In this study, logistic regression was used toestimate model coefficients and generate the probability of windthrow occurrence foreach segment unit. In order to address the issue of damage severity, a set ofdependent variables were created to represent the presence of damage for differentseverity thresholds. Table 3 explains how these dependent variables were obtained.7
Table 3. Summary of response variables and procedures used to create them.# Procedure Variable Remarks1 Segments were classified asbeing windthrown if thecentroid of a segment areafalls within a windthrowpolygon.WTCN The simplest way ofclassifying windthrow.2 These are segments withgreater than p% of segmentarea within windthrowpolygons, and greater than q%crown lossWTTpq:WTT3010WTT5050WTT9050This variable combinesarea of damage withseverity. Cutpoints chosenreflect the level ofwindthrow that is significantto management.Model fitting proceduresDatasets 1, 2 and 3 (approximately 1600 observations each) were each used to fit aseries of models for different dependent variables. The predictions of models fit withDataset 1 were tested against Datasets 2 and 3, and vice versa in order to test therobustness of the models with independent data. Then, to make best use of the dataavailable, the models were then re-fit <strong>using</strong> all 22,077 segments <strong>using</strong> variables thatwere included in the best performing models in the robustness test. A second set ofmodels was fit with the variable 'time since logging'. This variable was not available forall cutblocks, so is fit with a reduced dataset.Hosmer-Lemeshow Goodness of fit test (HL G of fit)Model fit and robustness was tested <strong>using</strong> the Hosmer-Lemeshow goodness of fit test(HL G of fit). The model is used to predict the probability of damage for each segmentin a test dataset. The test data segments are then sorted by the predicted probabilityof damage, and then divided into 10 equal sized groups. The segments with the lowestprobability values go into the first group (1), and so on, up to the last group (10) whichis made up of segments with highest predicted probability values. The actualproportion of segments with damage is then determined for each group. The actualproportion of segments in each group that were damaged is compared with theaverage predicted probability of damage for the group. A good model is expected toproduce a non-significant Chi-square value indicating that there is no significantdifference between the observed proportions and expected probabilities for bothdamaged and un-damaged cases (Tabachnick and Fidell, 2001). For ten groups asused in this study the critical chi-square value is 15.507. A test value below thisnumber indicates an excellent fit. This is a conservative test and a model with a nonsignificantchi-square result may still provide useful information on risk factors and the8
anking of risk groups. For practical purposes, wide separation in probability ofdamage between groups 1 and 10 is desirable.C-value or c-statisticIn normal regression, the coefficient of determination (R 2 ) represents the proportion ofvariation in the dependent variable (y) that is explained by the relationship with theindependent variables (x variables). In logistic regression, the c-statistic is comparableto but not quite like an R 2 value. It measures the discriminatory power of a logisticequation and may be interpreted as the probability of a correct classification of arandomly selected pair of cases from each outcome category. It varies from 0.5 (themodel's predictions are no better than chance) to 1.0 (the model always assigns higherprobabilities to correct cases than to incorrect cases). Thus c is the percent of allpossible pairs of cases in which the model assigns a higher probability to a correctcase than to an incorrect case (Tabachnick and Fidell, 2001).Summary of ResultsDamage to segmentsA total of 16% of all boundary segments had levels of damage detectable from aerialphotographs and 14% had greater than 30% area loss and 10% crown loss. However,only 3% of segments had 100% area loss and greater than 50% of canopy loss (Table4).Table 4. Percentage of cells for each combination of minimum percent crown loss(horizontal) and minimum percent of segment area loss (vertical) to windthrow.Area Crown LossLoss 0 20 30 40 50 60 70 80 90 100 Total10 0 0.16 0.14 0.10 0.06 0.04 0.02 0.01 0.00 0.00 17220 0 0.15 0.14 0.09 0.06 0.04 0.02 0.01 0.00 0.00 16530 0 0.14 0.13 0.09 0.06 0.04 0.02 0.01 0.00 0.00 15440 0 0.14 0.12 0.09 0.06 0.03 0.02 0.01 0.00 0.00 14750 0 0.13 0.12 0.08 0.05 0.03 0.02 0.01 0.00 0.00 16260 0 0.12 0.11 0.08 0.05 0.03 0.02 0.01 0.00 0.00 19570 0 0.11 0.11 0.07 0.05 0.03 0.02 0.01 0.00 0.00 19180 0 0.11 0.10 0.07 0.05 0.03 0.02 0.01 0.00 0.00 22390 0 0.10 0.09 0.06 0.04 0.03 0.01 0.01 0.00 0.00 485100 0 0.07 0.07 0.05 0.03 0.02 0.01 0.01 0.00 0.00 1632Total 18275 381 1131 789 610 394 227 208 59 3 220779
Exploration of independent variables: range and means of x-variablesThe means and other statistics of some important variables are shown in Table 5. It isimportant to note that the models generated with this dataset will work best forlocations whose attributes fall within these limits.Table 5. Table of variables with some vital statistics (n = 22,106).Variable Label Mean Std Dev Minimum MaximumAge (yrs) AGE 141 64 0 400Aspect ( o ) ASP100 175 98 0 360Elevation (m) ELV100 726 258 0 1201Height (m) HEIGHT 25 11 0 44Mean wind speed (m/s) MWSPEED 4 1 3 6Crown closure CC_TREE 34 18 0 80Slope ( o ) SLP100 10 10 0 95Topex100_1000m ( o ) TPX100_1k 22 20 -64 169Max wind moderate event (m/s) MODMAXS 8 2 3 12Max wind strong event (m/s) STRMAXS 12 2 7 21Volume conifers (m 3 ) VOLC 271 172 0 1087Correlation between selected variablesThe correlations between independent variables were generally weak. Elevation ispositively correlated with mean windspeed and with slope. The stand variables height,age and volume are correlated as expected. Mean wind speed is weakly correlatedwith topex. Peak winds are weakly inversely correlated with elevation (Table 6).Table 6. A table of correlation between selected independent variables (n=22,077).Variable 1 Variable 2 CorrelationcoefficientELEV SLOPE 0.43ELEV MWSPEED 0.84ELEV MODMAXS -0.31ELEV STRMAXS -0.36ELEV TOPEX3K 0.24TOPEX3K MWSPEED 0.42TOPEX3K MODMAXS -0.53TOPEX3K STRMAXS -0.02MWSPEED MODMAXS -0.38MWSPEED STRMAXS -0.18MODMAXS STRMAXS -0.02FUNNELNS STRMAXS 0.02FUNNELEW STRMAXS -0.10CBRGCN CBRGP 0.55SCORE DIREX 0.36HEIGHT AGE 0.89HEIGHT VOLC 0.8010
Contingency tablesTrends in the proportion of segments damaged relative to class values of independentvariables are shown in Figure 2. Damage frequency increased with increasing meanannual windspeed and with increasing peak wind speed during a strong wind event,with number of directions of boundary exposure, with stand height and basal area, andwith time since logging. Damage frequency declined with decreasing topographicexposure and ground slope. Damage frequency is highest for south facing segmentsand when the cutblock centroid is south or west of the segments. Segments located onslopes with east aspects were less frequently damaged than those on other aspects.Stands dominated by hardwoods, subalpine fir and redcedar were less frequentlydamaged than those dominated by Douglas-fir, hemlock, lodgepole pine and spruce.There are no strong relationships between damage frequency and elevation, oropening width. In the latter case, most of the openings are much larger than the 5 treelengths at which sheltering effects from the leading stand edge have been observed inother studies.a)b)%60504030201003.5 4.5 5.5 6.5120001000080006000400020000#%201510500 25 50 75 100125 15014000120001000080006000400020000#MeanWSTopex 2kmc)d)%2015105070006000500040003000200010000#%20151050150001000050000#650 750 850 950 105011505 15 25 35 45 55ElevationBasal Area11
e)f)%161284010 20 30 40 50 6020000150001000050000#%2520151050ACTATBLCWEPFDHWPLSBSX14000120001000080006000400020000#Slope %Speciesg)h)%2520151050N E S W80006000400020000#%2016128400 1 2 3 4 5 6 7120001000080006000400020000#BRGCDIREXi)j)20100003010000%151058000600040002000#%2520151058000600040002000#05 15 25 35 45007 9 11 13 15 17 19 210HeightStrong Wind Max Speed12
k)l)0.2060001612000Proportion0.150.100.0550004000300020001000#%1284100008000600040002000#0.00000N E S WN E S WBRGCNAspectm)n)2020000204000%16128415000100005000#%15105300020001000#0250 750 125017503000001 4 7 100ScoreYearFigure 2. Proportion of damaged segments for selected independent variables (Dataset ‘E’, n=22,077);bar = proportion; -◊- number of segments), for a) mean annual wind speed (m/s); b) topographicexposure limited to 2km; c) elevation (m); d) basal area (m 2 /ha); e) slope (%); f) leading species; g)bearing at right angles to boundary inward towards block ( o ); h) number of directions that boundarysegment is exposed to wind for > 100m (max=8); i) stand height (m); j) strong wind event max windspeed (m/s); k) bearing to cutblock centroid; l) ground aspect; m) sum of distance across opening (m,max=5000); n) time since logging (year).13
ModelsModels fit with logistic regression predict the probability of an event (windthrow)occurring. Models were fit for each three independent test datasets for the dependentvariable WTT3010 (low severity threshold), and tested against the other test datasets.The variables that consistently appeared in these initial best-fit models were then usedto fit a model <strong>using</strong> the whole dataset. Independent variables in the best-fit modelsincluded topographic, ecosystem and stand variables (Table 7).Table 7. Variables and coefficients in the best fit logistic regression models.VariableWTT3010 modelfor Dataset 1WTT3010 modelfor Dataset 2WTT3010 modelfor Dataset 3WTT3010 modelfor Dataset EIntercept -7.9555 -7.7457 -6.8602 -7.5842slp100 -0.0236 -0.0248 -0.0340cbrgp 0.00837 0.00745 0.0125 0.00697height 0.0584 0.0317 0.0507age 0.00645mwspeed 0.1824strmaxs 0.2117 0.2413 0.1860 0.1918score -0.00021 -0.00012score180 -0.00037direx 0.4919 0.2676 0.2428 0.3249Model building n=1609 n=1606 n=1508 n=21457datac-value 0.72 0.70 0.70 0.70%-concordant 72% 70% 70% 70%HL G of fit critical 15.5 15.5 15.5 15.5HL G of fit5.4 9.8 13.6 28.0Fitting dataHLG of fit12.3 9.9 11.6 --Testing dataHLG of fitTesting data19.3 21.6 7.3 --*Note: these equations calculate the ‘logistic’ value, which is then converted to ‘probability’ <strong>using</strong> equations 2 and 3 in Tables A1-2to A1-3.Results for the test datasets for the model fit with dataset 1 are illustrated in Figure 3.The actual proportions of segments damaged are +/- 25% of the predicted value formost test groups. The overall model for WTT3010 accurately predicted the damagestatus (damaged/undamaged) for 70% of individual segments (Table 7). Thegoodness of fit test indicated a slightly high H-L goodness of fit test score, but thismodel still has practical utility as can be seen by the separation of risk groups in Figure3. For individual segments, all models were better at predicting the status ofundamaged segments than damaged segments.14
Observed0.450.40.350.30.250.20.150.10.050ModelTest 1Test 21:10 0.1 0.2 0.3 0.4ExpectedFigure 3. Percent predicted damage versus actual outcome for WTT3010 model forfitting data for dataset 1 (•),and test datasets 2 and 3 ( □, x ), and 1:1 line (-).The variables that occurred in the best fit model for WTT3010 with dataset E wereused in fitting models for more severe damage thresholds (WTT5050 and WTT9050).This allowed evaluation of any systematic changes in the coefficients of modelparameters as threshold percentage area damaged increased. The independentvariables were selected by the models for all three severity thresholds. Thecontributions of slope and number of directions of wind exposure increased withincreasing damage severity. The contributions of boundary orientation and cutblocksize remained the same, while the contribution of stand height and storm wind speeddeclined (Table 8). Interestingly, the coefficients for mean wind speed changed signfrom positive for low damage severity threshold models to negative for higher severitythreshold models, suggesting that severe damage is proportionally less frequent thanlow severity damage in locations with higher normal wind regimes. In the models withtime since logging included, the contribution of stand height and storm wind speeddeclined for high severity threshold models, mean wind speed drops out and thecontribution of directional exposure and time since logging increases.15
Table 8. Effect of increasing severity thresholds for classifying a segment as‘damaged’ on variable coefficients. Dataset ‘E’.Without time since logging (timelog) included:Parameter WTT3010 WTT5050 WTT9050n 21457 21457 21457Damaged segments 3157 723 574% Damaged 14.7 3.4 2.8Intercept -7.5842 -6.3140 -6.8061slp100 -0.0340 -0.0409 -0.0421cbrgp 0.00697 0.00738 0.00652height 0.0507 0.0274 0.0245mwspeed 0.1824 -0.1733 -0.2213strmaxs 0.1918 0.1007 0.1331score -0.00012 -0.00013 -0.00014direx 0.3249 0.4214 0.4807c-value 0.70 0.70 0.71With time since logging (timelog) included:Parameter WTT3010 WTT5050 WTT9050n 16618 16618 16618Damaged segments 2927 654 512% Damaged 17.6 3.9 3.1Intercept -6.9186 -6.3134 -7.5138slp100 -0.0264 -0.0350 -0.0350cbrgp 0.00778 0.00809 0.00714height 0.0494 0.0223 0.0183mwspeed 0.0944 0 0strmaxs 0.1374 0 0.0714score -0.00008 -0.00010 -0.00009direx 0.3350 0.4522 0.5106timelog 0.0462 0.0754 0.0742H-L GF 16.92 21.3 20.7c-value 0.69 0.71 0.71DiscussionKey findingsThe proportion of segments damaged (lowest severity threshold model) increased withincreasing mean annual windspeed, increasing storm wind speed, increasing standbasal area, increasing stand height, decreasing slope, and increasing number ofdirections of boundary exposure. Damage also increased up to 7 years followinglogging and then levelled.The species results were generally consistent with those for other locations.Deciduous, redcedar and subalpine fir leading stands were damaged less than otherstands of other species. The site index variable was missing for most polygons, so it16
was not possible to evaluate this effect directly. In other studies, vulnerability increaseswith site quality. The relatively high vulnerability of Douglas-fir leading stands wasunexpected, but this may reflect the quality of these sites. There was no clearassociation of damage with soil drainage, however damage as higher on sands andgravels than on finer textured substrates. The increase in damage with stand height isexpected and very consistent with other studies, as is the increase with basal area.Wind exposure variables are typically more important than stand or soil variables inpredicting risk.The greater vulnerability of south facing boundary segments isconsistent with BC Hydro’s wind resource data for the area, which shows a southerlycomponent to mean winds. This directionality is also consistent with results for otherBC studies. The dominant wind direction during the strong wind event was from thesoutheast. The number of directions to which a segment is exposed to windscontributed to all models. The negative coefficient for opening size (fetch), likelyreflects the fact that most openings are much larger than the 5 tree lengths at whichshelter from upwind stands takes effect. It is likely that the boundaries of the largestopenings follow natural forest type changes such as wetlands where the edges arenaturally windfirm.This study provided a unique opportunity to evaluate correlations between differentmeasures of wind regime, including topographic exposure (TOPEX), elevation, BCHydro numerically modelled mean wind and numerically modelled extreme winds. Asexpected elevation and mean wind speed were strongly correlated, however, elevationwas weakly inversely correlated with extreme winds. Topex was weakely positivelycorrelated with mean wind speed, but uncorrelated with extreme winds. The lack ofcorrelation between these variables indicates the difficulty in characterizing windregime. Topex is a key variable in our models in other BC locations, however it wasnot significant in any model for TFL 30, even when other topographic and windmeasures were excluded. This may reflect the relatively low complexity of topographyin TFL 30 and that the dominant terrain effect is the funnelling southeast winds.Fortunately, the extreme wind variable was available. Including mean wind improvedthe fit for the overall data set, but the fact that this variable took a negative coefficientfor high severity threshold models indicates the underlying complexity of standstability-wind regime interactions.The dependent variables used for map production were WTT3010 (low severitythreshold) and WTT9050 (high severity threshold). These variables capture bothsegment area damaged and canopy loss. The maps resulting from these models wereexamined. The pattern of higher edge windthrow probability areas produced with thismodel was logical in relation to the landscape features such as elevation, windinessand stand condition. Including time since logging did not change the overall pattern ofrisk, but provided a greater range of risk results.17
ApplicationsThese models predict the probability of damage to clearcut edges under givencombinations of environmental and management conditions. Because these maps usestand level information from broad scale inventories, they indicate conditions at thestand level not at the microsite or tree level. Furthermore, aerial photographinterpretation of wind damage does not detect low levels of damage which might beimportant in riparian areas or areas of unstable terrain. These maps are intended forstrategic planning during the development plan stage. <strong>Windthrow</strong> risk and potentialimpacts should be assessed in the field during cutblock layout. Since partiallyharvested stands were not represented in the model fitting dataset, predictions are notreliable in these stand types.ConclusionsAdequately fitting, local windthrow risk prediction models can be developed <strong>using</strong>stand, site, topographic, wind and management variables. Spatial autocorrelation, animportant issue to consider when analysing spatial data was also taken intoconsideration and was handled more rigorously in this study than in previous studies.The availability of extreme wind data substantially improved the model. In ourinvestigations of models from coastal and interior BC locations, we are findingconsistency in the variables selected and general portability of empirical models toareas with similar conditions. This reflects consistency in the underlying factors thatcontribute to windthrow risk. However windthrow prediction models work best forlandscape sub-units whose attributes fall within the area from which data wasgathered. The resulting hazard map for TFL 30 should be useful for strategicdevelopment planning.18
ReferencesAnderson, C. J., Coutts, M.P., Ritchie, R.M., Campbell, D. J., 1989. Root extractionforce measurement for Sitka spruce. <strong>Forest</strong>ry 62, 127-137.Besse, W. J. 2001. <strong>Windthrow</strong> monitoring of alternative silvicultural systems in themontane coastal forests. In Proceedings of the windthrow researchersworkshop, Jan 31- Feb. 1, Richmond, B.C.Carr, J. R. 1995. Numerical analysis for the geological sciences. Prentice Hall,Englewood Cliffs, New Jersey, USA.Cremer, K. W., C. J. Borough, F. H. McKinnel & P. R. Carter. 1982. Effects of stockingand thinning on wind damage in plantations. New Zealand J. For. Sci. 12:245 –268.Harris, A.S. 1989. Wind in the forests of southeast Alaska and guides for reducingdamage. U.S.D.A. <strong>Forest</strong> Service PNW-GTR-224. 63pp.Holmes, R. H. 1985. An analysis of windthrow along clearcut boundaries in theTsitika watershed. B.A. thesis, University of British Columbia, Vancouver, B.C.Manly, F. J., 2000. Multivariate statistical methods a primer. 2 nd edition. Chapman &Hall, New York.Mitchell, S. J., T. Hailemariam and Y. Kulis 2000. Empirical modelling of cutblock edgewindthrow risk on Vancouver Island, Canada, <strong>using</strong> stand level information.<strong>Forest</strong> Ecology and Management 5377: 1 - 14.Moore, M. K. 1977. Factors contributing to blowdown in streamside leave strips onVancouver Island. BC Min. For. Land. Manage. Rep. No.3. Victoria BC.Murphy, B. and P.L. Jackson 1997. Extreme value analysis: return periods of extremewind events in the central interior of British Columbia. Report prepared forMcGregor Model <strong>Forest</strong> Association. Prince George BC.Rollerson, T.P. 1979. Queen Charlotte Woodlands Division windthrow study. Nanaimo:MacMillan Bloedel Limited, Woodlands Services. 31pp.Rollerson, T.P. 2001. Riparian windthrow – North Vancouver Island. In Proceedings ofthe windthrow researchers workshop, Jan 31- Feb. 1, Richmond, B.C.Rowan, C., Michell, S. J., Hailemariam, T. 2001. Edge windfirming treatments incoastal British Columbia. In Proceedings of the windthrow researchersworkshop, Jan 31- Feb. 1, Richmond, B.C.Ruel, J.C. 1995. Understanding windthrow: silvicultural implications. For. Chron. 75,434-445.SAS Institute Inc., Logistic Regression Examples Using SAS System, Version 6, First19
Edition, Cary, NC: SAS Institute Inc., 1995. 163pp.Smith, V. G., M. watts & D. F. James. 1987. Mechanical stability of black spruce in theclay belt region of northern Ontario. Can. J. For. Res. 17: 1080 – 1091.Tabachnick, B. G. & Fidell L. S., 2001. Using multivariate statistics. 4 th edition. Allynand Bacon, Toronto.20
Appendix 1. Procedures used to build maps in ArcView <strong>GIS</strong>Table A1-1. Procedures used to build maps in ArcView.Step Procedure1 Obtain forest cover, wind resource data and TRIM data.2 Edit database.3 Select the area (mapsheet).4 Build DEM model based on TRIM point data for the whole study areaincluding the areas represented by the adjacent maps.5 Calculate Topex score for each grid cell for selected distance e.g. 3000m for8 cardinal directions.6 Create grid coverage (100*100m cells) for height [HT], Slope [SLP100] peakwind speed [STRMAXS] variables.7 Use Map Calculator to input the equations from Table 7.The outputs areprobability grid covers with different value range for each mapsheet. Tounify the value range and intervals, set the lower boundary to 0.00, the upperboundary to 0.72 and the number of classes to 6.The management variablesin the regression equations are held constant to represent cutblock boundarysegments which have full wind exposure within the opening (e.g. southfacing in large opening for several years).8 Risk estimates are unreliable for regenerating stands, so young stands aremasked by an overlay for mapping.9 Areas with no-data are shown in white.10 Alpine types are masked in grey.11 Mapped windthrow for sample mapsheets is shown in pink.21
Table A1-2. Map formulas used to calculate windthrow risk for WTT3010 modelwithout time since logging (timelog)MAPCALCULATION1( (180.AsGrid * 0.00697) - (7.5842.AsGrid) - ([Slp100] *0.034) + ([Ht] * 0.0507) + ([Mwspeed] * 0.1824) + ([Strmaxs]* 0.1918) - (5000.AsGrid * 0.00012) + (4.AsGrid * 0.3249))MAPCALCULATION (2.71828.AsGrid.Pow([Map Calculation 1]))2MAPCALCULATION ([Map Calculation 2] / ([Map Calculation 2]+1))3VARIABLES: a) [BRGP] held constant at 180b) [SCORE] held constant at 5000c) [DIREX] held constant at 4with time since logging (timelog)MAPCALCULATION1( (180.AsGrid * 0.00778) - (6.9186.AsGrid) - ([Slp100] *0.0264) + ([Ht] * 0.0494) + ([Mwspeed] * 0.0944) +([Strmaxs] * 0.1374) - (5000.AsGrid * 0.00008) + (4.AsGrid *0.3350) + (10.AsGrid * 0.0462))MAPCALCULATION (2.71828.AsGrid.Pow([Map Calculation 1]))2MAPCALCULATION ([Map Calculation 2] / ([Map Calculation 2]+1))3VARIABLES: d) [BRGP] held constant at 180e) [SCORE] held constant at 5000f) [DIREX] held constant at 4g) [TIMELOG] held constant at 1022
Table A1-3. Map formulas used to calculate windthrow risk for WTT9050 modelwithout time since loggingMAPCALCULATION1MAPCALCULATION2MAPCALCULATION( (180.AsGrid * 0.00652) - (6.8061.AsGrid) - ([Slp100] *0.0421) + ([Ht] * 0.0245) - ([Mwspeed] * 0.2213) +([Strmaxs] * 0.1331) - (5000.AsGrid * 0.00014) + (4.AsGrid *0.4807))(2.71828.AsGrid.Pow([Map Calculation 1]))([Map Calculation 2] / ([Map Calculation 2]+1))3VARIABLES: h) [BRGP] held constant at 180i) [SCORE] held constant at 5000j) [DIREX] held constant at 4with time since logging (timelog)MAPCALCULATION1MAPCALCULATION2MAPCALCULATION3( (180.AsGrid * 0.00714) - (7.5138.AsGrid) - ([Slp100] *0.0350) + ([Ht] * 0.0183) + (10.AsGrid * 0.0742) + ([Strmaxs]* 0.0714) - (5000.AsGrid * 0.00009) + (4.AsGrid * 0.5106))(2.71828.AsGrid.Pow([Map Calculation 1]))([Map Calculation 2] / ([Map Calculation 2]+1))VARIABLES: k) [BRGP] held constant at 180l) [SCORE] held constant at 5000m) [DIREX] held constant at 4n) [TIMELOG] held constant at 1023
Appendix 2. Sample Maps - Canfor TFL 30, McGregor*a pdf version of this map is attached on the accompanying cd.24
*a pdf version of this map is attached on the accompanying cd.25