Windthrow Hazard Mapping using GIS, Canadian Forest Products ...
Windthrow Hazard Mapping using GIS, Canadian Forest Products ...
Windthrow Hazard Mapping using GIS, Canadian Forest Products ...

You also want an ePaper? Increase the reach of your titles
YUMPU automatically turns print PDFs into web optimized ePapers that Google loves.
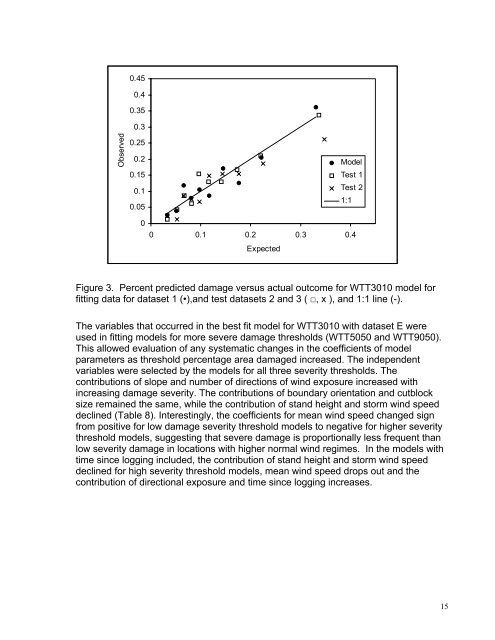
Observed0.450.40.350.30.250.20.150.10.050ModelTest 1Test 21:10 0.1 0.2 0.3 0.4ExpectedFigure 3. Percent predicted damage versus actual outcome for WTT3010 model forfitting data for dataset 1 (•),and test datasets 2 and 3 ( □, x ), and 1:1 line (-).The variables that occurred in the best fit model for WTT3010 with dataset E wereused in fitting models for more severe damage thresholds (WTT5050 and WTT9050).This allowed evaluation of any systematic changes in the coefficients of modelparameters as threshold percentage area damaged increased. The independentvariables were selected by the models for all three severity thresholds. Thecontributions of slope and number of directions of wind exposure increased withincreasing damage severity. The contributions of boundary orientation and cutblocksize remained the same, while the contribution of stand height and storm wind speeddeclined (Table 8). Interestingly, the coefficients for mean wind speed changed signfrom positive for low damage severity threshold models to negative for higher severitythreshold models, suggesting that severe damage is proportionally less frequent thanlow severity damage in locations with higher normal wind regimes. In the models withtime since logging included, the contribution of stand height and storm wind speeddeclined for high severity threshold models, mean wind speed drops out and thecontribution of directional exposure and time since logging increases.15