Windthrow Hazard Mapping using GIS, Canadian Forest Products ...
Windthrow Hazard Mapping using GIS, Canadian Forest Products ...
Windthrow Hazard Mapping using GIS, Canadian Forest Products ...

Create successful ePaper yourself
Turn your PDF publications into a flip-book with our unique Google optimized e-Paper software.
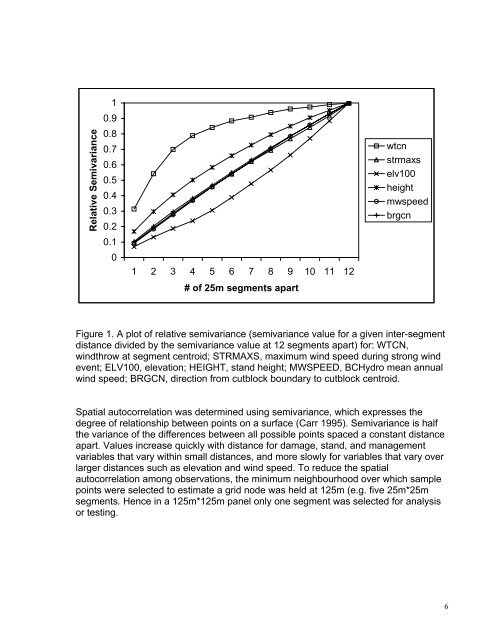
Relative Semivariance10.90.80.70.60.50.40.30.20.101 2 3 4 5 6 7 8 9 10 11 12# of 25m segments apartwtcnstrmaxselv100heightmwspeedbrgcnFigure 1. A plot of relative semivariance (semivariance value for a given inter-segmentdistance divided by the semivariance value at 12 segments apart) for: WTCN,windthrow at segment centroid; STRMAXS, maximum wind speed during strong windevent; ELV100, elevation; HEIGHT, stand height; MWSPEED, BCHydro mean annualwind speed; BRGCN, direction from cutblock boundary to cutblock centroid.Spatial autocorrelation was determined <strong>using</strong> semivariance, which expresses thedegree of relationship between points on a surface (Carr 1995). Semivariance is halfthe variance of the differences between all possible points spaced a constant distanceapart. Values increase quickly with distance for damage, stand, and managementvariables that vary within small distances, and more slowly for variables that vary overlarger distances such as elevation and wind speed. To reduce the spatialautocorrelation among observations, the minimum neighbourhood over which samplepoints were selected to estimate a grid node was held at 125m (e.g. five 25m*25msegments. Hence in a 125m*125m panel only one segment was selected for analysisor testing.6