Windthrow Hazard Mapping using GIS, Canadian Forest Products ...
Windthrow Hazard Mapping using GIS, Canadian Forest Products ...
Windthrow Hazard Mapping using GIS, Canadian Forest Products ...

You also want an ePaper? Increase the reach of your titles
YUMPU automatically turns print PDFs into web optimized ePapers that Google loves.
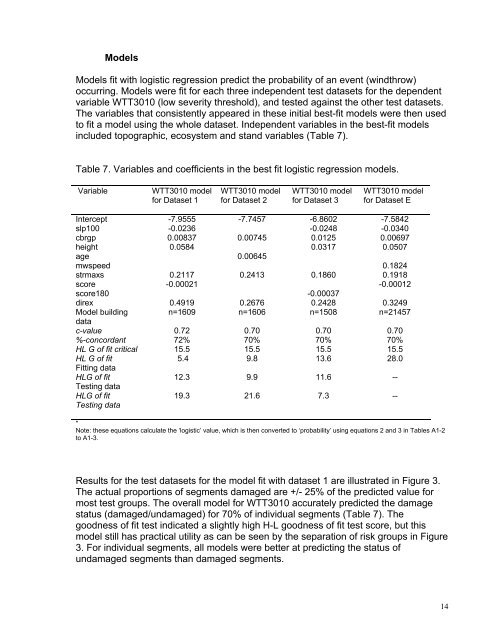
ModelsModels fit with logistic regression predict the probability of an event (windthrow)occurring. Models were fit for each three independent test datasets for the dependentvariable WTT3010 (low severity threshold), and tested against the other test datasets.The variables that consistently appeared in these initial best-fit models were then usedto fit a model <strong>using</strong> the whole dataset. Independent variables in the best-fit modelsincluded topographic, ecosystem and stand variables (Table 7).Table 7. Variables and coefficients in the best fit logistic regression models.VariableWTT3010 modelfor Dataset 1WTT3010 modelfor Dataset 2WTT3010 modelfor Dataset 3WTT3010 modelfor Dataset EIntercept -7.9555 -7.7457 -6.8602 -7.5842slp100 -0.0236 -0.0248 -0.0340cbrgp 0.00837 0.00745 0.0125 0.00697height 0.0584 0.0317 0.0507age 0.00645mwspeed 0.1824strmaxs 0.2117 0.2413 0.1860 0.1918score -0.00021 -0.00012score180 -0.00037direx 0.4919 0.2676 0.2428 0.3249Model building n=1609 n=1606 n=1508 n=21457datac-value 0.72 0.70 0.70 0.70%-concordant 72% 70% 70% 70%HL G of fit critical 15.5 15.5 15.5 15.5HL G of fit5.4 9.8 13.6 28.0Fitting dataHLG of fit12.3 9.9 11.6 --Testing dataHLG of fitTesting data19.3 21.6 7.3 --*Note: these equations calculate the ‘logistic’ value, which is then converted to ‘probability’ <strong>using</strong> equations 2 and 3 in Tables A1-2to A1-3.Results for the test datasets for the model fit with dataset 1 are illustrated in Figure 3.The actual proportions of segments damaged are +/- 25% of the predicted value formost test groups. The overall model for WTT3010 accurately predicted the damagestatus (damaged/undamaged) for 70% of individual segments (Table 7). Thegoodness of fit test indicated a slightly high H-L goodness of fit test score, but thismodel still has practical utility as can be seen by the separation of risk groups in Figure3. For individual segments, all models were better at predicting the status ofundamaged segments than damaged segments.14