Create successful ePaper yourself
Turn your PDF publications into a flip-book with our unique Google optimized e-Paper software.
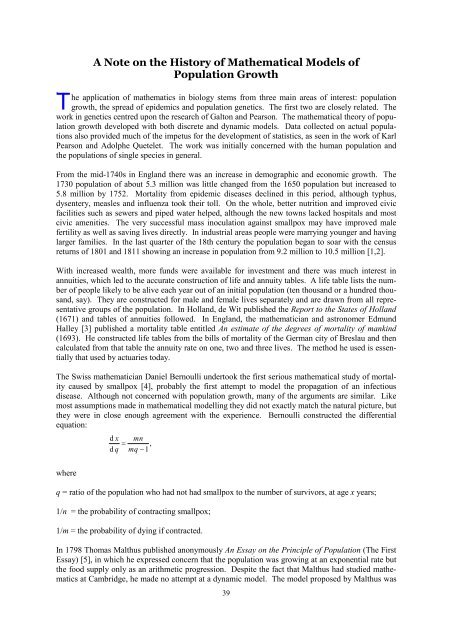
.TA Note on the History of Mathematical Models ofPopulation Growthhe application of mathematics in biology stems from three main areas of interest: populationgrowth, the spread of epidemics and population genetics. The first two are closely related. Thework in genetics centred upon the research of Galton and Pearson. The mathematical theory of populationgrowth developed with both discrete and dynamic models. Data collected on actual populationsalso provided much of the impetus for the development of statistics, as seen in the work of KarlPearson and Adolphe Quetelet. The work was initially concerned with the human population andthe populations of single species in general.From the mid-1740s in England there was an increase in demographic and economic growth. The1730 population of about 5.3 million was little changed from the 1650 population but increased to5.8 million by 1752. Mortality from epidemic diseases declined in this period, although typhus,dysentery, measles and influenza took their toll. On the whole, better nutrition and improved civicfacilities such as sewers and piped water helped, although the new towns lacked hospitals and mostcivic amenities. The very successful mass inoculation against smallpox may have improved malefertility as well as saving lives directly. In industrial areas people were marrying younger and havinglarger families. In the last quarter of the 18th century the population began to soar with the censusreturns of 1801 and 1811 showing an increase in population from 9.2 million to 10.5 million [1,2].With increased wealth, more funds were available for investment and there was much interest inannuities, which led to the accurate construction of life and annuity tables. A life table lists the numberof people likely to be alive each year out of an initial population (ten thousand or a hundred thousand,say). They are constructed for male and female lives separately and are drawn from all representativegroups of the population. In Holland, de Wit published the Report to the States of Holland(1671) and tables of annuities followed. In England, the mathematician and astronomer EdmundHalley [3] published a mortality table entitled An estimate of the degrees of mortality of mankind(1693). He constructed life tables from the bills of mortality of the German city of Breslau and thencalculated from that table the annuity rate on one, two and three lives. The method he used is essentiallythat used by actuaries today.The Swiss mathematician Daniel Bernoulli undertook the first serious mathematical study of mortalitycaused by smallpox [4], probably the first attempt to model the propagation of an infectiousdisease. Although not concerned with population growth, many of the arguments are similar. Likemost assumptions made in mathematical modelling they did not exactly match the natural picture, butthey were in close enough agreement with the experience. Bernoulli constructed the differentialequation:d x mn= ,dqmq−1whereq = ratio of the population who had not had smallpox to the number of survivors, at age x years;1/n = the probability of contracting smallpox;1/m = the probability of dying if contracted.In 1798 Thomas Malthus published anonymously An Essay on the Principle of Population (The FirstEssay) [5], in which he expressed concern that the population was growing at an exponential rate butthe food supply only as an arithmetic progression. Despite the fact that Malthus had studied mathematicsat Cambridge, he made no attempt at a dynamic model. The model proposed by Malthus was39


