Towards Anomaly Detection in SCADA Networks using Connection ...
Towards Anomaly Detection in SCADA Networks using Connection ...
Towards Anomaly Detection in SCADA Networks using Connection ...

Create successful ePaper yourself
Turn your PDF publications into a flip-book with our unique Google optimized e-Paper software.
<strong>Towards</strong> <strong>Anomaly</strong> <strong>Detection</strong> <strong>in</strong> <strong>SCADA</strong> <strong>Networks</strong> us<strong>in</strong>g<strong>Connection</strong> PatternsErik PleijsierUniversity of TwenteP.O. Box 217, 7500AE EnschedeThe Netherlandsf.k.pleijsier@student.utwente.nlABSTRACTA vital part of modern <strong>in</strong>frastructure is controlled by SupervisoryControl And Data Acquisition (<strong>SCADA</strong>) networks.Because <strong>SCADA</strong> systems are <strong>in</strong>creas<strong>in</strong>gly connectedto the Internet, they become more exposed to securitythreats. Therefore it is even more important to<strong>in</strong>vestigate possible security measures to prevent attacksfrom happen<strong>in</strong>g. In [3] some metrics are proposed to classifyhost behavior. These metrics are proven to be stableover time on real network traffic that is collected on atranspacific l<strong>in</strong>k of the <strong>in</strong>ternet. <strong>SCADA</strong> systems sharemuch of the network technology with traditional networksand therefore these metrics might also be applicable on<strong>SCADA</strong> networks. Because anomaly detection relies onmodel<strong>in</strong>g normal behavior and the host behavior is provento be stable over time under normal circumstances, themetrics might be used to aid anomaly detection. This paperprovides an analysis of the behavior of these metrics<strong>in</strong> <strong>SCADA</strong> networks and their applicability for anomalydetection <strong>in</strong> such networks.Keywordshost classification, <strong>SCADA</strong>, anomaly detection1. INTRODUCTIONA vital part of modern <strong>in</strong>frastructure is controlled by SupervisoryControl And Data Acquisition (<strong>SCADA</strong>) networks.<strong>SCADA</strong> systems are computer systems that areused to gather and analyze real-time data from sensors.Those systems can, for <strong>in</strong>stance, be found <strong>in</strong> environmentssuch as traffic control, chemical <strong>in</strong>dustry, water treatmentand electricity companies. The critical nature of these <strong>in</strong>frastructuresmakes secur<strong>in</strong>g it aga<strong>in</strong>st attacks especiallyimportant. The consequences of <strong>in</strong>sufficient security measurescould be catastrophic. Traditionally these networkswere believed to be secure, but more recently <strong>SCADA</strong> networkshave been proved to be vulnerable to cyber attacks.One of the ma<strong>in</strong> reasons that the <strong>SCADA</strong> systems werebelieved to be secure is that they were isolated networks.In addition, <strong>SCADA</strong> networks used proprietary protocolsfor communication. Over the years the use of standardizedprotocols such as Ethernet and TCP/IP <strong>in</strong>creased and soPermission to make digital or hard copies of all or part of this work forpersonal or classroom use is granted without fee provided that copiesare not made or distributed for profit or commercial advantage and thatcopies bear this notice and the full citation on the first page. To copy otherwise,or republish, to post on servers or to redistribute to lists, requiresprior specific permission and/or a fee.18 th Twente Student Conference on IT January 25 th , 2013, Enschede,The Netherlands.Copyright 2013, University of Twente, Faculty of Electrical Eng<strong>in</strong>eer<strong>in</strong>g,Mathematics and Computer Science.did the <strong>in</strong>terconnectivity between <strong>SCADA</strong> networks andthe corporate networks. Currently, <strong>SCADA</strong> systems areoften directly or <strong>in</strong>directly connected to the <strong>in</strong>ternet, sothey might be attacked from a remote location and thereforebe exposed to more threats. One example is the Maroochywater breach <strong>in</strong> 2000 (see [6]). An other exampleis the more recent stuxnet malware target<strong>in</strong>g <strong>SCADA</strong> <strong>in</strong>frastructure[4].Clearly, there is an <strong>in</strong>creas<strong>in</strong>g need forsecurity measures for this type of network.A particular field of network security is <strong>in</strong>trusion detection.Intrusion detection refers to detection of maliciousactivity <strong>in</strong> a computer system or network. <strong>Anomaly</strong> detectioncan be used for this purpose. <strong>Anomaly</strong> detectionrefers to the problem of f<strong>in</strong>d<strong>in</strong>g patterns <strong>in</strong> data that donot conform to the expected behavior[2]. This approachcontrast with the signature based detection, that relies onknown malicious behavior to detect anomalies. One of theadvantages of anomaly based detection is be<strong>in</strong>g able todetect attacks that are not known beforehand.One of the ma<strong>in</strong> problems with Intrusion detection systems(IDS)based on anomaly detection is that they oftenreport on traffic that is unusual, but not malicious.The reason for this is that network traffic is generallyvery dynamic. But because <strong>SCADA</strong> networks are morepredictable, anomaly detection might work better <strong>in</strong> a<strong>SCADA</strong> environment.A central part of anomaly detection is def<strong>in</strong><strong>in</strong>g what normalbehavior is for a certa<strong>in</strong> entity. In a network, there areseveral ways to achieve this, for <strong>in</strong>stance one could list allvalid messages on a network and use this as normal behavior.The approach taken <strong>in</strong> this research is us<strong>in</strong>g metricsto def<strong>in</strong>e normal behavior. The analysis of normal behaviorcan be done either host-based, where <strong>in</strong>formationis gathered from software that is <strong>in</strong>stalled on each host,or network-based, where the <strong>in</strong>formation is gathered at aplace <strong>in</strong> the network <strong>in</strong>frastructure. In this research thenetwork-based approach is taken. One of the advantagesof network-based analysis is that analysis is also possiblewhen it is not possible to <strong>in</strong>stall software on all hosts.Because <strong>SCADA</strong> networks adopted common network technologyand protocols, security measures for traditionalnetworks might be applicable to <strong>SCADA</strong> networks. Howeverdespite the many similarities between <strong>SCADA</strong> networksand other computer networks, there are also a coupleof key differences. The communication <strong>in</strong> <strong>SCADA</strong>networks, for example, tends to be periodical and hencepredictable because control systems poll data at constant<strong>in</strong>tervals. One other difference is that <strong>in</strong> a <strong>SCADA</strong> environmentit is not always possible or allowed to <strong>in</strong>stall softwareon the PLC’s, so host-based detection is not alwayspossible <strong>in</strong> a <strong>SCADA</strong> environment. Due to the differencesbetween traditional networks and <strong>SCADA</strong> networks, secu-
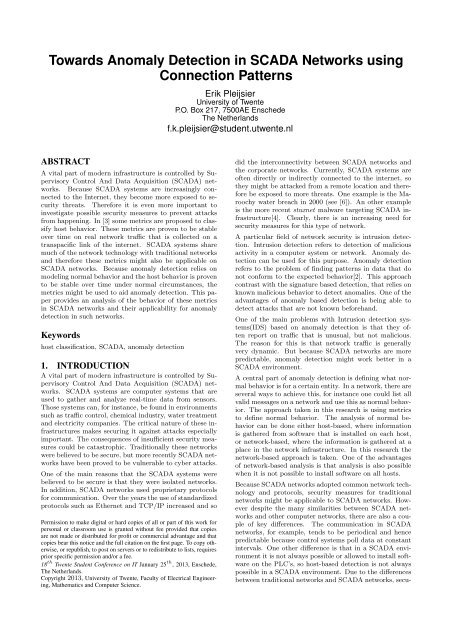
ity measures designed for the one type of network shouldalways be validated aga<strong>in</strong>st the other before apply<strong>in</strong>g it.In this work, the metrics <strong>in</strong> [3] that are def<strong>in</strong>ed to classifyhost behavior on the <strong>in</strong>ternet will be analyzed aga<strong>in</strong>st real<strong>SCADA</strong> network data. These metrics rely only on header<strong>in</strong>formation and can therefore be used without knowledgeof the payload of the packets. As part of that study the authorsproved that these metrics are stable over a large periodof time on real network traffic collected on a transpacificl<strong>in</strong>k of the <strong>in</strong>ternet. They also showed that thesemetrics are <strong>in</strong>fluenced by some malicious traffic, for examplethe metrics are <strong>in</strong>fluenced by the effects of the sasservirus. Because these metrics tend to stay stable over timeand change on some malicious traffic, it is proposed tosee whether they can be used for anomaly detection <strong>in</strong><strong>SCADA</strong> networks.The rema<strong>in</strong>der of this paper is organized as follows. In thenext section the <strong>SCADA</strong> network data that is used <strong>in</strong> theresearch is presented. In section 3 the research methodologyand the n<strong>in</strong>e <strong>in</strong>vestigated metrics are presented. Insection 4 the results will be discussed. In section 5 relatedwork is discussed. And f<strong>in</strong>ally <strong>in</strong> section 6 the conclusionsare presented.2. DATASETIn this research, network packet traces from a real world<strong>SCADA</strong> environment are used. The data is collected <strong>in</strong> awater treatment facility <strong>in</strong> the Netherlands. The structureof this network is displayed <strong>in</strong> Figure 1. In the network,different subnetworks are present to limit connectivity betweenthe different subnetworks. Two subnetworks arepresent: field and control.The field network consist of the programmable logic controllers(PLCs) that directly supervise sensors and actuators.The control network consist of servers that performdifferent tasks, such as authentication, account<strong>in</strong>g and sav<strong>in</strong>ghistorical <strong>in</strong>formation; and Human Mach<strong>in</strong>e Interfaces(HMI) that are controlled by human operators. Communicationbetween the field and control networks shouldgo through a node termed “<strong>SCADA</strong> server”. All importantmach<strong>in</strong>es for the <strong>in</strong>frastructure such as the “<strong>SCADA</strong>server” are duplicated, so if one mach<strong>in</strong>e fails, the otherwill take over. Two datasets are captured simultaneously,one <strong>in</strong> the field network, and one <strong>in</strong> the control network.The corporate network consist of regular network devices,such as employee computers, pr<strong>in</strong>ters and servers; and isconnected to the control network via a firewall. This subnetworkis not <strong>in</strong>cluded <strong>in</strong> this research because it is notconsidered part of the <strong>SCADA</strong> <strong>in</strong>frastructure and is notessentially different from other corporate networks.3. METHODOLOGYThe behavior of the n<strong>in</strong>e metrics from [3] is analyzedaga<strong>in</strong>st a real world <strong>SCADA</strong> network traffic dataset that isdescribed <strong>in</strong> the previous section. The data is first aggregatedby source IP address, so that characterization canbe done on host-level. After that, time series techniquesare applied to aid the analysis of the data. The aggregateddata is then split <strong>in</strong>to different time slots. Several sizes ofthe time slots are used <strong>in</strong> the time series, rang<strong>in</strong>g from onem<strong>in</strong>ute to one hour. The operators of this <strong>SCADA</strong> networkassume a period of one m<strong>in</strong>ute for periodic traffic,therefore we are not <strong>in</strong>terested <strong>in</strong> patterns that occur <strong>in</strong><strong>in</strong>tervals smaller then one m<strong>in</strong>ute. When the data is split<strong>in</strong>to the different time slots, the value for the metrics iscalculated <strong>in</strong> each time slot. Then the the last time slotis discarded because the data is not always aligned with amultiple of the time slot size. After that the data is plotted<strong>in</strong> graphs. Two types of graphs are used: graphs withthe time slots plotted aga<strong>in</strong>st the metric value and graphswith histograms that show the distribution of values overthe time slots. And f<strong>in</strong>ally the metrics are analyzed to seehow they behave and how stable they are <strong>in</strong> the <strong>SCADA</strong>environment.The metrics under <strong>in</strong>vestigation are described <strong>in</strong> the nextsections and are divided <strong>in</strong>to three categories: networkconnectivity, connection dispersion and traffic content.3.1 Network connectivity1. Number of peers2. Number of source ports3. Number of dest<strong>in</strong>ation portsNetwork connectivity metrics are used to characterize therole of a host <strong>in</strong> a network, for example if the host is aclient, a server or a comb<strong>in</strong>ation of both(e.g. as occurs <strong>in</strong>peer to peer traffic). Our assumption is that if a host isbehav<strong>in</strong>g normal, the role of this host <strong>in</strong> a network doesnot change and that there are malicious scenario’s that do<strong>in</strong>fluence the role of a host. For example when a host isbehav<strong>in</strong>g as a client for a time and then suddenly showssigns of server behavior, that host might be compromised.3.2 <strong>Connection</strong> dispersion4. Ratio of shannon entropies of the second and fourthbytes of dest<strong>in</strong>ation IP : S(IP2)/S(IP4)5. Ratio of shannon entropies of the third and fourthbytes of dest<strong>in</strong>ation IP : S(IP3)/S(IP4)The connection dispersion metrics are used to quantifythe spread<strong>in</strong>g <strong>in</strong> the list of dest<strong>in</strong>ation addresses of a host.The entropy is not taken directly over the whole IP address,but on different bytes of the IP address. This isbecause IP addresses are not distributed randomly, but <strong>in</strong>an organized manner.Accord<strong>in</strong>g to [3], the entropies over different bytes of theIP address are quite similar under normal circumstancesand large differences <strong>in</strong> these entropies might expose scann<strong>in</strong>g.While this is proven to work on a transpacific l<strong>in</strong>kof the <strong>in</strong>ternet, it might not be applicable to <strong>SCADA</strong> networks.Because <strong>SCADA</strong> networks are closed <strong>in</strong> a sensethat they are not directly connected to the Internet andshould only communicate to a few other subnetworks, thesecond and third bytes should vary <strong>in</strong> a small <strong>in</strong>terval (represent<strong>in</strong>gthe subnets) and the entropy should be fairlyconstant. So these metrics are expected to be stable, butwe do not expect them to be useful <strong>in</strong> the security context.3.3 Traffic content6. Mean number of packets per flow7. Percentage of small-size packets8. Percentage of large-size packets9. Entropy of the distribution of medium sized packetsThe traffic content metrics aid <strong>in</strong> the analysis of the transmittedtraffic. For example, the mean number of packets
<strong>SCADA</strong>Field network Control network Corporate networkPLCPLCHMIHMIPLC<strong>SCADA</strong> serverFirewallPLCPLCServerFigure 1. Conceptual network overviewpeers2.01.51.00.50.00 50 100 150 200 250hours from start of captureFigure 2. number of peers for atypical PLCpeers4.03.53.02.52.01.51.00.50.00 50 100 150 200hours from start of capture250Figure 3. number of peers for atypical HMIsrc_ports109876543210 50 100 150 200hours from start of capture250Figure 4. number of source portsfor a typical HMIper flow <strong>in</strong>dicates how many packets a host sends on averageto each of its peers. Small values for this metricmight <strong>in</strong>dicate attacks or scans, because not much data istransferred dur<strong>in</strong>g a scan.The percentage of small-size packets can be used to measurethe percentage of signal<strong>in</strong>g traffic <strong>in</strong> the total traffic,while the percentage of large size packets can be used tomeasure the percentage of packets that are used for dataexchange, such as downloads.The entropy of the distribution of medium sized packets isused to <strong>in</strong>dicate web or <strong>in</strong>teractive traffic, because it turnsout that these types of traffic have a higher variability <strong>in</strong>packet sizes. In a <strong>SCADA</strong> environment it might be usefulfor dist<strong>in</strong>ction between protocols with highly variablepacket sizes and traffic with less variation <strong>in</strong> packet size.An attack is likely to change this value. A port scan for examplemight send lots of packets with almost no variation<strong>in</strong> packet size.4. RESULTSOne general observation dur<strong>in</strong>g the analysis of the metricsis that us<strong>in</strong>g a slot size of one m<strong>in</strong>ute did not reveal significantdifferent results from analysis us<strong>in</strong>g a time slot sizeof one hour. Therefore the results are discussed based ongraphs that resulted from the analysis with time slot sizeset to one hour.4.1 Network connectivityThe number of peers for a PLC is displayed <strong>in</strong> Figure 2. Inthis figure it is seen that this PLC host only has one peerdur<strong>in</strong>g each time slot, with the exception of one time slotwhere it has two peers. Due to the fact that all networktraffic from and to the PLC’s is supposed to be handled viaone “<strong>SCADA</strong> server” (as discussed <strong>in</strong> Section 2) the PLC’sshould always communicate with just one s<strong>in</strong>gle peer (the<strong>SCADA</strong> server).When further <strong>in</strong>vestigat<strong>in</strong>g the time slot where this PLC’swas communicat<strong>in</strong>g with two peers, we observe a mach<strong>in</strong>e<strong>in</strong>side the control network connect<strong>in</strong>g directly to a PLCbypass<strong>in</strong>g the <strong>SCADA</strong> server. This should not happenand it is, therefore, an <strong>in</strong>dication that this metric can beuseful <strong>in</strong> anomaly detection. Because all PLC hosts showa similar behavior only one is displayed.On the control network all nodes also connect to the“<strong>SCADA</strong> server” for communication with the nodes <strong>in</strong>sidethe field network, but on the control network there is alsosome direct communication between different hosts <strong>in</strong>sidethe control network. Therefore a little more time slots areseen where the number of peers is higher than one (seeFigure 3).The number of source ports and the number of dest<strong>in</strong>ationports for a typical HMI mach<strong>in</strong>e are respectively shown<strong>in</strong> Figures 4 and 5. In these figures a stable value of twosource ports and two dest<strong>in</strong>ation ports is seen with someexceptions to other values. The exceptions co<strong>in</strong>cide withthe change <strong>in</strong> number of peers as seen <strong>in</strong> Figure 3. OtherHMI mach<strong>in</strong>es show similar behavior, show<strong>in</strong>g a quite stableand equal value for the number of source ports andthe number of dest<strong>in</strong>ation ports, although the exact numbervaries between different HMI mach<strong>in</strong>es, it is alwaysbetween two and five. The analysis shows that HMI mach<strong>in</strong>esbehave <strong>in</strong> a stable way.In Figure 6 the number of dest<strong>in</strong>ation ports is shown. Thisfigure reveals a stable value between 170 and 175 for numberof dest<strong>in</strong>ation ports with one higher value. This highervalue co<strong>in</strong>cides with the already discussed event where the
dst_ports3.02.52.01.51.00 50 100 150 200 250hours from start of captureFigure 5. number of dest<strong>in</strong>ationports for a typical HMImean #packets per flow200180160140120100800 50 100 150 200 250m<strong>in</strong>utes from start of captureFigure 8. mean number of packetsper flow for a typical PLCdst_ports2001901801701601500 50 100 150 200 250hours from start of captureFigure 6. number of dest<strong>in</strong>ationports for a typical PLCnumber of b<strong>in</strong>s161412108642080 100 120 140 160 180mean #packets per flow200Figure 9. Histogram of meannumber of packets per flowentropy ip3/ip42.01.51.00.50.00.51.00 50 100 150 200 250hours from start of captureFigure 7. ratio of shannon entropies:S(IP3)/S(IP4)probability0.350.300.250.200.150.100.050.000 200 400 600 800 1000 1200 1400 1600packetsize (bytes)Figure 10. Packet-size distributionof the <strong>SCADA</strong> network<strong>SCADA</strong> server was bypassed. The number of source portsfor PLC’s is not shown, because for all PLC’s this numberturned out to be fixed to either one or two depend<strong>in</strong>gon the services provided. Analysis of number of sourceports and the number of dest<strong>in</strong>ation ports reveal that thePLC devices are act<strong>in</strong>g as servers <strong>in</strong> the network, the lownumber of source ports correspond to the services providedand the high number of dest<strong>in</strong>ation ports is expla<strong>in</strong>ed bythe fact that clients just pick an available port to communicatewith the PLC. It also reveals that this behavioris very stable under normal conditions and is sensitive toanomalous events.The first conclusion that can be drawn by look<strong>in</strong>g at thenetwork connectivity metrics is that the metrics do staystable <strong>in</strong> a <strong>SCADA</strong> environment. The second conclusionis that at least some anomalous behavior can be detectedby us<strong>in</strong>g them. A third observation is that the metrics canbe used to dist<strong>in</strong>ct between PLC’s and HMI devices, butall devices with<strong>in</strong> either group showed similar behavior. Af<strong>in</strong>al observation is that PLC’s behave a little more stablethen the HMI mach<strong>in</strong>es.4.2 <strong>Connection</strong> dispersionIn Figure 7 the ratio of shannon entropies of the third andfourth bytes of dest<strong>in</strong>ation IP is shown. This figure showsa stable value of zero with one exception with a value ofone. This is expla<strong>in</strong>able by the way the <strong>SCADA</strong> networkis arranged. Because each host is normally only communicat<strong>in</strong>gwith the <strong>SCADA</strong> server, the entropy on the firstthree bytes of the dest<strong>in</strong>ation IP address is always zero.When the earlier described <strong>SCADA</strong> bypass event occurredthe entropy over the third byte of the entropy did changeto one because the host that was directly communicat<strong>in</strong>gwith the PLC’s was <strong>in</strong> an other subnetwork (the fieldnetwork).The Ratio of shannon entropies of the second and fourthbytes of dest<strong>in</strong>ation IP is not shown because this value waswithout exception fixed to zero. The reason for this is thatno direct communication with hosts outside the <strong>SCADA</strong>network occurred.The connection dispersion metrics are very stable, butthey are not very <strong>in</strong>formative. We argue that this is truenot only for this particular <strong>SCADA</strong> network, but <strong>in</strong> general.Because <strong>SCADA</strong> networks are <strong>in</strong> general arranged <strong>in</strong>a way that prevent direct communication with hosts outsidesome subnetworks the entropy over the first two bytesof the IP will <strong>in</strong> this cases never change to a value otherthan zero.If however events occur where the entropy over the firstbytes of the IP change, this should be handled with extremecaution because this represent highly unwanted traffic.It should be noted that there are simpler methods todetect this events, for example: <strong>in</strong> <strong>SCADA</strong>, networks communicationis allowed between a small number of subnetworks.One could list all subnetworks that are allowed tocommunicate with and check if the source and dest<strong>in</strong>ationIP addresses are all with<strong>in</strong> these subnetworks.4.3 Traffic contentIn Figure 8 the mean number of packets per flow is shown.This figure reveals the first metric that is not stable. Tomake more clear how the different values are distributedover the time slots a histogram of the same data is shown<strong>in</strong> Figure 9. In this figure it is seen that values around170,185 and 200 of mean number of packets per flow occurclearly more than other values. It is not clear why thishappens.To determ<strong>in</strong>e the Percentage of small-size packets, thePercentage of large-size packets and the Entropy of thedistribution of medium sized packets it is necessary to def<strong>in</strong>ewhat the packet size limit for small packets and them<strong>in</strong>imum packet size for large packets are. In [3], thethresholds for small and large packets are respectively def<strong>in</strong>edas 144 bytes and 1392 bytes. When these thresholds
% small size pkt(
[1] R. R. R. Barbosa, R. Sadre, and A. Pras. <strong>Towards</strong>periodicity based anomaly detection <strong>in</strong> scadanetworks. In IEEE 17th Conference on Emerg<strong>in</strong>gTechnologies & Factory Automation, ETFA 2012,Kraków, Poland, USA, September 2012. IEEEIndustrial Electronics Society.[2] V. Chandola, A. Banerjee, and V. Kumar. <strong>Anomaly</strong>detection: A survey. ACM Comput<strong>in</strong>g Surveys(CSUR), 41(3):15, 2009.[3] G. Dewaele, Y. Himura, P. Borgnat, K. Fukuda,P. Abry, O. Michel, R. Fontugne, K. Cho, andH. Esaki. Unsupervised host behavior classificationfrom connection patterns. International Journal ofNetwork Management, 20(5):317–337, 2010.[4] N. Falliere, L. Murchu, and E. Chien. W32. stuxnetdossier. White paper, Symantec Corp., SecurityResponse, 2011.[5] U. Premaratne, J. Samarabandu, T. Sidhu,R. Beresh, and J. Tan. An <strong>in</strong>trusion detection systemfor iec61850 automated substations. Power Delivery,IEEE Transactions on, 25(4):2376–2383, 2010.[6] J. Slay and M. Miller. Lessons learned from themaroochy water breach. International Federation forInformation Process<strong>in</strong>g, 253:73, 2008.[7] A. Valdes and S. Cheung. Communication patternanomaly detection <strong>in</strong> process control systems. InTechnologies for Homeland Security, 2009. HST’09.IEEE Conference on, pages 22–29. IEEE, 2009.