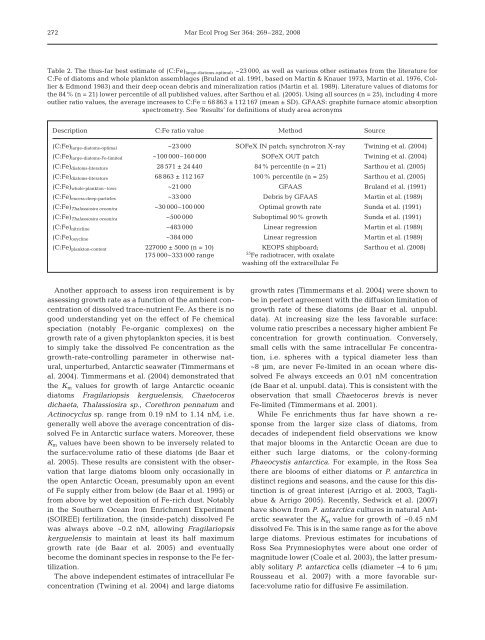
272Mar Ecol Prog Ser 364: 269–282, 2008Table 2. The thus-far best estimate <strong>of</strong> (C:Fe) large-diatoms-optimal , ~23 000, as well as various other estimates from the literature forC:Fe <strong>of</strong> diatoms and whole plankton assemblages (Bruland et al. 1991, based on Mart<strong>in</strong> & Knauer 1973, Mart<strong>in</strong> et al. 1976, Collier& Edmond 1983) and their deep <strong>ocean</strong> debris and m<strong>in</strong>eralization ratios (Mart<strong>in</strong> et al. 1989). Literature values <strong>of</strong> diatoms forthe 84% (n = 21) lower <strong>per</strong>centile <strong>of</strong> all published values, after Sarthou et al. (2005). Us<strong>in</strong>g all sources (n = 25), <strong>in</strong>clud<strong>in</strong>g 4 moreoutlier ratio values, the average <strong>in</strong>creases to C:Fe = 68 863 ± 112 167 (mean ± SD). GFAAS: graphite furnace atomic absorptionspectrometry. See ‘Results’ for def<strong>in</strong>itions <strong>of</strong> study area acronymsDescription C:Fe ratio value Method Source(C:Fe) large-diatoms-optimal ~23 000 SOFeX IN patch; synchrotron X-ray Tw<strong>in</strong><strong>in</strong>g et al. (2004)(C:Fe) large-diatoms-Fe-limited ~100 000–160 000 SOFeX OUT patch Tw<strong>in</strong><strong>in</strong>g et al. (2004)(C:Fe) diatoms-literature 28 571 ± 24 440 84% <strong>per</strong>centile (n = 21) Sarthou et al. (2005)(C:Fe) diatoms-literature 68 863 ± 112 167 100% <strong>per</strong>centile (n = 25) Sarthou et al. (2005)(C:Fe) whole-plankton–tows ~21 000 GFAAS Bruland et al. (1991)(C:Fe) excess-deep-particles ~33 000 Debris by GFAAS Mart<strong>in</strong> et al. (1989)(C:Fe) Thalassiosira <strong>ocean</strong>ica ~30 000–100 000 Optimal growth rate Sunda et al. (1991)(C:Fe) Thalassiosira <strong>ocean</strong>ica ~500 000 Suboptimal 90% growth Sunda et al. (1991)(C:Fe) nitricl<strong>in</strong>e ~483 000 L<strong>in</strong>ear regression Mart<strong>in</strong> et al. (1989)(C:Fe) oxycl<strong>in</strong>e ~384 000 L<strong>in</strong>ear regression Mart<strong>in</strong> et al. (1989)(C:Fe) plankton-content 227000 ± 5000 (n = 10) KEOPS shipboard; Sarthou et al. (2008)175 000–333 000 range 55 Fe radiotracer, with oxalatewash<strong>in</strong>g <strong>of</strong>f the extracellular FeAnother approach to assess <strong>iron</strong> requirement is byassess<strong>in</strong>g growth rate as a function <strong>of</strong> the ambient concentration<strong>of</strong> dissolved trace-nutrient Fe. As there is nogood understand<strong>in</strong>g yet on the effect <strong>of</strong> Fe chemicalspeciation (notably Fe-organic complexes) on thegrowth rate <strong>of</strong> a given phytoplankton species, it is bestto simply take the dissolved Fe concentration as thegrowth-rate-controll<strong>in</strong>g parameter <strong>in</strong> otherwise natural,un<strong>per</strong>turbed, Antarctic seawater (Timmermans etal. 2004). Timmermans et al. (2004) demonstrated thatthe K m values for growth <strong>of</strong> large Antarctic <strong>ocean</strong>icdiatoms Fragilariopsis kerguelensis, Chaetocerosdichaeta, Thalassiosira sp., Corethron pennatum andAct<strong>in</strong>ocyclus sp. range from 0.19 nM to 1.14 nM, i.e.generally well above the average concentration <strong>of</strong> dissolvedFe <strong>in</strong> Antarctic surface waters. Moreover, theseK m values have been shown to be <strong>in</strong>versely related tothe surface:volume ratio <strong>of</strong> these diatoms (de Baar etal. 2005). These results are consistent with the observationthat large diatoms bloom only occasionally <strong>in</strong>the open Antarctic Ocean, presumably upon an event<strong>of</strong> Fe supply either from below (de Baar et al. 1995) orfrom above by wet deposition <strong>of</strong> Fe-rich dust. Notably<strong>in</strong> the Southern Ocean Iron Enrichment Ex<strong>per</strong>iment(SOIREE) <strong>fertilization</strong>, the (<strong>in</strong>side-patch) dissolved Fewas always above ~0.2 nM, allow<strong>in</strong>g Fragilariopsiskerguelensis to ma<strong>in</strong>ta<strong>in</strong> at least its half maximumgrowth rate (de Baar et al. 2005) and eventuallybecome the dom<strong>in</strong>ant species <strong>in</strong> response to the Fe <strong>fertilization</strong>.The above <strong>in</strong>dependent estimates <strong>of</strong> <strong>in</strong>tracellular Feconcentration (Tw<strong>in</strong><strong>in</strong>g et al. 2004) and large diatomsgrowth rates (Timmermans et al. 2004) were shown tobe <strong>in</strong> <strong>per</strong>fect agreement with the diffusion limitation <strong>of</strong>growth rate <strong>of</strong> these diatoms (de Baar et al. unpubl.data). At <strong>in</strong>creas<strong>in</strong>g size the less favorable surface:volume ratio prescribes a necessary higher ambient Feconcentration for growth cont<strong>in</strong>uation. Conversely,small cells with the same <strong>in</strong>tracellular Fe concentration,i.e. spheres with a typical diameter less than~8 µm, are never Fe-limited <strong>in</strong> an <strong>ocean</strong> where dissolvedFe always exceeds an 0.01 nM concentration(de Baar et al. unpubl. data). This is consistent with theobservation that small Chaetoceros brevis is neverFe-limited (Timmermans et al. 2001).While Fe enrichments thus far have shown a responsefrom the larger size class <strong>of</strong> diatoms, fromdecades <strong>of</strong> <strong>in</strong>dependent field observations we knowthat major blooms <strong>in</strong> the Antarctic Ocean are due toeither such large diatoms, or the colony-form<strong>in</strong>gPhaeocystis antarctica. For example, <strong>in</strong> the Ross Seathere are blooms <strong>of</strong> either diatoms or P. antarctica <strong>in</strong>dist<strong>in</strong>ct regions and seasons, and the cause for this dist<strong>in</strong>ctionis <strong>of</strong> great <strong>in</strong>terest (Arrigo et al. 2003, Tagliabue& Arrigo 2005). Recently, Sedwick et al. (2007)have shown from P. antarctica cultures <strong>in</strong> natural Antarcticseawater the K m value for growth <strong>of</strong> ~0.45 nMdissolved Fe. This is <strong>in</strong> the same range as for the abovelarge diatoms. Previous estimates for <strong>in</strong>cubations <strong>of</strong>Ross Sea Prymnesiophytes were about one order <strong>of</strong>magnitude lower (Coale et al. 2003), the latter presumablysolitary P. antarctica cells (diameter ~4 to 6 µm;Rousseau et al. 2007) with a more favorable surface:volumeratio for diffusive Fe assimilation.
de Baar et al.: <strong>Efficiency</strong> <strong>of</strong> <strong>ocean</strong> <strong>iron</strong> <strong>fertilization</strong>273Other literature estimates <strong>of</strong> <strong>iron</strong> requirement <strong>of</strong>diatomsIn context <strong>of</strong> the Iron Resources and Oceanic Nutrients:Advancement <strong>of</strong> Global Ecosystem Simulations(IRONAGES) project, reviews based on previous studieshave focused on the limitations by light, majornutrients and <strong>iron</strong>, <strong>of</strong> major bloom-form<strong>in</strong>g groups, thediatoms (Sarthou et al. 2005), Phaeocystis spp. (Schoemannet al. 2005), diazotrophs (La Roche & Breitbarth2005), and picoplankton (Timmermans et al. 2005),while f<strong>in</strong>e reviews already existed for the coccolithophorids(Iglesias-Rodríguez et al. 2002, Paasche2002). Briefly, the cell quota for diatoms have an average(mean ± SD) C:Fe = 28 571 ± 24 440 based on 21publications <strong>of</strong> laboratory <strong>in</strong>cubation studies (Sarthouet al. 2005).Several <strong>of</strong> the previous studies, while novel at thetime, may <strong>in</strong> retrospect require caveats for the follow<strong>in</strong>greasons. Firstly, the problem <strong>of</strong> measur<strong>in</strong>g true<strong>in</strong>tracellular Fe content as mentioned above rendersmany old C:Fe values questionable. Secondly, <strong>in</strong> thepioneer<strong>in</strong>g days <strong>of</strong> metal–phytoplankton <strong>in</strong>teractionex<strong>per</strong>iments, it was not yet possible to achieve theultraclean dissolved metal concentrations we know toexist <strong>in</strong> the real <strong>ocean</strong>. In order to overcome this, theculture media were overdosed with 10 –4 M EDTA,which b<strong>in</strong>ds all dissolved metal ions; by then overdos<strong>in</strong>gwith the metal <strong>of</strong> <strong>in</strong>terest, a ‘free metal’ concentrationsimilar to the total metal <strong>in</strong> the real <strong>ocean</strong> wasachieved (Provasoli et al. 1957). This method has ledto many breakthroughs (e.g. Sunda & Guillard 1976).For Fe limitation, the <strong>in</strong>herent paradigm has become(de Baar 1994) that the calculated free Fe’ is the controll<strong>in</strong>gagent for phytoplankton growth. However,these ex<strong>per</strong>iments were conducted <strong>in</strong> EDTA media.S<strong>in</strong>ce the 1994 discovery <strong>of</strong> >99% organic complexation<strong>of</strong> dissolved Fe <strong>in</strong> the real <strong>ocean</strong> (Gledhill & vanden Berg 1994), EDTA media now are known to be notrepresentative <strong>of</strong> the real <strong>ocean</strong> (Gerr<strong>in</strong>ga et al. 2000).Moreover, with the ultraclean methods <strong>of</strong> today, it isnot necessary anymore to add EDTA to circumvent<strong>in</strong>advertent contam<strong>in</strong>ation.From a comparison <strong>of</strong> the cellular Fe requirements <strong>of</strong>the coastal diatom Thalassiosira pseudonana and the<strong>ocean</strong>ic diatom T. <strong>ocean</strong>ica (Sunda et al. 1991), one candeterm<strong>in</strong>e from the reported growth curve that at theoptimum growth rate <strong>of</strong> ~1.2 d –1 <strong>of</strong> T. <strong>ocean</strong>ica, the correspond<strong>in</strong>gsuggested cell ratio is <strong>in</strong> the range <strong>of</strong> C:Fe= ~30 000 to 100 000. At suboptimal (~90% <strong>of</strong> maximum)rate <strong>of</strong> growth the correspond<strong>in</strong>g cell ratio presumablyis <strong>in</strong> the order <strong>of</strong> C:Fe = ~500 000. However,these ex<strong>per</strong>iments were <strong>in</strong> EDTA media and not relevantfor the real <strong>ocean</strong>. Otherwise, (Sunda et al. 1991)reported that it was not possible to drive T. <strong>ocean</strong>ica<strong>in</strong>to Fe limitation, at most a suppression to 90% <strong>of</strong>maximum growth was realized. This is consistent withthe fact that T. <strong>ocean</strong>ica is a very small diatom andtherefore will never be Fe diffusion limited <strong>in</strong> real<strong>ocean</strong> waters (de Baar et al. 2008), ak<strong>in</strong> to the similarlysmall <strong>ocean</strong>ic diatom Chaetoceros brevis which couldnot be driven <strong>in</strong>to Fe limitation <strong>in</strong> natural Antarcticseawater either (Timmermans et al. 2001), except afterthe addition <strong>of</strong> very strong siderophore DFOB (desferrioxam<strong>in</strong>e-B)mak<strong>in</strong>g Fe unavailable for uptake.Quite remarkably, addition <strong>of</strong> DFOB to natural Antarcticseawater cannot even drive T. <strong>ocean</strong>ica <strong>in</strong>to Fe limitation(K. R. Timmermans et al. unpubl. data). Somehow,DFOB-bound Fe appears to be available toT. <strong>ocean</strong>ica, but not at all available to C. brevis (Timmermanset al. 2001). Similarly, Hutch<strong>in</strong>s et al. (1999)reported that different phytoplankton species canaccess different Fe-organic species, i.e. someth<strong>in</strong>gmore than just <strong>in</strong>organic Fe’(III) is affect<strong>in</strong>g growth.Sedwick et al. (2007) also report that DFOB bound Fesomehow is partly available for Phaeocystis antarctica.Researchers are only beg<strong>in</strong>n<strong>in</strong>g to unravel the <strong>in</strong>trigu<strong>in</strong>g<strong>in</strong>teractions between several organic ligands andseveral different phytoplankton species (Rijkenberg etal. 2006, 2008), as natural <strong>iron</strong>–plankton <strong>in</strong>teractionscan only be assessed <strong>in</strong> natural seawater.Efforts to derive C:Fe ratio values from the deep<strong>ocean</strong>One <strong>of</strong> the first reliable vertical pr<strong>of</strong>iles <strong>of</strong> dissolvedFe <strong>in</strong> the deep <strong>ocean</strong> was <strong>in</strong> the north Pacific Ocean at50° N, 145° W (Ocean Station Papa) which appeared toexhibit similarity to the vertical distribution <strong>of</strong> nitrate(Mart<strong>in</strong> et al. 1989) but, l<strong>in</strong>ear correlation, ak<strong>in</strong> to e.g.phosphate versus nitrate (Redfield et al. 1963), betweenFe and nitrate was not successful. However, bycomb<strong>in</strong><strong>in</strong>g data only <strong>in</strong> the nitricl<strong>in</strong>e <strong>of</strong> 50° N, 145° W(Ocean Station Papa) and adjacent stations at 40° N,140° W (Vertex T-5) and 45° N, 143° W (Vertex T-6) al<strong>in</strong>ear relation was achieved (Mart<strong>in</strong> et al. 1989). Conversion<strong>of</strong> N to C by classical Redfield (C:N = 106:16 =~6.6) yielded C:Fe = ~483 000 (de Baar & de Jong 2001,p. 164). Similarly, versus the oxycl<strong>in</strong>e, C:Fe = ~384 000was obta<strong>in</strong>ed. On the other hand, excess Fe on deepparticles (excess over lithogenic Fe) presumably representsbiogenic Fe and led to a C:Fe = ~33 000 (Mart<strong>in</strong>et al. 1989). This is similar to the C:Fe = ~21 000 <strong>of</strong>whole plankton tows (Bruland et al. 1991).With some more recent vertical pr<strong>of</strong>iles <strong>of</strong> dissolved Fe<strong>in</strong> other <strong>ocean</strong> bas<strong>in</strong>s (de Baar & de Jong 2001, Parekh etal. 2005, Bergquist & Boyle 2006), it now appears thatdissolved Fe <strong>in</strong> the deep <strong>ocean</strong>s is with<strong>in</strong> a narrow band<strong>of</strong> concentrations and does not show the general <strong>in</strong>-