Root Causes of African Underdevelopment
Root Causes of African Underdevelopment
Root Causes of African Underdevelopment

You also want an ePaper? Increase the reach of your titles
YUMPU automatically turns print PDFs into web optimized ePapers that Google loves.
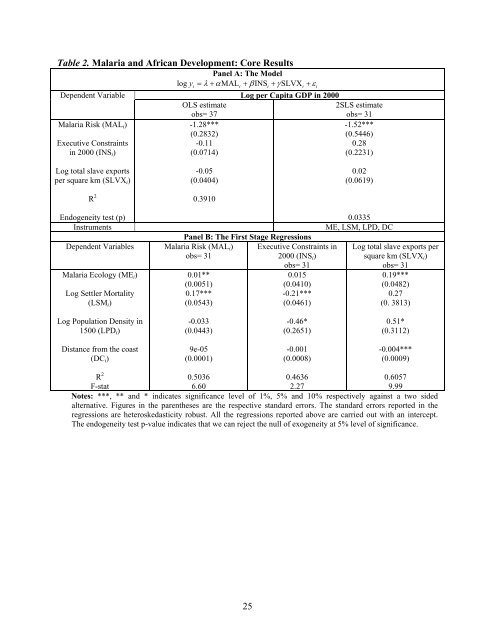
Table 2. Malaria and <strong>African</strong> Development: Core ResultsDependent VariableMalaria Risk (MAL i )Executive Constraintsin 2000 (INS i )Panel A: The Modellog = λ + αMAL + βINS + γSLVX+ εy i i i i iOLS estimateobs= 37-1.28***(0.2832)-0.11(0.0714)Log per Capita GDP in 20002SLS estimateobs= 31-1.52***(0.5446)0.28(0.2231)Log total slave exportsper square km (SLVX i )R 2-0.05(0.0404)0.39100.02(0.0619)Endogeneity test (p)InstrumentsDependent Variables Malaria Risk (MAL i )obs= 31Malaria Ecology (ME i )Log Settler Mortality(LSM i )Panel B: The First Stage Regressions0.01**(0.0051)0.17***(0.0543)Executive Constraints in2000 (INS i )obs= 310.015(0.0410)-0.21***(0.0461)0.0335ME, LSM, LPD, DCLog total slave exports persquare km (SLVX i )obs= 310.19***(0.0482)0.27(0. 3813)Log Population Density in1500 (LPD i )-0.033(0.0443)-0.46*(0.2651)0.51*(0.3112)Distance from the coast(DC i )9e-05(0.0001)-0.001(0.0008)-0.004***(0.0009)0.50360.46360.6057F-stat6.602.279.99Notes: ***, ** and * indicates significance level <strong>of</strong> 1%, 5% and 10% respectively against a two sidedalternative. Figures in the parentheses are the respective standard errors. The standard errors reported in theregressions are heteroskedasticity robust. All the regressions reported above are carried out with an intercept.The endogeneity test p-value indicates that we can reject the null <strong>of</strong> exogeneity at 5% level <strong>of</strong> significance.R 225