Root Causes of African Underdevelopment
Root Causes of African Underdevelopment
Root Causes of African Underdevelopment

Create successful ePaper yourself
Turn your PDF publications into a flip-book with our unique Google optimized e-Paper software.
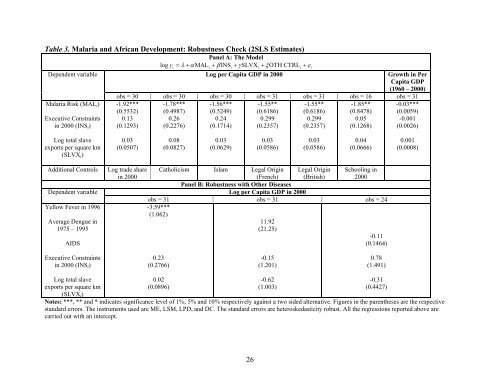
Table 3. Malaria and <strong>African</strong> Development: Robustness Check (2SLS Estimates)Panel A: The Modellog y = λ + αMAL + βINS + γSLVX + ξOTH CTRL + εDependent variableMalaria Risk (MAL i )Executive Constraintsin 2000 (INS i )i i i i i iLog per Capita GDP in 2000Growth in PerCapita GDP(1960 – 2000)obs = 30 obs = 30 obs = 30 obs = 31 obs = 31 obs = 16 obs = 31-1.92*** -1.78*** -1.56*** -1.55** -1.55** -1.85** -0.03***(0.5532) (0.4987) (0.5249) (0.6186) (0.6186) (0.8478) (0.0059)0.130.260.240.2990.2990.05-0.001(0.1293) (0.2276) (0.1714) (0.2357) (0.2357) (0.1268) (0.0026)Log total slaveexports per square km(SLVX i )0.03(0.0507)0.08(0.0827)0.03(0.0629)0.03(0.0586)0.03(0.0586)0.04(0.0666)0.001(0.0008)Additional ControlsDependent variableYellow Fever in 1996Average Dengue in1975 – 1995AIDSLog trade sharein 2000Catholicism Islam Legal Origin(French)Legal Origin(British)Schooling in2000Panel B: Robustness with Other DiseasesLog per Capita GDP in 2000obs = 31 obs = 31 obs = 24-3.59***(1.062)11.92(21.25)-0.11(0.1464)Executive Constraintsin 2000 (INS i )0.23(0.2766)-0.15(1.201)0.78(1.491)Log total slaveexports per square km(SLVX i )0.02(0.0896)-0.62(1.003)-0.31(0.4427)Notes: ***, ** and * indicates significance level <strong>of</strong> 1%, 5% and 10% respectively against a two sided alternative. Figures in the parentheses are the respectivestandard errors. The instruments used are ME, LSM, LPD, and DC. The standard errors are heteroskedasticity robust. All the regressions reported above arecarried out with an intercept.26