L22 - Tata AIA Life Insurance
L22 - Tata AIA Life Insurance
L22 - Tata AIA Life Insurance

Create successful ePaper yourself
Turn your PDF publications into a flip-book with our unique Google optimized e-Paper software.
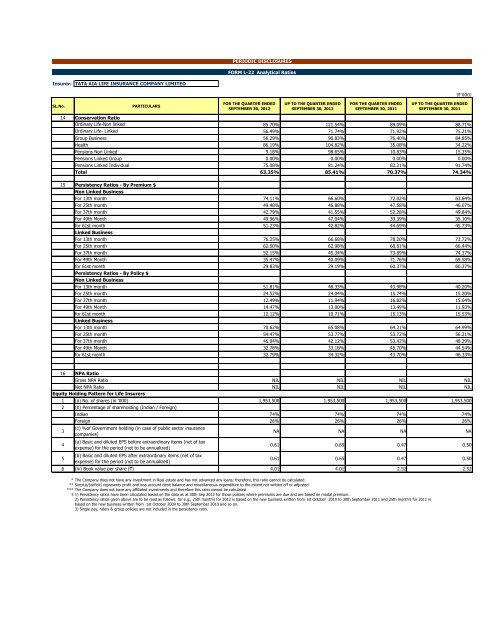
PERIODIC DISCLOSURESFORM L-22 Analytical RatiosInsurer: TATA <strong>AIA</strong> LIFE INSURANCE COMPANY LIMITED(`’000)SL.No.PARTICULARSFOR THE QUARTER ENDEDSEPTEMBER 30, 2012UP TO THE QUARTER ENDEDSEPTEMBER 30, 2012FOR THE QUARTER ENDEDSEPTEMBER 30, 2011UP TO THE QUARTER ENDEDSEPTEMBER 30, 201114 Conservation RatioOrdinary <strong>Life</strong>-Non linked 85.70% 121.54% 89.09% 88.71%Ordinary <strong>Life</strong>- Linked 56.49% 71.74% 71.92% 75.21%Group Business 56.29% 90.83% 76.40% 84.85%Health 86.19% 104.82% 35.08% 34.22%Pensions Non Linked 9.18% 98.65% 10.83% 15.35%Pensions Linked Group 0.00% 0.00% 0.00% 0.00%Pensions Linked Individual 75.08% 81.24% 82.21% 91.74%Total 63.35% 85.41% 70.37% 74.34%15 Persistency Ratios - By Premium $Non Linked BusinessFor 13th month 74.11% 66.60% 72.02% 63.64%For 25th month 49.48% 46.88% 47.58% 46.07%For 37th month 42.79% 41.55% 52.28% 49.84%For 49th Month 49.96% 47.04% 39.39% 35.10%for 61st month 51.23% 42.82% 44.69% 45.73%Linked BusinessFor 13th month 76.25% 66.68% 78.20% 73.72%For 25th month 62.50% 62.98% 68.81% 66.44%For 37th month 52.15% 45.34% 73.89% 74.37%For 49th Month 35.47% 40.09% 71.76% 69.58%for 61st month 29.83% 29.19% 60.37% 60.37%Persistency Ratios - By Policy $Non Linked BusinessFor 13th month 51.81% 48.33% 43.98% 40.20%For 25th month 24.52% 24.04% 15.74% 15.20%For 37th month 12.49% 11.94% 16.82% 15.04%For 49th Month 14.47% 13.00% 13.49% 11.93%for 61st month 12.12% 10.71% 15.13% 15.53%Linked BusinessFor 13th month 70.62% 65.08% 64.21% 64.99%For 25th month 54.47% 53.77% 53.72% 56.21%For 37th month 46.04% 42.12% 53.42% 48.29%For 49th Month 32.78% 33.18% 45.70% 44.54%for 61st month 32.79% 34.32% 43.70% 46.33%16 NPA RatioGross NPA Ratio NIL NIL NIL NILNet NPA Ratio NIL NIL NIL NILEquity Holding Pattern for <strong>Life</strong> Insurers1 (a) No. of shares (in '000) 1,953,500 1,953,500 1,953,500 1,953,5002 (b) Percentage of shareholding (Indian / Foreign)345Indian 74% 74% 74% 74%Foreign 26% 26% 26% 26%(c) %of Government holding (in case of public sector insurancecompanies)(a) Basic and diluted EPS before extraordinary items (net of taxexpense) for the period (not to be annualized)(b) Basic and diluted EPS after extraordinary items (net of taxexpense) for the period (not to be annualized)NA NA NA NA0.61 0.65 0.47 0.500.61 0.65 0.47 0.506 (iv) Book value per share (`) 4.01 4.01 2.52 2.52* The Company does not have any investment in Real estate and has not advanced any loans; therefore, this ratio cannot be calculated.** Surplus/(deficit) represents profit and loss account debit balance and miscellaneous expenditure to the extent not written off or adjusted*** The Company does not have any affiliated investments and therefore this ratio cannot be calculated$ 1) Persistency ratios have been calculated based on the data as at 30th Sep 2012 for those policies where premiums are due and are based on modal premium.2) Persistency ratios given above are to be read as follows: for e.g., 25th month's for 2012 is based on the new business written from 1st October 2010 to 30th September 2011 and 25th month's for 2011 isbased on the new business written from 1st October 2009 to 30th September 2010 and so on.3) Single pay, riders & group policies are not included in the persistency ratio.