Annual Fund Reports - Apr '08 - Mar ' - Tata AIA Life Insurance
Annual Fund Reports - Apr '08 - Mar ' - Tata AIA Life Insurance
Annual Fund Reports - Apr '08 - Mar ' - Tata AIA Life Insurance
Create successful ePaper yourself
Turn your PDF publications into a flip-book with our unique Google optimized e-Paper software.
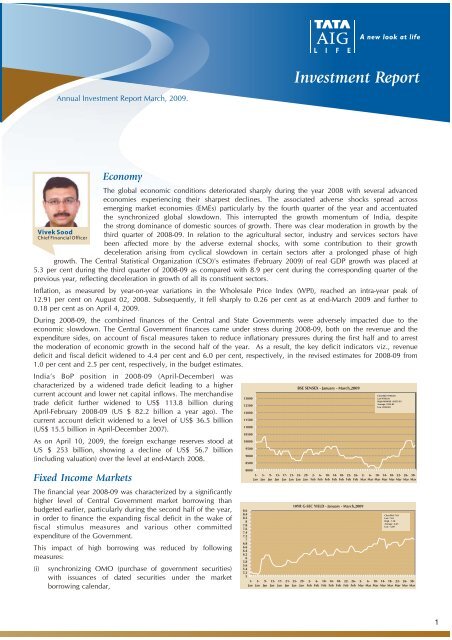
Investment Report<strong>Annual</strong> Investment Report <strong>Mar</strong>ch, 2009.EconomyThe global economic conditions deteriorated sharply during the year 2008 with several advancedeconomies experiencing their sharpest declines. The associated adverse shocks spread acrossemerging market economies (EMEs) particularly by the fourth quarter of the year and accentuatedthe synchronized global slowdown. This interrupted the growth momentum of India, despitethe strong dominance of domestic sources of growth. There was clear moderation in growth by thethird quarter of 2008-09. In relation to the agricultural sector, industry and services sectors havebeen affected more by the adverse external shocks, with some contribution to their growthdeceleration arising from cyclical slowdown in certain sectors after a prolonged phase of highgrowth. The Central Statistical Organization (CSO)'s estimates (February 2009) of real GDP growth was placed atVivek SoodChief Financial Officer5.3 per cent during the third quarter of 2008-09 as compared with 8.9 per cent during the corresponding quarter of theprevious year, reflecting deceleration in growth of all its constituent sectors.Inflation, as measured by year-on-year variations in the Wholesale Price Index (WPI), reached an intra-year peak of12.91 per cent on August 02, 2008. Subsequently, it fell sharply to 0.26 per cent as at end-<strong>Mar</strong>ch 2009 and further to0.18 per cent as on <strong>Apr</strong>il 4, 2009.During 2008-09, the combined finances of the Central and State Governments were adversely impacted due to theeconomic slowdown. The Central Government finances came under stress during 2008-09, both on the revenue and theexpenditure sides, on account of fiscal measures taken to reduce inflationary pressures during the first half and to arrestthe moderation of economic growth in the second half of the year. As a result, the key deficit indicators viz., revenuedeficit and fiscal deficit widened to 4.4 per cent and 6.0 per cent, respectively, in the revised estimates for 2008-09 from1.0 per cent and 2.5 per cent, respectively, in the budget estimates.India’s BoP position in 2008-09 (<strong>Apr</strong>il-December) wascharacterized by a widened trade deficit leading to a highercurrent account and lower net capital inflows. The merchandisetrade deficit further widened to US$ 113.8 billion during<strong>Apr</strong>il-February 2008-09 (US $ 82.2 billion a year ago). Thecurrent account deficit widened to a level of US$ 36.5 billion(US$ 15.5 billion in <strong>Apr</strong>il-December 2007).As on <strong>Apr</strong>il 10, 2009, the foreign exchange reserves stood atUS $ 253 billion, showing a decline of US$ 56.7 billion(including valuation) over the level at end-<strong>Mar</strong>ch 2008.Fixed Income <strong>Mar</strong>ketsThe financial year 2008-09 was characterized by a significantlyhigher level of Central Government market borrowing thanbudgeted earlier, particularly during the second half of the year,in order to finance the expanding fiscal deficit in the wake offiscal stimulus measures and various other committedexpenditure of the Government.This impact of high borrowing was reduced by followingmeasures:(i)synchronizing OMO (purchase of government securities)with issuances of dated securities under the marketborrowing calendar,1300012500120001150011000105001000095009000850080008.68.48.287.87.67.47.276.86.66.46.265.85.65.45.251-Jan1-Jan5-Jan5-Jan9- 13- 17- 21- 25- 29-Jan Jan Jan Jan Jan Jan9- 13- 17- 21- 25- 29-Jan Jan Jan Jan Jan JanBSE SENSEX - January - <strong>Mar</strong>ch,20092-Feb6- 10- 14- 18- 22- 26-Feb Feb Feb Feb Feb Feb10YR G-SEC YIELD - January - <strong>Mar</strong>ch,20092-Feb6- 10- 14- 18- 22- 26-Feb Feb Feb Feb Feb FebClose/Bid -9708.50Last-9708.50High 06/06/09 -10335.93Average -9155.83Low -8160.402- 6- 10- 14- 18- 22- 26- 30-<strong>Mar</strong> <strong>Mar</strong> <strong>Mar</strong> <strong>Mar</strong> <strong>Mar</strong> <strong>Mar</strong> <strong>Mar</strong> <strong>Mar</strong>Close/Bid -7.01Last- 7.01High - 7.10Average - 6.25Low - 5.092- 6- 10- 14- 18- 22- 26- 30-<strong>Mar</strong> <strong>Mar</strong> <strong>Mar</strong> <strong>Mar</strong> <strong>Mar</strong> <strong>Mar</strong> <strong>Mar</strong> <strong>Mar</strong>1
<strong>Annual</strong> Investment Report <strong>Mar</strong>ch, 2009.(ii)buyback of securities issued under the MSS,(iii) amending the MoU on MSS in February 2009, allowing transfer from the MSS cash account to the normal cashaccount of the Government of India for financing of fiscal deficit, and(iv) purchase of government securities from the secondary marketYields in the government securities market hardened during the 1st half on account of the heightened inflationaryexpectations in the face of sharp increase in global commodity prices and monetary policy responses – hikes in the CRRand the LAF repo rate. Yield reached the peak in September 2008 as liquidity conditions tightened in the wake of adversedevelopments in the international financial markets and advance tax outflows. Thereafter as a result sharp decline inWPI inflation along with easy monetary policy, the yields eased substantially till end-December 2008. The 10-year yieldstood at 5.31 per cent as at end-December 2008, as compared with 8.63 per cent as at end-September 2008 and 7.93 percent as at end-<strong>Mar</strong>ch 2008. <strong>Mar</strong>ket sentiment worsened in the last quarter following the large and abrupt increase in theGovernment’s market borrowing programme for 2008-09, at a time when the system had excess SLR investment amountingto around Rs.1,79,000 crore. The ten-year yield stood at 7.01 per cent as at end-<strong>Mar</strong>ch 2009.During 2008-09, the yield on 5-year AAA-rated corporate bonds, witnessed a hardening trend up to October 2008 andbegan to soften thereafter. The yield has been inching up again since February 2009. The spread was 179 basis points on<strong>Mar</strong>ch 31, 2009 as compared to 312 basis points on December 31, 2008.Equity <strong>Mar</strong>ketsThe year 2008-09 continued to be a dismal year for the stock markets. As a reflection of the economic and financial marketoutlook, the year was characterized by depressed equity valuations. Equity price indices in most advanced economies wererelatively flat during July and August 2008, but caught on the downward spiral subsequently. Beginning mid-September2008, the Indian financial markets came under pressure owing to the knock-on effects of the global crisis through themonetary, financial, real and confidence channels. Though emerging market economies, including India, do not have director significant exposure to stressed financial instruments or troubled financial institutions, they are not immune to theadverse effects of the financial crisis. With sharp tightening of global liquidity, Indian banks and corporate saw theiroverseas financing drying up. The losses continued during the first two months of 2009 were mainly due to the downwardtrend in international equity markets on account of more than expected contraction of economic growth in the US, the UK,Japan and China pointing towards deepening of recession. Other factors that led to weak equity markets were heavy netsales by FIIs in the Indian equity market, slowdown in industrial and export growth, depreciation of the rupee against theUS dollar, fall in ADR prices, lower than expected corporate earnings in the third quarter of 2008-09, revelations aboutfinancial irregularities in a particular information technology company and other sector and stock specific news.In line with the behaviour of equity markets across the world, the Indian stock markets have been showing improvementsince <strong>Mar</strong>ch 2009. The reasons for the improvement are announcement of the details of US$ 1 trillion public privateinvestment program by the US Treasury, some major US banks posting profits for the first two months of 2009, extention ofthe deadline for buyback of foreign currency convertible bonds (FCCBs) by the Reserve Bank to December 31, 2009,domestic consumer durable and capital goods output improving since January 2009, lower domestic inflation rate,strengthening of the rupee against the US dollar and net purchases by FIIs and mutual funds in domestic equity market.The BSE Sensex and the S&P CNX Nifty closed at 9709 and 3021 at end-<strong>Mar</strong>ch 2009 registering losses of 37.9 per centand 36.2 per cent, respectively, over end-<strong>Mar</strong>ch 2008Sectoral performance: Most of the sectors witnessed sharp selling pressures during the year. The sectors like metal,consumer durables, capital goods and banking underperformed the sensex with the first three sectors falling more than55%. The other sectors also fell but outperformed the broader indices mainly IT, oil and gas, auto, public sectorundertakings, healthcare and fast moving consumer goods sectorInstitutional volumes: Institutional volumes played an important role in determining market direction. V.61 According to thedata released by the Securities and Exchange Board of India (SEBI), FIIs made net sales of Rs.48,249 crore (US $ 12.0billion) in the Indian equity market during 2008-09 as against net purchases of Rs.52,574 crore (US $ 12.7 billion) during2007-08. Mutual funds, on the other hand, made net purchases of Rs.6,985 crore during 2008-09 as compared with netpurchases of Rs.15,775 crore in the previous year. The Indian equity markets have to a large extent has also beensupported by the flows from the <strong>Insurance</strong> companies.2
<strong>Annual</strong> Investment Report <strong>Mar</strong>ch, 2009.<strong>Fund</strong> FactsThe details are in the fund fact sheet which is attached.Fixed Income Strategy: We have kept the portfolio duration between 3 and 4 with exposure bias towards corporate debt.Wholesale Price Inflation continues to be near zero and economic growth as reflected by IIP continues to indicate slowdown, so RBI is expected to maintain easy monetary stance. The liquidity is abundant in the system. We plan to continuethe duration between 3-4 and concentrate on corporate securities (non SLR) as credit spread is attractive.Equity Strategy: Indian equity markets look attractive from a long term perspective. The current valuations are at fair levels.The fall in oil price and increased domestic production would reduce the risks for India and improve its longer termeconomic outlook. Despite the fall in the GDP growth rate, India would continue to be one of the fastest growingeconomies and this would draw a flow of capital, as when the risk appetite increases. However, with general elections andcorporate earnings season round the corner, we expect the markets to be volatile and a clear direction to emerge thereafter.We at <strong>Tata</strong> AIG follow a long-term strategy and believe that the opportunities provided by the dips will help us ingenerating wealth for our unit holders in the long run. We are quite positive about Indian economy and would recommendthat the unit holders stay invested over the long term (10 years or more) for wealth creation.RisksFixed IncomeThe key risks in the fixed income portfolio are:Credit Risk: Bonds / debentures as well as other money market instruments issued by corporate run the risk of downgrading by the rating agencies and even default as the worst case. Securities issued by Central/State governments havelesser to zero probability of credit/ default risk in view of the sovereign status of the issuer.To reduce risk of default we have the credit category allocation limit. With limit for maximum investment in eachrating category.All investments in corporate paper is with a minimum rating of AA and above.Liquidity Risk: The Indian debt market is such that a large percentage of the total traded volumes on particular days areconcentrated in a few securities. Traded volumes for particular securities differ significantly on a daily basis. Consequently,the fund may have to incur a significant “impact cost” while transacting large volumes in a particular security. The schemeswill invest a higher proportion in liquid and traded debt instruments including Government Securities. The fund’sinvestments are long term in nature and hence it is not required to maintain high level of liquidity. The fund keepssufficient liquidity to ensure that it can manage interest rate risk in a reasonable manner.Risk due to concentration: We diversify the portfolio to reduce the concentration risk. The initial list of investmentlines and concentration limits for single corporate credits is also well defined. Industry / Sector exposure will be restrictedat a % of the portfolioEquityThe key risks in the equity portfolio are:Risk of loss of value: Investments in equity and equity related securities involve a degree of risks and investors should notinvest in Equity Schemes unless they can afford to take the risk of losing their investment.Concentration Risk in equity:• In order to ensure, that the portfolio is well diversified and to mitigate the risk of concentration, exposure to a singlestock would be restricted to 10% of the value of the equity part of the portfolio at the time of purchase of the share.• The exposure to a single stock may exceed the 10% limit due to market appreciation. However, as a discipline, anystock crossing 15% of the total portfolio value due to price appreciation would trigger partial profit booking so as tobring down the weightage.• Exposure to a single sector cannot exceed 25% of the total value of the portfolio.Disclaimer: a) The views expressed are based on our own perception backed by adequate market research.b) The sources for the data are: RBI, BSE, NSE, Reuters.3
Pension Short-TermFixed Income <strong>Fund</strong><strong>Annual</strong> Investment Report <strong>Mar</strong>ch, 2009.Investment Objective: The primary objective is to generate Stable returns by investing in fixed income securities having maturitiesbetween 1 & 3 years.Nav Calculation: Daily<strong>Fund</strong> Manager: Mr. Vivek SoodPERFORMANCE - PENSION SHORT-TERM FIXED INCOME FUND(NAV [in Rs.] & CRISIL Short-Term Bond Index as on 31-<strong>Mar</strong>-09 was 11.5974 and 1541.8147 respectively)PERIOD DATE NAV CRISIL Short-Term Bond Index NAV Change INDEX ChangeLast 1 Month 27-Feb-09 11.5422 1539.7483 0.48% 0.13%Last 3 Months 31-Dec-08 11.2314 1513.0129 3.26% 1.90%Last 6 Months 30-Sep-08 10.7701 1441.3512 7.68% 6.97%Last 1 Year 31-<strong>Mar</strong>-08 10.5556 1404.3104 9.87% 9.79%Last 2 Year 31-<strong>Mar</strong>-07 10.0100 1290.6700 15.86% 19.46%Since Inception 3-Jul-06 10.0000 1242.3300 15.97% 24.11%Note: The investment income and prices may go down as well as up.RATING PROFILEASSET ALLOCATION0.72%6.60%5.21%0.72%87.47%87.47%6.60%5.21%Sovereign AAA P1+ Cash, Bank & OthersGovernment SecuritiesCD/CP'sCorporate BondsCash, Bank & OthersRATINGS% to NAVSovereign 0.72AAA 87.47P1+ 5.21Cash, Bank & Others 6.60TOTAL 100.00ASSET ALLOCATION % to NAVGovernment Securities 0.72Corporate Bonds 87.47CD/CP's 5.21Cash, Bank & Others 6.60NET ASSETS 100.00100.00%80.00%60.00%40.00%20.00%0.00%MATURITY PROFILELess than 1 Year1-3 YearsPORTFOLIOInstrumentRating % of NAVGovernment Securities 0.729.39% GOI 2011 Sovereign 0.72Corporate Bonds 87.478.40% EXIM Bank 2010 AAA 11.279.05% IDFC 2009 AAA 7.817.20% HDFC 2010 AAA 3.338.60% IDFC 2011 AAA 24.809.45% LIC Housing 2012 AAA 40.26CD/CP's 5.21Canara Bank 2009 - CD P1+ 5.21Cash, Bank & Others 6.60Cash, Bank & Others 6.60NET ASSETS 100.005
Pension Income <strong>Fund</strong><strong>Annual</strong> Investment Report <strong>Mar</strong>ch, 2009.Investment Objective: To provide long-term capital appreciation by investing in high credit quality fixed income instruments. Stabilityof return and protection of principal over a long term investment horizon will be the prime driver for investment management.Nav Calculation: Daily<strong>Fund</strong> Manager: Mr. Vivek SoodPERFORMANCE - PENSION INCOME FUND(NAV [in Rs.] & Crisil Composite Bond <strong>Fund</strong> Index as on 31-<strong>Mar</strong>-09 was 12.9832 and 1505.3334 respectively)PERIOD DATE NAV Crisil Composite Bond <strong>Fund</strong> Index NAV Change INDEX ChangeLast 1 Month 27-Feb-09 12.9730 1510.3766 0.08% -0.33%Last 3 Months 31-Dec-08 12.8734 1513.4928 0.85% -0.54%Last 6 Months 30-Sep-08 11.8655 1403.1488 9.42% 7.28%Last 1 Year 31-<strong>Mar</strong>-08 11.8263 1402.2095 9.78% 7.35%Last 2 Year 31-<strong>Mar</strong>-07 10.7897 1295.7000 20.33% 16.18%Last 3 Year 31-<strong>Mar</strong>-06 10.2710 1248.8700 26.41% 20.54%Since Inception 2-<strong>Mar</strong>-04 10.0000 1193.2000 29.83% 26.16%Note: The investment income and prices may go down as well as up.RATING PROFILEMATURITY PROFILE11.31%74.76%40.00%30.00%20.00%10.00%13.93%Sovereign AAA Cash, Bank & Others0.00%Less than 1Year1-3 Years 3-6 Years More than 6YearsRATINGS% to NAVSovereign 11.31AAA 74.76Cash, Bank & Others 13.93TOTAL 100.0074.76%ASSET ALLOCATIONGovernment SecuritiesCash, Bank & Others11.31%Corporate BondsASSET ALLOCATION % to NAVGovernment Securities 11.31Corporate Bonds 74.76Cash, Bank & Others 13.93NET ASSETS 100.0013.93%PORTFOLIOInstrumentRating% of NAVGovernment Securities 11.319.39% GOI 2011 Sovereign 2.427.38% GOI 2015 Sovereign 0.807.46% GOI 2017 Sovereign 2.956.05% GOI 2019 Sovereign 5.14Corporate Bonds 74.769.10% HDFC 2009 AAA 1.169.15% LIC 2010 AAA 2.958.50% Exim Bank 2011 AAA 1.177.00% PFC 2011 AAA 2.889.80% PFC 2012 AAA 4.249.85% RECL 2017 AAA 2.418.55% HDFC 2009 AAA 3.4910.00% HDFC 2010 AAA 2.6010.20% IDFC 2010 AAA 11.869.35% ILFS 2010 AAA 3.5510.95% RECL 2011 AAA 3.089.20% L&T 2012 AAA 2.3710.00% IDFC 2012 AAA 4.257.20% RECL 2012 AAA 3.379.20% Power Grid 2013 AAA 2.379.45% REC 2013 AAA 2.3910.75% RECL 2013 AAA 3.749.50% Exim Bank 2013 AAA 2.408.95% IDFC 2018 AAA 1.1511.00% PFC 2018 AAA 3.2310.75% Reliance Industries 2018 AAA 7.65National Housing Bank 2018 AAA 0.748.65% Indian Railway Fin Corp 2024 AAA 1.70Cash, Bank & Others 13.93NET ASSETS 100.006
Pension Equity <strong>Fund</strong><strong>Annual</strong> Investment Report <strong>Mar</strong>ch, 2009.Investment Objective: To deliver medium to long-term capital appreciation through a portfolio essentially comprising of large capstocks that can perform well through market and economic cycles.Nav Calculation: Daily<strong>Fund</strong> Manager: Mr. Vivek SoodPERFORMANCE - PENSION EQUITY FUND (NAV [in Rs.] & BSE SENSEX as on 31-<strong>Mar</strong>-09 was 16.9416 and 9708.50 respectively)PERIOD DATE NAV BSE Sensex NAV Change INDEX ChangeLast 1 Month 27-Feb-09 15.6199 8891.61 8.46% 9.19%Last 3 Months 31-Dec-08 17.7374 9647.31 -4.49% 0.63%Last 6 Months 30-Sep-08 23.5470 12860.43 -28.05% -24.51%Last 1 Year 31-<strong>Mar</strong>-08 30.4802 15644.44 -44.42% -37.94%Last 2 Year 31-<strong>Mar</strong>-07 23.9998 13072.10 -29.41% -25.73%Last 3 Year 31-<strong>Mar</strong>-06 21.2517 11279.96 -20.28% -13.93%Since Inception 29-<strong>Mar</strong>-04 10.0000 5571.37 69.42% 74.26%Note: The investment income and prices may go down as well as up.SECTOR STRATEGYSector% to NAVAuto Ancillaries 1.62Banks 20.56Cigarettes 4.87Computers - Software 2.74Construction 3.98Distilleries 0.94Diversified 2.73Electric Equipment 4.11Engineering 4.49Entertainment 1.35Fertilizers 1.03Finance 2.74Finance & Investments 1.53Metal 2.36Offshore drilling 0.35Paints 1.39Petroleum 1.08Pharmaceuticals 5.14Power Generation & supply 1.73Refineries 12.05Telecommunications 5.98Transformers 0.33Cash, Bank & Others 16.91Total 100.00%2.36%1.53%2.74%1.03%1.35%4.49%4.11%2.73%0.94%3.98%Auto AncillariesCigarettesConstructionDiversifiedEngineeringFertilizers16.91%SECTOR-WISE BREAK-UP0.35% 1.39% 1.08% 5.14%2.74%4.87%Finance & InvestmentsOffshore drillingPetroleumPower Generation & supplyTelecommunicationsCash, Bank & Others20.56%ASSET ALLOCATIONAsset Allocation1.73%BanksComputers - SoftwareDistilleriesElectric EquipmentEntertainmentFinance12.05%5.98%0.33%16.91%1.62%MetalPaintsPharmaceuticalsRefineriesTransformersPORTFOLIOInstrumentIndustry% of NAVEquity 83.09Aban Offshore Ltd. Offshore drilling 0.35Action Construction Equipments Ltd. Construction 0.14Alstom Projects India Ltd. Engineering 0.83Areva T&D India Ltd. Electric Equipment 1.04Asian Paints (India) Ltd. Paints 1.39Axis Bank Ltd. Banks 2.19Bank Of Baroda Ltd. Banks 1.82Bharat Heavy Electricals Ltd. Electric Equipment 1.24Bharti Airtel Ltd. Telecommunications 5.98Cesc Ltd. Power Generation & supply 1.73Crompton Greaves Ltd. Electric Equipment 1.82Dishman Pharmaceuticals & Chemicals Ltd. Pharmaceuticals 0.80Dlf Ltd. Construction 0.55Elecon Engineering Co Ltd. Engineering 0.41Emco Ltd. Transformers 0.33Exide Industries Ltd. Auto Ancillaries 1.62Glenmark Pharmaceuticals Ltd. Pharmaceuticals 0.46Gujarat State Petronet Ltd. Petroleum 1.08Hindustan Construction Co Ltd. Construction 0.52Hindustan Unilever Ltd. Diversified 0.78HDFC Bank Banks 5.39HDFC Ltd. Finance 1.72ICICI Bank Ltd. Banks 2.41Infosys Technologies Ltd. Computers - Software 2.74Infrastructure Dev Fin Co Ltd. Finance & Investments 1.53ITC Ltd. Cigarettes 4.87Ivrcl Infrastructures & Projects Ltd. Construction 1.00Larsen And Toubro Ltd. Engineering 2.88LIC Housing Finance Ltd. Finance 1.02Mcnally Bharat Engineering Co Ltd. Engineering 0.38Oil & Natural Gas Corp Ltd. Refineries 3.34Oriental Bank Of Commerce Banks 0.95Piramal Healthcare Limited Pharmaceuticals 0.94Punj Lloyd Ltd. Construction 1.07Punjab National Bank Banks 3.60Reliance Industries Ltd. Refineries 8.71Simplex Infrastructures Ltd. Construction 0.70Sintex Industries Ltd. Diversified 0.85State Bank Of India Banks 2.46Sterlite Industries (India) Ltd. Metal 2.36Sun Pharmaceutical Industries Ltd. Pharmaceuticals 2.93<strong>Tata</strong> Chemicals Ltd. Fertilizers 1.03Union Bank Of India Ltd. Banks 1.74United Spirits Ltd. Distilleries 0.94Voltas Limited Diversified 1.09Zee News Ltd. Entertainment 1.35Cash, Bank & Others 16.91TOTAL 100.00EquityCash, Bank & Others83.09%ASSET ALLOCATION% to NAVEquity 83.09Cash, Bank & Others 16.91NET ASSETS 100.007
Pension Liquid <strong>Fund</strong><strong>Annual</strong> Investment Report <strong>Mar</strong>ch, 2009.Investment Objective: To provide safety of funds, liquidity and return on investments, in that order.Nav Calculation: Daily<strong>Fund</strong> Manager: Mr. Vivek SoodPERFORMANCE- PENSION LIQUID FUND(NAV [in Rs.] & Crisil Liquid <strong>Fund</strong> Index as on 31-<strong>Mar</strong>-09 was 13.4249 and 1504.63 respectively)PERIOD DATE NAV Crisil Liquid <strong>Fund</strong> Index NAV Change INDEX ChangeLast 1 Month 27-Feb-09 13.3379 1496.11 0.65% 0.57%Last 3 Months 31-Dec-08 13.1721 1474.26 1.92% 2.06%Last 6 Months 30-Sep-08 12.9122 1437.57 3.97% 4.66%Last 1 Year 31-<strong>Mar</strong>-08 12.4025 1382.85 8.24% 8.81%Last 2 Year 31-<strong>Mar</strong>-07 11.3571 1286.95 18.21% 16.91%Last 3 Year 31-<strong>Mar</strong>-06 10.6968 1208.82 25.50% 24.47%Since inception 25-May-04 10.0000 1113.63 34.25% 35.11%Note: The investment income and prices may go down as well as up.RATING PROFILE2.55%2.55%ASSET ALLOCATION97.45%97.45%P1+ Cash, Bank & OthersCD/CP'sCash, Bank & OthersRATINGS% to NAVP1+ 97.45Cash, Bank & Others 2.55NET ASSETS 100.00ASSET ALLOCATION % to NAVCD/CP's 97.45Cash, Bank & Others 2.55NET ASSETS 100.00100.00%80.00%60.00%40.00%20.00%0.00%MATURITY PROFILEMaturity ProfileLess than 1 YearPORTFOLIOInstrumentRating % of NAVCD/CP's 97.45Corparation Bank 2010 - CD P1+ 36.95Canara Bank 2010 - CD P1+ 25.75National Housing Bank 2009 - CP P1+ 2.96PFC Ltd. 2009 - CP P1+ 31.80Cash, Bank & Others 2.55NET ASSETS 100.008
Pension Balanced <strong>Fund</strong><strong>Annual</strong> Investment Report <strong>Mar</strong>ch, 2009.Investment Objective: To supplement the income generation from the fixed income instruments with capital appreciation of theequity assets.NAV Calculation: Daily<strong>Fund</strong> Manager: Mr. Vivek SoodPERFORMANCE - PENSION BALANCED FUND (NAV [in Rs.] as on 31-<strong>Mar</strong>-09 is 10.7789)PERIOD DATE NAV NAV Change INDEX ChangeLast 1 Month 27-Feb-09 10.7172 0.58% 0.63%Last 3 Months 31-Dec-08 10.5865 1.82% -0.28%Last 6 Months 30-Sep-08 10.0479 7.28% 4.26%Last 1 Year 31-<strong>Mar</strong>-08 10.2768 4.89% 3.00%Since Inception 17-Aug-07 10.0000 7.79% 8.49%Note: The investment income and prices may go down as well as up.PORTFOLIOInstrumentRating% of NAVEquity 3.03Aban Offshore Ltd. Offshore drilling 0.01ABB Ltd. Electric Equipment 0.04Areva T&D India Ltd. Electric Equipment 0.10Asian Paints (India) Ltd. Paints 0.06Axis Bank Ltd. Banks 0.10Bank Of Baroda Ltd. Banks 0.06Bharat Heavy Electricals Ltd. Electric Equipment 0.18Bharti Airtel Ltd. Telecommunications 0.19Cesc Ltd. Power Generation & supply 0.07Crompton Greaves Ltd. Electric Equipment 0.07Exide Industries Ltd. Auto Ancillaries 0.07Gujarat Nre Coke Ltd. Metallurgical Coke 0.01Hindustan Construction Co Ltd. Construction 0.01HDFC Bank Banks 0.17HDFC Ltd. Finance 0.14ICICI Bank Ltd. Banks 0.15Infosys Technologies Ltd. Computers - Software 0.09Infrastructure Dev Fin Co Ltd. Finance & Investments 0.06ITC Ltd. Cigarettes 0.13Ivrcl Infrastructures & Projects Ltd. Construction 0.06Jaiprakash Associates Ltd. Construction 0.03Larsen And Toubro Ltd. Engineering 0.16Mahindra And Mahindra Ltd. Automobiles 0.02Ntpc Ltd. Power Generation & supply 0.04Oil & Natural Gas Corp Ltd. Refineries 0.17Oriental Bank Of Commerce Banks 0.03Punj Lloyd Ltd. Construction 0.07Punjab National Bank Banks 0.04Reliance Industries Ltd. Refineries 0.34Reliance Petroleum Ltd. Petroleum 0.05Siemens India Ltd. Electronics 0.01Sintex Industries Ltd. Diversified 0.05State Bank Of India Banks 0.13Sun Pharmaceutical Industries Ltd. Pharmaceuticals 0.09Television Eighteen India Ltd. Entertainment 0.01Thermax Limited Engineering 0.01Zee News Ltd. Entertainment 0.03Corporate Bonds 91.119.10% HDFC 2009 AAA 3.589.80% PFC 2012 AAA 6.249.05% IDFC 2009 AAA 14.309.68% IRFC 2010 AAA 1.229.20% HDFC 2012 AAA 30.5710.00% PFC 2012 AAA 1.258.83% IRFC 2012 AAA 2.449.20% Power Grid 2015 AAA 24.428.95% IDFC 2018 AAA 7.08Cash, Bank & Others 5.87Net Assets 100.0091.11%SECTOR STRATEGYSectorAuto Ancillaries 0.07Automobiles 0.02Banks 0.67Cigarettes 0.13Computers - Software 0.09Construction 0.16Diversified 0.05Electric Equipment 0.39Electronics 0.01Engineering 0.17Entertainment 0.04Finance 0.14ASSET ALLOCATION % of NAVEquity 3.03Corporate Bonds 91.11Cash, Bank & Others 5.87Net Assets 100.00SECTOR-WISE BREAK-UP0.19%0.51%0.11%0.09%0.05%Auto Ancillaries Automobiles Banks0.06%Cigarettes Computers - Software ConstructionDiversified Electric Equipment ElectronicsEngineering Entertainment FinanceFinance & Investments Metallurgical Coke Offshore drillingPaints Petroleum Pharmaceuticals0.01%0.01%Power Generation & supply Refineries TelecommunicationsCorporate BondsCash, Bank & Others5.87%% to NAV SectorASSET ALLOCATION91.11%3.03%0.04%0.39%0.14%0.06%0.02%0.67%0.13%0.09%0.16%0.05%0.01%0.07%0.17%% to NAVFinance & Investments 0.06Metallurgical Coke 0.01Offshore drilling 0.01Paints 0.06Petroleum 0.05Pharmaceuticals 0.09Power Generation & supply 0.11Refineries 0.51Telecommunications 0.19Corporate Bonds 91.11Cash, Bank & Others 5.87Total 100.005.87%Equity Corporate Bonds Cash, Bank & Others9
Pension Bond <strong>Fund</strong><strong>Annual</strong> Investment Report <strong>Mar</strong>ch, 2009.Investment Objective: To generate income through investing in a range of debt and money market instruments of various maturitieswith a view to maximizing the optimal balance between yield, safety and liquidity.NAV Calculation: Daily<strong>Fund</strong> Manager: Mr. Vivek SoodPERFORMANCE - PENSION BOND FUND(NAV [in Rs.] & CRISIL Composite Bond <strong>Fund</strong> Index as on 31-<strong>Mar</strong>-09 is 11.0594 and 1505.3334 respectively)PERIOD DATE NAV CRISIL Composite Bond <strong>Fund</strong> Index NAV Change INDEX ChangeLast 1 Month 27-Feb-09 11.1387 1510.3766 -0.71% -0.33%Last 3 Months 31-Dec-08 11.2140 1513.4928 -1.38% -0.54%Last 6 Months 30-Sep-08 10.3277 1403.1488 7.08% 7.28%Last 1 Year 31-<strong>Mar</strong>-08 10.3415 1402.2095 6.94% 7.35%Since Inception 17-Aug-07 10.0000 1339.5321 10.59% 12.38%Note: The investment income and prices may go down as well as up.16.20%4.73%30.11%RATING PROFILEASSET ALLOCATION16.20%4.73%30.11%48.95%Sovereign AAA P1+ Cash, Bank & OthersPORTFOLIOInstrumentRating % of NAVGovernment Securities 30.117.00% GOI 2012 Sovereign 2.517.46% GOI 2017 Sovereign 3.406.05% GOI 2019 Sovereign 24.20Corporate Bonds 48.959.05% IDFC 2009 AAA 2.008.80% IDFC 2009 AAA 1.689.05% IDFC 2010 AAA 3.0611.75%Rural Electric Corp Ltd. 2011 AAA 3.619.20% Larsen & Toubro 2012 AAA 1.716.98% IRFC 2012 AAA 2.2810.00% PFC 2012 AAA 8.419.50% HDFC 2013 AAA 7.249.20% Power Grid 2013 AAA 5.139.50% Exim Bank 2013 AAA 5.2010.75% Reliance Industries 2018 AAA 3.68National Housing Bank 2018 AAA 2.508.65% IRFC 2024 AAA 2.45CD/CP's 4.73Corporation Bank 2010 - CD P1+ 4.73Cash, Bank & Others 16.20Net Assets 100.0048.95%Government SecuritiesCD/CP'sCorporate BondsCash, Bank & OthersMATURITY PROFILE50.00%RATING% to NAVSovereign 30.11AAA 48.95P1+ 4.73Cash, Bank & Others 16.20Total 100.00ASSET ALLOCATION % to NAVGovernment Securities 30.11Corporate Bonds 48.95CD/CP's 4.73Cash, Bank & Others 16.20Net Assets 100.0040.00%30.00%20.00%10.00%0.00%Less than 1Year1-3 Years 3-6 Years More Than 6Years10
Pension Growth <strong>Fund</strong><strong>Annual</strong> Investment Report <strong>Mar</strong>ch, 2009.Investment Objective: The objective of this <strong>Fund</strong> is to generate long term capital appreciation and income by investing a considerablepercentage of the fund in equity and equity linked instruments and the balance in Government Bonds and high quality fixedincome instruments.NAV Calculation: Daily<strong>Fund</strong> Manager: Mr. Vivek SoodPERFORMANCE - PENSION GROWTH FUND (NAV [in Rs.] as on 31-<strong>Mar</strong>-09 is 9.8840)PERIOD DATE NAV NAV Change INDEX ChangeLast 1 Month 27-Feb-09 9.6828 2.08% 2.56%Last 3 Months 31-Dec-08 9.7892 0.97% 0.25%Last 6 Months 30-Sep-08 9.9641 -0.80% -1.79%Last 1 Year 31-<strong>Mar</strong>-08 9.9819 -0.98% -5.71%Since Inception 17-Aug-07 10.0000 -1.16% 0.73%Note: The investment income and prices may go down as well as up.62.22%SECTOR WISE BREAK UP1.37%3.48%4.55%10.76%1.50%1.37%0.48%0.52%0.47%5.43%0.67%Auto Ancillaries Banks CigarettesComputers - Software Construction DiversifiedElectric Equipment Engineering FinanceFinance & Investments Gas distribution MetalPersonal Care Petroleum PharmaceuticalsASSET ALLOCATION1.16%Power Generation & supply Refineries TelecommunicationsGovernment Securities Corporate Bonds Cash, Bank & Others10.76%EquityCorporate BondsAsset Allocation62.22%22.47%Government SecuritiesCash, Bank & Others1.03%0.19%0.75%1.37%0.63%1.45%0.30%0.29%4.55%SECTOR STRATEGY% to NAVAuto Ancillaries 0.48Banks 5.43Cigarettes 1.16Computers - Software 1.03Construction 0.19Diversified 0.75Electric Equipment 1.37Engineering 0.63Finance 1.45Finance & Investments 0.30Gas distribution 0.29Metal 0.67Personal Care 0.47Petroleum 0.52Pharmaceuticals 1.37Power Generation & supply 1.50Refineries 3.48Telecommunications 1.37Government Securities 4.55Corporate Bonds 62.22Cash, Bank & Others 10.76Total 100.00ASSET ALLOCATION % to NAVEquity 22.47Government Securities 4.55Corporate Bonds 62.22Cash, Bank & Others 10.76Net Assets 100.00PORTFOLIOInstrumentIndustry% of NAVEquity 22.47ABB Ltd. Electric Equipment 0.20Axis Bank Ltd. Banks 0.65Bharat Heavy Electricals Ltd. Electric Equipment 0.59Bharti Airtel Ltd. Telecommunications 1.37Cesc Ltd. Power Generation & supply 0.66Crompton Greaves Ltd. Electric Equipment 0.58Dishman Pharmaceuticals& Chemicals Ltd. Pharmaceuticals 0.31Exide Industries Ltd. Auto Ancillaries 0.48Gail India Ltd. Gas distribution 0.29Glenmark Pharmaceuticals Ltd. Pharmaceuticals 0.37Hindustan Unilever Ltd. Diversified 0.37HDFC Bank Banks 1.52HDFC Ltd. Finance 0.66ICICI Bank Ltd. Banks 0.86Infosys Technologies Ltd. Computers - Software 1.03Infrastructure Dev Fin Co Ltd. Finance & Investments 0.30ITC Ltd. Cigarettes 1.16Ivrcl Infrastructures & Projects Ltd. Construction 0.19Larsen And Toubro Ltd. Engineering 0.63<strong>Mar</strong>ico Ltd. Personal Care 0.47Ntpc Ltd. Power Generation & supply 0.84Oil & Natural Gas Corp Ltd. Refineries 0.98Oriental Bank Of Commerce Banks 0.52Power Finance Corp Ltd. Finance 0.79Punjab National Bank Banks 0.80Reliance Industries Ltd. Refineries 2.50Reliance Petroleum Ltd. Petroleum 0.52Sintex Industries Ltd. Diversified 0.38State Bank Of India Banks 1.08Sterlite Industries (India) Ltd. Metal 0.67Sun Pharmaceutical Industries Ltd. Pharmaceuticals 0.69Government Securities 4.559.39% GOI 2011 Sovereign 4.55Corporate Bonds 62.228.40% Exim Bank 2010 AAA 15.737.20% HDFC 2010 AAA 46.49Cash, Bank & Others 10.76Net Assets 100.0011
Disclaimer<strong>Annual</strong> Investment Report <strong>Mar</strong>ch, 2009.Disclaimers:1. The fund is managed by <strong>Tata</strong> AIG <strong>Life</strong> <strong>Insurance</strong> Company Ltd. (hereinafter the "Company").2. Past performance is not indicative of future results. Returns are calculated on an absolute basis for a period of less than(or equal to) a year, with reinvestment of dividends (if any).3. All investments made by the Company are subject to market risks. The Company does not guarantee any assured returns.The investment income and price may go down as well as up depending on several factors influencing the market.4. Every effort is made to ensure that all information contained in this publication is accurate at the date of publication, but noresponsibility or liability in respect of any error or omission is accepted by the Company.5. Tax benefits are as per the Income Tax Act, 1961 and are subject to amendments made therein from time to time.6. This material belongs to <strong>Tata</strong> AIG <strong>Life</strong> <strong>Insurance</strong> Company Ltd. Any unauthorised use, reprint or circulation is prohibited.7. Please know the associated risks and the applicable charges from your <strong>Insurance</strong> agent or the intermediary or policy documentof the insurer.8. Various funds offered under this contract are the names of funds and do not, in any way, indicate the quality of the plans, theirfuture prospects & returns.9. Premium paid in ULIPs are subject to Investment risks associated with capital markets & the NAV of the units may go up ordown based on the performance of the fund and factors influencing capital markets & the insured is responsible forhis/her decision.10. ULIP products are different from traditional <strong>Life</strong> <strong>Insurance</strong> products and are subject to risk factors.11. <strong>Tata</strong> AIG <strong>Life</strong> <strong>Insurance</strong> Company Limited is only the name of insurance company and i. Pension Short-term Fixed Income,ii. Pension Income, iii. Pension Equity, iv. Pension Liquid, v. Pension Balanced, vi. Pension Bond, vii. Pension Growth, are onlythe names of the funds and does not in any way indicate the quality of the contracts, its future prospects or returns.<strong>Tata</strong> AIG <strong>Life</strong> <strong>Insurance</strong> Company Ltd. (Regn. No. 110)Registered and Corporate Office: Peninsula Towers, 6th Floor, Peninsula Corporate ParkGanpatrao Kadam <strong>Mar</strong>g, Lower Parel, Mumbai - 400 013.<strong>Insurance</strong> is the subject matter of the solicitationUnique Reference No.: L&C/Advt/2009/Jun/54312


