Traffic Safety Facts: 2008 Data Pedestrians - National Highway ...
Traffic Safety Facts: 2008 Data Pedestrians - National Highway ...
Traffic Safety Facts: 2008 Data Pedestrians - National Highway ...

You also want an ePaper? Increase the reach of your titles
YUMPU automatically turns print PDFs into web optimized ePapers that Google loves.
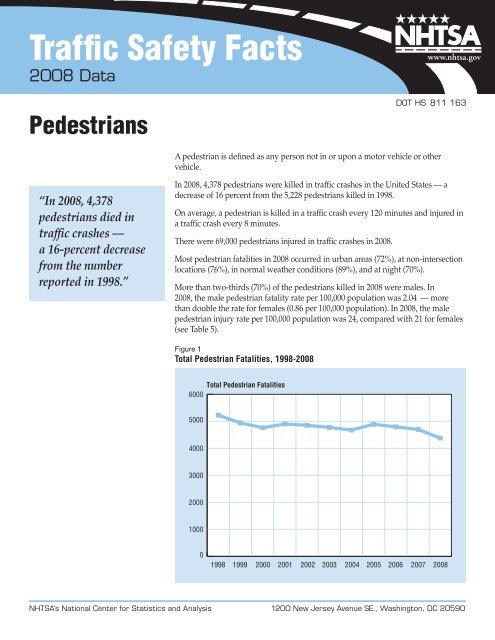
Age<strong>Pedestrians</strong> (age 65+) accounted for 18 percent (803) of all pedestrian fatalities andan estimated 10 percent (7,000) of all pedestrians injured in <strong>2008</strong>.“In <strong>2008</strong>, the fatality rate for pedestrians (age 65+) was 2.07 per 100,000 population– higher than for any other age group.”“In <strong>2008</strong>, nearly onefifthof the childrenbetween the agesof 5 and 9 killed intraffic crashes werepedestrians.”In <strong>2008</strong>, one-fifth (20%) of all children between the ages of 5 and 9 who were killedin traffic crashes were pedestrians. Children age 15 and younger accounted for 7percent of the pedestrian fatalities in <strong>2008</strong> and 22 percent of all pedestrians injuredin traffic crashes.Table 1<strong>Pedestrians</strong> Killed and Injured by Age Group, <strong>2008</strong>Age Group (Years) Total Killed <strong>Pedestrians</strong> KilledPercentage ofTotal Killed
Table Nonoccupant <strong>Traffic</strong> Fatalities, 1998-<strong>2008</strong>Year Pedestrian Pedalcyclist Other Total1998 5,228 760 131 6,1191999 4,939 754 149 5,8422000 4,763 693 141 5,5972001 4,901 732 123 5,7562002 4,851 665 114 5,6302003 4,774 629 140 5,5432004 4,675 727 130 5,5322005 4,892 786 186 5,8642006 4,795 772 185 5,7522007 4,699 701 158 5,558<strong>2008</strong> 4,378 716 188 5,282Pedestrian fatalities accounted for 83 percent of all nonoccupant fatalities in <strong>2008</strong>.The 716 pedalcyclist fatalities accounted for 14 percent, and the remaining4 percent were skateboard riders, roller skaters, etc.Time of Day and Day of WeekThirty-eight percent of the 316 young (under age 16) pedestrian fatalities occurred incrashes between 3 p.m. and 7 p.m.“Thirty-eight percent ofall young (under age 16)pedestrian fatalitiesoccurred between3 p.m. and 7 p.m.”Nearly one-half (48%) of all pedestrian fatalities occurred on Friday, Saturday, andSunday (16%, 18%, and 14%, respectively).Figure Pedestrian Fatalities by Time of Day and Day of Week, <strong>2008</strong>Midnight - 3:59 a.m.4 a.m. - 7:59 a.m.8 a.m. - 11:59 a.m.Noon - 3:59 p.m.4 p.m. - 7:59 p.m.8 p.m. - 11:59 p.m.Time of Day3%5%10%9%12%8%9%11%12%16%15%Percentage of Total Pedestrian Fatalities25%21%24%25%27%Day of Week:WeekdayWeekendTotal30%37%Important <strong>Safety</strong> Remindersn Drivers are required to yield theright-of-way to pedestrians crossingstreets in marked or unmarkedcrosswalks in most situations.Pedestrian need to be especiallycareful at intersections where thefailure to yield right-of-way oftenoccurs when drivers are turningonto another street and a pedestrianis in their path.n When possible, cross the street at adesignated crosswalk. Always stopand look left, right, and left againbefore crossing. If a parked vehicleis blocking the view of the street,stop at the edge line of the vehicleand look around it before enteringthe street.n Increase visibility at night bycarrying a flashlight when walkingand by wearing retro-reflectiveclothing that helps to highlightbody movement.n It is much safer to walk on asidewalk, but if you must walk inthe street, walk facing traffic.NHTSA’s <strong>National</strong> Center for Statistics and Analysis 1200 New Jersey Avenue SE., Washington, DC 20590
“Alcohol involvement— either for the driveror the pedestrian— was reportedin 48 percent of allpedestrian fatalities.”Alcohol InvolvementAlcohol involvement — either for the driver or for the pedestrian — was reportedin 48 percent of the traffic crashes that resulted in pedestrian fatalities. Of thepedestrians involved, 36 percent had a blood alcohol concentration (BAC) of .08grams per deciliter (g/dL) or higher. Of the drivers involved in fatal crashes, only13 percent had a BAC of .08 g/dL or higher, less than one-half the rate for thepedestrians. In 6 percent of the crashes, both the driver and the pedestrian had aBAC of .08 g/dL or higher.Table Alcohol Involvement in Fatal Pedestrian Crashes, <strong>2008</strong>No Driver Driver Alcohol Driver AlcoholAlcohol Involvement, Involvement,Involvement BAC=.01–.07 BAC=.08+ TotalNo PedestrianAlcohol 2,216 52% 94 2% 274 6% 2,584 60%InvolvementPedestrian AlcoholInvolvement, 140 3% 8 0% 26 1% 174 4%BAC = .01–.07Pedestrian Alcohol1,184Involvement,28% 91 2% 269 6% 1,545 36%BAC = .08+Total 3,540 82% 193 4% 569 13% 4,302 100%Note: The alcohol levels in this table are determined using the alcohol levels of the involved pedestrian fatalities andall the involved drivers (fatality and other)Table Alcohol Involvement for <strong>Pedestrians</strong> Killed in Fatal Crashes by Age, 1998 and <strong>2008</strong>1998 <strong>2008</strong>Age(Years)Number ofFatalities% WithBAC=.00% WithBAC=.01–.07% WithBAC=.08+% WithBAC=.01+Number ofFatalities% WithBAC=.00% WithBAC=.01–.07% WithBAC=.08+% WithBAC=.01+16-20 301 65 6 29 35 286 66 4 30 3421-24 255 41 7 52 59 272 43 4 53 5725-34 676 43 6 51 57 580 46 5 49 5435-44 938 40 7 53 60 670 45 4 51 5545-54 729 48 6 45 52 872 49 5 47 5155-64 522 65 4 31 35 547 61 5 35 3965-74 462 80 4 16 20 360 82 5 13 1875-84 530 88 4 8 12 297 92 3 6 885 +Total*1844,5979258*Excludes pedestrians under 16 years old and pedestrians of unknown age.157378421464,030965824238442NHTSA’s <strong>National</strong> Center for Statistics and Analysis 1200 New Jersey Avenue SE., Washington, DC 20590
Table 5<strong>Pedestrians</strong> Killed and Injured and Fatality and Injury Rates by Age and Sex, <strong>2008</strong>Male Female TotalAge(Years) KilledPopulation(thousands)FatalityRate* KilledPopulation(thousands)FatalityRate* Killed**Population(thousands)FatalityRate*
Table Pedestrian <strong>Traffic</strong> Fatalities and Fatality Rates by State, <strong>2008</strong>StateTotal <strong>Traffic</strong> FatalitiesResident Population(thousands) Pedestrian Fatalities Percent of TotalPedestrian Fatalities per100,000 PopulationAlabama 966 4,662 66 6.8 1.42Alaska 62 686 3 4.8 0.44Arizona 937 6,500 120 12.8 1.85Arkansas 600 2,855 45 7.5 1.58California 3,434 36,757 620 18.1 1.69Colorado 548 4,939 44 8.0 0.89Connecticut 264 3,501 37 14.0 1.06Delaware 121 873 21 17.4 2.41Dist of Columbia 34 592 9 26.5 1.52Florida 2,978 18,328 490 16.5 2.67Georgia 1,493 9,686 146 9.8 1.51Hawaii 107 1,288 20 18.7 1.55Idaho 232 1,524 11 4.7 0.72Illinois 1,043 12,902 135 12.9 1.05Indiana 814 6,377 54 6.6 0.85Iowa 412 3,003 17 4.1 0.57Kansas 385 2,802 19 4.9 0.68Kentucky 826 4,269 67 8.1 1.57Louisiana 912 4,411 106 11.6 2.40Maine 155 1,316 12 7.7 0.91Maryland 591 5,634 116 19.6 2.06Massachusetts 363 6,498 75 20.7 1.15Michigan 980 10,003 114 11.6 1.14Minnesota 456 5,220 26 5.7 0.50Mississippi 783 2,939 50 6.4 1.70Missouri 960 5,912 63 6.6 1.07Montana 229 967 11 4.8 1.14Nebraska 208 1,783 5 2.4 0.28Nevada 324 2,600 56 17.3 2.15New Hampshire139 1,316 7 5.0 0.53New Jersey590 8,683 135 22.9 1.55New Mexico 366 1,984 39 10.7 1.97New York 1,231 19,490 294 23.9 1.51North Carolina 1,433 9,222 160 11.2 1.73North Dakota 104 641 6 5.8 0.94Ohio 1,190 11,486 98 8.2 0.85Oklahoma 749 3,642 51 6.8 1.40Oregon 416 3,790 51 12.3 1.35Pennsylvania 1,468 12,448 137 9.3 1.10Rhode Island 65 1,051 12 18.5 1.14South Carolina 920 4,480 100 10.9 2.23South Dakota 119 804 9 7.6 1.12Tennessee 1,035 6,215 60 5.8 0.97Texas 3,382 24,327 416 12.3 1.71Utah 275 2,736 32 11.6 1.17Vermont 73 621 1 1.4 0.16Virginia 824 7,769 76 9.2 0.98Washington 521 6,549 63 12.1 0.96West Virginia 380 1,814 13 3.4 0.72Wisconsin 605 5,628 53 8.8 0.94WyomingU.S. Total15937,261533304,06074,3784.411.71.311.44Puerto Rico 399 3,954 127 31.8 3.21*Totals may not equal sum of components due to independent rounding.Sources: Fatalities — Fatality Analysis Reporting System, NHTSA. Population — Bureau of the Census.NHTSA’s <strong>National</strong> Center for Statistics and Analysis 1200 New Jersey Avenue SE., Washington, DC 20590