E N S W - United Nations Development Programme
E N S W - United Nations Development Programme
E N S W - United Nations Development Programme

Create successful ePaper yourself
Turn your PDF publications into a flip-book with our unique Google optimized e-Paper software.
WNSESummaryHuman <strong>Development</strong>Report 2013The Rise of the South:Human Progress in a Diverse WorldEmpowered lives.Resilient nations.
Copyright © 2013by the <strong>United</strong> <strong>Nations</strong> <strong>Development</strong> <strong>Programme</strong>1 UN Plaza, New York, NY 10017, USAAll rights reserved. No part of this publication may be reproduced, stored in a retrieval system or transmitted, in any form or by anymeans, electronic, mechanical, photocopying, recording or otherwise, without prior permission.Printed in Canada by Lowe-Martin Group on Forest Stewardship Council certified and elemental chlorine-free papers. Printed usingvegetable-based inks and produced by means of environmentally compatible technologies.Editing and production: Communications <strong>Development</strong> Incorporated, Washington DCDesign: Melanie Doherty Design, San Francisco, CAFor a list of any errors or omissions found subsequent to printing, please visit our website at http://hdr.undp.orgHuman <strong>Development</strong> Report 2013 teamDirector and lead authorKhalid MalikResearch and statisticsMaurice Kugler (Head of Research), Milorad Kovacevic (Chief Statistician), Subhra Bhattacharjee, Astra Bonini, CeciliaCalderón, Alan Fuchs, Amie Gaye, Iana Konova, Arthur Minsat, Shivani Nayyar, José Pineda and Swarnim WagléCommunications and publishingWilliam Orme (Chief of Communications), Botagoz Abdreyeva, Carlotta Aiello, Eleonore Fournier-Tombs, Jean-YvesHamel, Scott Lewis and Samantha WauchopeNational Human <strong>Development</strong> ReportsEva Jespersen (Deputy Director), Christina Hackmann, Jonathan Hall, Mary Ann Mwangi and Paola PaglianiOperations and administrationSarantuya Mend (Operations Manager), Ekaterina Berman, Diane Bouopda, Mamaye Gebretsadik and Fe Juarez-Shanahan
ForewordThe 2013 Human <strong>Development</strong> Report, TheRise of the South: Human Progress in a DiverseWorld, looks at the evolving geopolitics of ourtimes, examining emerging issues and trendsand also the new actors which are shaping thedevelopment landscape.The Report argues that the striking transformationof a large number of developingcountries into dynamic major economies withgrowing political influence is having a significantimpact on human development progress.The Report notes that, over the last decade,all countries accelerated their achievements inthe education, health, and income dimensionsas measured in the Human <strong>Development</strong> Index(HDI)—to the extent that no country forwhich data was available had a lower HDI valuein 2012 than in 2000. As faster progress wasrecorded in lower HDI countries during thisperiod, there was notable convergence in HDIvalues globally, although progress was unevenwithin and between regions.Looking specifically at countries which liftedtheir HDI value substantially between 1990and 2012 on both the income and non-incomedimensions of human development, the Reportexamines the strategies which enabled them toperform well. In this respect, the 2013 Reportmakes a significant contribution to developmentthinking by describing specific drivers ofdevelopment transformation and by suggestingfuture policy priorities that could help sustainsuch momentum.By 2020, according to projections developedfor this Report, the combined economicoutput of three leading developing countriesalone—Brazil, China and India—will surpassthe aggregate production of Canada, France,Germany, Italy, the <strong>United</strong> Kingdom and the<strong>United</strong> States. Much of this expansion is beingdriven by new trade and technology partnershipswithin the South itself, as this Report alsoshows.A key message contained in this and previousHuman <strong>Development</strong> Reports, however, is thateconomic growth alone does not automaticallytranslate into human development progress.Pro-poor policies and significant investmentsin people’s capabilities—through a focus on education,nutrition and health, and employmentskills—can expand access to decent work andprovide for sustained progress.The 2013 Report identifies four specificareas of focus for sustaining developmentmomentum: enhancing equity, including onthe gender dimension; enabling greater voiceand participation of citizens, including youth;confronting environmental pressures; and managingdemographic change.The Report also suggests that as global developmentchallenges become more complexand transboundary in nature, coordinatedaction on the most pressing challenges of ourera, whether they be poverty eradication, climatechange, or peace and security, is essential.As countries are increasingly interconnectedthrough trade, migration, and informationand communications technologies, it is nosurprise that policy decisions in one placehave substantial impacts elsewhere. The crisesof recent years—food, financial, climate—which have blighted the lives of so many pointto this, and to the importance of working toreduce people’s vulnerability to shocks anddisasters.To harness the wealth of knowledge, expertise,and development thinking in theSouth, the Report calls for new institutionswhich can facilitate regional integration andSouth–South cooperation. Emerging powersin the developing world are already sources ofinnovative social and economic policies andare major trade, investment, and increasinglydevelopment cooperation partners for otherdeveloping countries.Many other countries across the South haveseen rapid development, and their experiencesand South–South cooperation are equally aninspiration to development policy. UNDP isable to play a useful role as a knowledge broker,and as a convener of partners—governments,civil society and multinational companies—toshare experiences. We have a key role too infacilitating learning and capacity building. ThisReport offers very useful insights for our futureengagement in South–South cooperation.ii | Human <strong>Development</strong> Report 2013
Finally, the Report also calls for a critical lookat global governance institutions to promote afairer, more equal world. It points to outdatedstructures, which do not reflect the new economicand geopolitical reality described, andconsiders options for a new era of partnership.It also calls for greater transparency and accountability,and highlights the role of globalcivil society in advocating for this and forgreater decision-making power for those mostdirectly affected by global challenges, who areoften the poorest and most vulnerable peoplein our world.As discussion continues on the global developmentagenda beyond 2015, I hope many willtake the time to read this Report and reflecton its lessons for our fast-changing world.The Report refreshes our understanding ofthe current state of global development, anddemonstrates how much can be learned fromthe experiences of fast development progress inso many countries in the South.Helen ClarkAdministrator<strong>United</strong> <strong>Nations</strong> <strong>Development</strong> <strong>Programme</strong>Summary | iii
Contents of the 2013 Human <strong>Development</strong> ReportForewordAcknowledgementsOverviewIntroductionCHAPTER 1The state of human developmentProgress of nationsSocial integrationHuman securityCHAPTER 2A more global SouthRebalancing: a more global world, a more global SouthImpetus from human developmentInnovation and entrepreneurship in the SouthNew forms of cooperationSustaining progress in uncertain timesCHAPTER 3Drivers of development transformationDriver 1: a proactive developmental stateDriver 2: tapping of global marketsDriver 3: determined social policy innovationCHAPTER 4Sustaining momentumPolicy priorities for developing countriesModelling demography and educationImpact of the rate of population ageingThe need for ambitious policiesSeizing the momentCHAPTER 5Governance and partnerships for a new eraA new global view of public goodsBetter representation for the SouthGlobal civil societyTowards coherent pluralismResponsible sovereigntyNew institutions, new mechanismsConclusions: partners in a new eraNotesReferencesSTATISTICAL ANNEXReaders guideKey to HDI countries and ranks, 2012Statistical tables1 Human <strong>Development</strong> Index and its components2 Human <strong>Development</strong> Index trends, 1980–20123 Inequality-adjusted Human <strong>Development</strong> Index4 Gender Inequality Index5 Multidimensional Poverty Index6 Command over resources7 Health8 Education9 Social integration10 International trade flows of goods and services11 International capital flows and migration12 Innovation and technology13 Environment14 Population trendsRegionsStatistical referencesTechnical appendix: explanatory note for projections exerciseiv | HUMAN DEVELOPMENT REPORT 2013
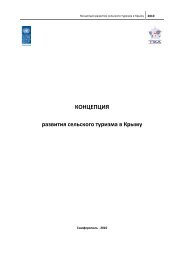
SummaryWhen developed economies stopped growing during the 2008–2009 financial crisis but developing economies kept ongrowing, the world took notice. The rise of the South, seen within the developing world as an overdue global rebalancing,has been much commented on since. This discussion has typically focused narrowly on GDP and trade growth in a fewlarge countries. Yet there are broader dynamics at play, involving many more countries and deeper trends, with potentiallyfar-reaching implications for people’s lives, for social equity and for democratic governance at the local and global levels. Asthis Report shows, the rise of the South is both the result of continual human development investments and achievementsand an opportunity for still greater human progress for the world as a whole. Making that progress a reality will requireinformed and enlightened global and national policymaking, drawing on the policy lessons analysed in this Report.The rise of the SouthThe rise of the South is unprecedented in itsspeed and scale. It must be understood in broadhuman development terms as the story of a dramaticexpansion of individual capabilities andsustained human development progress in thecountries that are home to the vast majority ofthe world’s people. When dozens of countriesand billions of people move up the developmentladder, as they are doing today, it has adirect impact on wealth creation and broaderhuman progress in all countries and regionsof the world. There are new opportunities forcatch-up for less developed countries and forcreative policy initiatives that could benefit themost advanced economies as well.Although most developing countries havedone well, a large number of countries havedone particularly well—what can be calledthe “rise of the South”. Some of the largestcountries have made rapid advances, notablyBrazil, China, India, Indonesia, Mexico, SouthAfrica and Turkey. But there has also been substantialprogress in smaller economies, such asBangladesh, Chile, Ghana, Mauritius, Rwandaand Tunisia (figure 1).While focusing on the rise of the South andits implications for human development, the2013 Human <strong>Development</strong> Report is also aboutthis changing world, driven in large measure bythe rise of the South. It examines the progressbeing made, the challenges arising (some as aresult of that very success) and the opportunitiesemerging for representative global andregional governance.For the first time in 150 years, the combinedoutput of the developing world’s threeleading economies—Brazil, China andIndia—is about equal to the combined GDPof the long standing industrial powers of theNorth—Canada, France, Germany, Italy,<strong>United</strong> Kingdom and the <strong>United</strong> States. Thisrepresents a dramatic rebalancing of globalFigure 1More than 40 countries of the South experienced significantly greater HDI gainssince 1990 than would have been predicted based on their previous HDI performanceHDI, 20120.90.70.50.3RwandaHDI 1990 = HDI 2012Tunisia TurkeyThailandChinaIndonesiaViet NamIndiaLao PDR GhanaBangladeshUgandaHighlighted 18Korea, Rep.ChileMexicoMalaysiaBrazilMauritius0.10.1 0.3 0.5 0.7 0.9Big improversHDI, 1990Note: Countries above the 45 degree line had a higher HDI value in 2012 than in 1990. Blue and grey markers indicate countries withsignificantly larger than predicted increases in HDI value between 1990 and 2012 given their HDI value in 1990. These countries wereidentified based on residuals obtained from a regression of the change in log of HDI between 2012 and 1990 on the log of HDI in 1990.Countries that are labelled are a selected group of rapid HDI improvers that are discussed in greater detail in chapter 3 of the full Report.Source: HDRO calculations.OthersSummary | 1
The South is emergingalongside the North asa breeding ground fortechnical innovation andcreative entrepreneurshipeconomic power: In 1950, Brazil, China andIndia together represented only 10% of theworld economy, while the six traditionaleconomic leaders of the North accounted formore than half. According to projections in theReport, by 2050, Brazil, China and India willtogether account for 40% of global output (figure2), far surpassing the projected combinedproduction of today’s Group of Seven bloc.The middle class in the South is growing rapidlyin size, income and expectations (figure 3).The sheer number of people in the South—thebillions of consumers and citizens—multipliesthe global human development consequencesof actions by governments, companies andinternational institutions in the South. TheSouth is now emerging alongside the North asa breeding ground for technical innovation andcreative entrepreneurship. In North–Southtrade, the newly industrializing economieshave built capabilities to efficiently manufacturecomplex products for developed countrymarkets. But South–South interactions haveenabled companies in the South to adapt andinnovate with products and processes that arebetter suited to local needs.The state of human developmentThe Human <strong>Development</strong> Index (HDI) in2012 reveals much progress. Over the pastdecades, countries across the world have beenconverging towards higher levels of human development.The pace of HDI progress has beenfastest in countries in the low and mediumhuman development categories. This is goodnews. Yet progress requires more than averageimprovement in the HDI. It will be neither desirablenor sustainable if increases in the HDIare accompanied by rising inequalities in income,unsustainable patterns of consumption,high military spending and low social cohesion(box 1).An essential part of human developmentis equity. Every person has the right to liveFigure 2Brazil, China and India combined are projected to account for 40% of global output by 2050, up from 10% in1950Share of global output (%)60PROJECTION50403020100182018601900Brazil, China and India19401980 20102050Canada, France, Germany, Italy, the <strong>United</strong> Kingdom and the <strong>United</strong> StatesNote: Output is measured in 1990 purchasing power parity dollars.Source: HDRO interpolation of historical data from Maddison (2010) and projections based on Pardee Center for International Futures (2013).2 | Human <strong>Development</strong> Report 2013
a fulfilling life according to his or her ownvalues and aspirations. No one should bedoomed to a short life or a miserable onebecause he or she happens to be from the“wrong” class or country, the “wrong” ethnicgroup or race or the “wrong” sex. Inequalityreduces the pace of human development andin some cases may even prevent it entirely.Globally, there have been much greater reductionsin inequality in health and education inthe last two decades than in income (figure4). Virtually all studies agree that global incomeinequality is high, though there is noconsensus on recent trends.A more global SouthGlobal production is rebalancing in ways notseen for 150 years. Growth in the cross-bordermovement of goods, services, people and ideashas been remarkable. By 2011, trade accountedfor nearly 60% of global output. Developingcountries have played a big part in this (box 2):between 1980 and 2010, they increased theirshare of world merchandise trade from 25% to47% and their share of world output from 33%to 45%. Developing regions have also beenstrengthening links with each other: between1980 and 2011, South–South trade as a shareof world merchandise trade rose from 8.1% to26.7% (figure 5).All developing countries are not yet participatingfully in the rise of the South. The pace ofchange is slower, for instance, in most of the 49least developed countries, especially those thatare landlocked or distant from world markets.Nevertheless, many of these countries havealso begun to benefit from South–South trade,investment, finance and technology transfer.There have, for example, been positive growthspillovers from China to other developingcountries, particularly close trading partners.These benefits have to some extent offset slackeningdemand from the developed countries.Growth in low-income countries would havebeen an estimated 0.3–1.1 percentage pointslower in 2007–2010 had growth fallen at thesame rate in China and India as in developedeconomies.Many countries have also benefited fromspillovers into sectors that contribute to humanFigure 3The middle class in the South is projected to continue to growMiddle class population (billions)2009World:1.845 billionEuropeCentral and South Americadevelopment, especially health. Indian firms,for example, are supplying affordable medicines,medical equipment, and informationand communications technology products andservices to countries in Africa. Brazilian andSouth African companies are doing the same intheir regional markets.Nevertheless, exports from larger countriescan also have disadvantages. Large countriesgenerate competitive pressures in smallercountries that can stifle economic diversificationand industrialization. But there are alsoinstances where competitive jolts have beenfollowed by industrial revival. A competitiverole today may easily turn into a complementaryrole tomorrow. Moving from competitionto cooperation seems to depend on policies fordealing with new challenges.Drivers of developmenttransformationMany countries have made substantial progressover the past two decades: the rise of the Southhas been fairly broad-based. Nevertheless,several high achievers have not only boosted2020 2030World:3.249 billion.032.057.105.165.181.664.251.703.338 .333.5251.740Asia–PacificMiddle East and North AfricaWorld:4.884 billion.107.234.313.3223.228.680North AmericaSub-Saharan AfricaNote: The middle class includes people earning or spending $10–$100 a day (in 2005 purchasing power parity terms).Source: Brookings Institution 2012.All developingcountries are not yetparticipating fully inthe rise of the SouthSummary | 3
Box 1Amartya Sen, Nobel Laureate in EconomicsWhat is it like to be a human being?Almost half a century ago, the philosopher Thomas Nagel published a famouspaper called “What Is It Like to Be a Bat?” The question I want to askis: what is it like to be a human being? As it happens, Tom Nagel’s insightfulpaper in The Philosophical Review was also really about human beings,and only marginally about bats. Among other points, Nagel expressed deepscepticism about the temptation of observational scientists to identify theexperience of being a bat—or similarly, a human being—with the associatedphysical phenomena in the brain and elsewhere in the body that arewithin easy reach of outside inspection. The sense of being a bat or a humancan hardly be seen as just having certain twitches in the brain and of thebody. The complexity of the former cannot be resolved by the easier tractabilityof the latter (tempting though it may be to do just that).The cutting edge of the human development approach is also based on adistinction —but of a rather different kind from Nagel’s basic epistemologicalcontrast. The approach that Mahbub ul Haq pioneered through the seriesof Human <strong>Development</strong> Reports which began in 1990 is that between, onthe one hand, the difficult problem of assessing the richness of human lives,including the freedoms that human beings have reason to value, and on theother, the much easier exercise of keeping track of incomes and other externalresources that persons—or nations—happen to have. Gross domesticproduct (GDP) is much easier to see and measure than the quality of humanlife that people have. But human well-being and freedom, and their connectionwith fairness and justice in the world, cannot be reduced simply to themeasurement of GDP and its growth rate, as many people are tempted to do.The intrinsic complexity of human development is important to acknowledge,partly because we should not be side-tracked into changing the question:that was the central point that moved Mahbub ul Haq’s bold initiative tosupplement—and to some extent supplant—GDP. But along with that camea more difficult point, which is also an inescapable part of what has cometo be called “the human development approach.” We may, for the sake ofconvenience, use many simple indicators of human development, such asthe HDI, based on only three variables with a very simple rule for weightingthem—but the quest cannot end there. We should not spurn workableand useful shortcuts—the HDI may tell us a lot more about human qualityof life than does the GDP—but nor should we be entirely satisfied withthe immediate gain captured in these shortcuts in a world of continuouspractice. Assessing the quality of life is a much more complex exercise thanwhat can be captured through only one number, no matter how judicious isthe selection of variables to be included, and the choice of the procedure ofweighting.The recognition of complexity has other important implications as well.The crucial role of public reasoning, which the present Human <strong>Development</strong>Report particularly emphasizes, arises partly from the recognition of thiscomplexity. Only the wearer may know where the shoe pinches, but pinchavoidingarrangements cannot be effectively undertaken without givingvoice to the people and giving them extensive opportunities for publicdiscussion. The importance of various elements in evaluating well-beingand freedom of people can be adequately appreciated and assessed onlythrough persistent dialogue among the population, with an impact on themaking of public policy. The political significance of such initiatives as theso-called Arab Spring, and mass movements elsewhere in the world, ismatched by the epistemic importance of people expressing themselves, indialogue with others, on what ails their lives and what injustices they wantto remove. There is much to discuss—with each other and with the publicservants that make policy.The dialogic responsibilities, when properly appreciated across thelines of governance, must also include representing the interest of thepeople who are not here to express their concerns in their own voice.Human development cannot be indifferent to future generations just becausethey are not here—yet. But human beings do have the capacity tothink about others, and their lives, and the art of responsible and accountablepolitics is to broaden dialogues from narrowly self-centred concernsto the broader social understanding of the importance of the needs andfreedoms of people in the future as well as today. This is not a matterof simply including those concerns within one single indicator—for example,by overcrowding the already heavily loaded HDI (which stands, inany case, only for current well-being and freedom)—but it certainly is amatter of making sure that the discussions of human development includethose other concerns. The Human <strong>Development</strong> Reports can continue tocontribute to this broadening through explication as well as presentingtables of relevant information.The human development approach is a major advance in the difficultexercise of understanding the successes and deprivations of human lives,and in appreciating the importance of reflection and dialogue, and throughthat advancing fairness and justice in the world. We may be much like batsin not being readily accessible to the measuring rod of the impatient observationalscientist, but we are also capable of thinking and talking about themany- sided nature of our lives and those of others—today and tomorrow—in ways that may not be readily available to bats. Being a human being isboth like being a bat and very unlike it.national income, but have also had better thanaverage performance on social indicators suchas health and education (figure 6).How have so many countries in the Southtransformed their human development prospects?Across most of these countries, therehave been three notable drivers of development:a proactive developmental state, tappingof global markets and determined social policyand innovation. These drivers are not derivedfrom abstract conceptions of how developmentshould work; rather, they are demonstratedby the transformational development experiencesof many countries in the South. Indeed,they challenge preconceived and prescriptiveapproaches: on the one hand, they set asidea number of collectivist, centrally managedprecepts; on the other hand, they diverge fromthe unfettered liberalization espoused by theWashington Consensus.4 | Human <strong>Development</strong> Report 2013
Figure 4Most regions show declining inequality in health and education and rising inequality in incomeHealthEducationIncomeLoss due to inequality (%) Loss due to inequality (%) Loss due to inequality (%)6060605050504040403030302020201010100001990 1995 2000 2005 2010 1990 1995 2000 2005 2010 1990 1995 2000 2005Arab StatesEast Asia andthe PacificEurope andCentral AsiaLatin America andthe CaribbeanSouth AsiaSub-Saharan AfricaDevelopedcountriesNote: Based on a population-weighted balanced panel of 182 countries for loss due to health inequality, 144 countries for loss due to education inequality and 66 countries for loss due to income inequality. Data onincome inequality from Milanović (2010) are available through 2005.Source: HDRO calculations using health data from <strong>United</strong> <strong>Nations</strong> Department of Economic and Social Affairs life tables, education data from Barro and Lee (2010) and income inequality data from Milanović (2010).Driver 1: a proactivedevelopmental stateA strong, proactive and responsible statedevelops policies for both public and privatesectors—based on a long-term vision andleadership, shared norms and values, and rulesand institutions that build trust and cohesion.Achieving enduring transformation requirescountries to chart a consistent and balancedapproach to development. Countries thathave succeeded in igniting sustained growthin income and human development have not,however, followed one simple recipe. Facedwith different challenges, they have adoptedvarying on market regulation, export promotion,industrial development and technologicaladaptation and progress. Priorities need tobe people-centred, promoting opportunitieswhile protecting people against downsiderisks. Governments can nurture industriesthat would not otherwise emerge due to incompletemarkets. Although this poses somepolitical risks of rent seeking and cronyism, ithas enabled several countries of the South toturn industries previously derided as inefficientinto early drivers of export success once theireconomies became more open.In large and complex societies, the outcomeof any particular policy is inevitably uncertain.<strong>Development</strong>al states need to be pragmaticand test a range of different approaches. Somefeatures stand out: for instance, people-friendlydevelopmental states have expanded basic socialservices. Investing in people’s capabilities—through health, education and other publicSummary | 5
Box 2The South’s integration with the world economy and human developmentIn a sample of 107 developing countries over 1990–2010, about 87% canbe considered globally integrated: they increased their trade to outputratio, have many substantial trading partnerships 1 and maintain a hightrade to output ratio relative to countries at comparable income levels. 2All these developing countries are also much more connected to the worldand with each other: Internet use has expanded dramatically, with themedian annual growth in the number of users exceeding 30% between2000 and 2010.While not all globally integrated developing countries have made rapidgains in Human <strong>Development</strong> Index (HDI) value, the converse is true. Almostall developing countries that made the most improvement in HDI value relativeto their peers between 1990 and 2012 (at least 45 in the sample here)have integrated more with the world economy over the past two decades;their average increase in trade to output ratio is about 13 percentage pointsgreater than that of the group of developing countries with more modestimprovement in HDI value. This is consistent with earlier findings that countriestend to open more as they develop. 3The increasingly integrated countries with major improvement inHDI value include not only the large ones that dominate the headlines,but also dozens of smaller and least developed countries. Thus theyconstitute a larger and more varied group than the emerging marketeconomies often designated by acronyms, such as BRICS (Brazil, RussianFederation, India, China and South Africa), IBSA (India, Brazil and SouthAfrica), CIVETS (Colombia, Indonesia, Viet Nam, Egypt, Turkey and SouthAfrica) and MIST (Mexico, Indonesia, South Korea [Republic of Korea]and Turkey).The figure below plots improvement in HDI value 4 against thechange in trade to output ratio, an indicator of the depth of participationin global markets. More than four-fifths of these developing countriesincreased their trade to output ratio between 1990 and 2012. Among theexceptions in the subgroup that also made substantial improvement inHDI value are Indonesia, Pakistan and Venezuela, three large countriesthat are considered global players in world markets, exporting or importingfrom at least 80 economies. Two smaller countries whose tradeto output ratio declined (Mauritius and Panama) continue to trade atlevels much higher than would be expected for countries at comparableincome levels. All countries that had substantial improvement in HDIvalue and increased their trade to output ratio between 1990 and 2012are highlighted in the upper right quadrant of the figure. Countries in thelower right quadrant (including Kenya, the Philippines and South Africa)increased their trade to output ratio but made modest improvement inHDI value.Human progress and trade expansion in the SouthRelative improvement in HDI value, 1990–20120.30.20.10–0.1ChinaTurkey MexicoBrazilGhanaBangladeshIndia–0.2–0.3–0.4–0.6 –0.4 –0.2 0.0 0.2 0.4 0.6 0.8 1.0 1.2Change in trade to output ratio, 1990–2010High HDI improvers, globally integratedModest HDI improvers, globally integratedOthers1. Bilateral trade exceeding $2 million in 2010–2011.2. Based on results from a cross-country regression of trade to GDP ratio on income per capita that controls for population and landlockedness.3. See Rodrik (2001).4. Relative HDI improvement is measured by residuals from a regression of the change in the log of HDI value between 1990 and 2012 on the log of initial HDI value in 1990. Five countries with black dots in the upperleft quadrant made substantial improvement in HDI value but reduced their trade to output ratio between 1990 and 2010, though they either maintained a large number of substantial trading ties globally or tradedmore than predicted for countries at comparable levels of income per capita. Countries with open circles in the upper right and lower right quadrants had modest relative improvement in HDI value between 1990 and2012 but increased their trade to output ratio or maintained a large number of substantial trading ties.Source: HDRO calculations; trade to output ratios from World Bank (2012a).6 | Human <strong>Development</strong> Report 2013
services—is not an appendage of the growthprocess but an integral part of it (figures 7and 8). Rapid expansion of quality jobs is acritical feature of growth that promotes humandevelopment.Driver 2: tapping of global marketsGlobal markets have played an important rolein advancing progress. All newly industrializingcountries have pursued a strategy of “importingwhat the rest of the world knows and exportingwhat it wants”. But even more important isthe terms of engagement with these markets.Without investment in people, returns fromglobal markets are likely to be limited. Successis more likely to be the result not of a suddenopening but of gradual and sequenced integrationwith the world economy, according tonational circumstances, and accompanied byinvestment in people, institutions and infrastructure.Smaller economies have successfullyfocused on niche products, the choice of whichis often the result of years of state support builton existing competencies or the creation ofnew ones.Driver 3: determined socialpolicy innovationFew countries have sustained rapid growthwithout impressive levels of public investment—notjust in infrastructure, but also inhealth and education. The aim should be tocreate virtuous cycles in which growth andsocial policies reinforce each other. Growthhas frequently been much more effective atreducing poverty in countries with low incomeinequality than in countries with high incomeinequality. Promoting equality, particularlyamong different religious, ethnic or racialgroups, also helps reduce social conflict.Education, health care, social protections,legal empowerment and social organization allenable poor people to participate in growth.Sectoral balance—especially paying attentionto the rural sector—and the nature and paceof employment expansion are critical in determininghow far growth spreads incomes.But even these basic policy instruments maynot empower disenfranchised groups. Poorpeople on the fringes of society struggle toFigure 5As a share of world merchandise trade, South–South trade more than tripled over1980–2011, while North–North trade declinedShare of world merchandise trade (%)6050403020100198019851990Note: North in 1980 refers to Australia, Canada, Japan, New Zealand, the <strong>United</strong> States and Western Europe.Source: HDRO calculations based on UNSD (2012).Figure 61995200020052011North–NorthSouth–SouthSouth–NorthSome countries have performed well on both the nonincome and the incomedimensions of the HDIDeviation from expected performance of nonincome dimensions of the HDI, 1990–20120.30.20.10–0.1–0.2–0.3–0.4UgandaBrazil Tunisia IndonesiaTurkey BangladeshMexicoKorea, Rep.GhanaViet NamMalaysiaIndiaMauritiusThailandChileChina–0.04 –0.02 0 0.02 0.04 0.06 0.08 0.10Note: Based on a balanced panel of 96 countries.Source: HDRO calculations.Growth in GNI per capita, 1990–2012 (%)High achievers in human developmentOthersSummary | 7
Figure 7Current HDI values and previous public expenditures are positively correlated . . .HDI, 20121.00.90.80.70.60.50.40.30.26 7 8 9 10 11 12 13 14Log of public expenditure on health and education per capita, 2000Source: HDRO calculations and World Bank (2012a).Figure 8. . . as are current child survival and previous public expenditure on healthLog of under-five mortality rate, 2010–201165432102 4 6 8 10 12 14Source: HDRO calculations based on World Bank (2012a).Log of public expenditure on health per capita, 2000voice their concerns, and governments do notalways evaluate whether services intended toreach everyone actually do. Social policy has topromote inclusion—ensuring nondiscriminationand equal treatment is critical for politicaland social stability—and provide basic socialservices, which can underpin long-term economicgrowth by supporting the emergence ofa healthy, educated labour force. Not all suchservices need be provided publically. But thestate should ensure that all citizens have secureaccess to the basic requirements of human development(box 3).An agenda for development transformationthat promotes human development is thusmultifaceted. It expands people’s assets by universalizingaccess to basic services. It improvesthe functioning of state and social institutionsto promote equitable growth where the benefitsare widespread. It reduces bureaucraticand social constraints on economic actionand social mobility. And it holds leadershipaccountable.Sustaining momentumMany countries of the South have demonstratedmuch success. But even in higher achievingcountries, future success is not guaranteed. Howcan countries in the South continue their paceof progress in human development, and howcan the progress be extended to other countries?The Report suggests four important areas tofacilitate this: enhancing equity, enabling voiceand participation, confronting environmentalpressures and managing demographic change.The Report points to the high cost of policyinaction and argues for greater policy ambition.Enhancing equityGreater equity, including between men andwomen and across groups, is not only valuablein itself, but also essential for promoting humandevelopment. One of the most powerfulinstruments for this purpose is education,which boosts people’s self-confidence andmakes it easier for them to find better jobs,engage in public debate and make demands ongovernment for health care, social security andother entitlements.8 | Human <strong>Development</strong> Report 2013
Box 3Michael Bloomberg, Mayor, New York CityWhy New York City looked South for antipoverty policy adviceIn New York City, we are working to better the lives of our residents in manyways. We continue to improve the quality of education in our schools. Wehave improved New Yorkers’ health by reducing smoking and obesity. Andwe have enhanced the city’s landscape by adding bike lanes and plantinghundreds of thousands of trees.We have also sought to reduce poverty by finding new and better waysto build self-sufficiency and prepare our young people for bright futures. Tolead this effort, we established the Center for Economic Opportunity. Itsmission is to identify strategies to help break the cycle of poverty throughinnovative education, health and employment initiatives.Over the last six years, the centre has launched more than 50 pilotprogrammes in partnership with city agencies and hundreds of communitybasedorganizations. It has developed a customized evaluation strategy foreach of these pilots, monitoring their performance, comparing outcomes anddetermining which strategies are most successful at reducing poverty andexpanding opportunity. Successful programmes are sustained with new publicand private funds. Unsuccessful programmes are discontinued, and resourcesreinvested in new strategies. The centre’s findings are then sharedacross government agencies, with policymakers, with nonprofit partners andprivate donors, and with colleagues across the country and around the worldwho are also seeking new ways to break the cycle of poverty.New York is fortunate to have some of the world’s brightest minds workingin our businesses and universities, but we recognize there is much to learnfrom programmes developed elsewhere. That is why the centre began its workby conducting an international survey of promising antipoverty strategies.In 2007, the centre launched Opportunity NYC: Family Rewards, the firstconditional cash transfer programme in the <strong>United</strong> States. Based on similarprogrammes operating in more than 20 other countries, Family Rewards reducespoverty by providing households with incentives for preventive healthcare, education and job training. In designing Family Rewards, we drew onlessons from Brazil, Mexico and dozens of other countries. By the end ofour three-year pilot, we had learned which programme elements worked inNew York City and which did not; information that is now helpful to a newgeneration of programmes worldwide.Before we launched Opportunity NYC: Family Rewards, I visited Toluca,Mexico, for a firsthand look at Mexico’s successful federal conditional cashtransfer programme, Oportunidades. We also participated in a North–South learning exchange hosted by the <strong>United</strong> <strong>Nations</strong>. We worked withthe Rockefeller Foundation, the World Bank, the Organization of AmericanStates and other institutions and international policymakers to exchange experienceson conditional cash transfer programmes in Latin America, as wellas in Indonesia, South Africa and Turkey.Our international learning exchanges are not limited to these cashtransfer initiatives; they also include innovative approaches to urban transportation,new education initiatives and other programmes.No one has a monopoly on good ideas, which is why New York willcontinue to learn from the best practices of other cities and countries. Andas we adapt and evaluate new programmes in our own city, we remain committedto returning the favour and making a lasting difference in communitiesaround the world.Education also has striking benefits for healthand mortality (box 4). Research for the reportfind that mother’s education is more importantto child survival than household income orwealth is and that policy interventions have agreater impact where education outcomes areinitially weaker. This has profound policy implications,potentially shifting emphasis fromefforts to boost household income to measuresto improve girls’ education.The Report makes a strong case for policyambition. An accelerated progress scenariosuggests that low HDI countries can convergetowards the levels of human developmentachieved by high and very high HDI countries.By 2050, aggregate HDI could rise 52%in Sub-Saharan Africa (from 0.402 to 0.612)and 36% in South Asia (from 0.527 to 0.714).Policy interventions under this scenario willalso have a positive impact on the fight againstpoverty. By contrast, the costs of inaction willbe increasingly higher, especially in low HDIcountries, which are more vulnerable. Forinstance, failing to implement ambitious universaleducation policies will adversely affectmany essential pillars of human developmentfor future generations.Enabling voice and participationUnless people can participate meaningfullyin the events and processes that shape theirlives, national human development paths willbe neither desirable nor sustainable. Peopleshould be able to influence policymaking andresults, and young people in particular shouldbe able to look forward to greater economicopportunities and political participation andaccountability.Dissatisfaction is on the rise in the Northand the South as people call for more opportunitiesto voice their concerns and influencepolicy, especially on basic social protection.Among the most active protesters are youth,in part a response to job shortages and limitedemployment opportunities for educatedThe Report makesa strong case forpolicy ambitionSummary | 9
Figure 9HDI1.00GDP per capita (2000 PPP $ thousands)600.950.90500.85400.800.75300.70200.650.60100.550201020152020202520302035204020452050201020152020202520302035204020452050Base scenario:very high HDI countriesAccelerated progress scenario:very high HDI countriesBase scenario:low, medium and high HDI countriesAccelerated progress scenario:low, medium and high HDI countriesIn terms of human development, the cost of inaction is higher for countries with lower HDI values. In terms of GDP per capita loss, the cost of inaction isproportionally the same for countries irrespective of their HDI value.Source: HDRO calculations based on Pardee Center for International Futures (2013).young people. History is replete with popularrebellions against unresponsive governments.This can derail human development as unrestimpedes investment and growth and autocraticgovernments divert resources to maintaininglaw and order.It is hard to predict when societies will reacha tipping point. Mass protests, especially byeducated people, tend to erupt when bleakprospects for economic opportunities lowerthe opportunity cost of engaging in politicalactivity. These “effort-intensive forms of politicalparticipation” are then easily coordinatedthrough new forms of mass communication.Confronting environmental challengesWhile environmental threats such as climatechange, deforestation, air and water pollution,and natural disasters affect everyone, they hurtpoor countries and poor communities most.Climate change is already exacerbating chronicenvironmental threats, and ecosystem losses areconstraining livelihood opportunities, especiallyfor poor people.Although low HDI countries contribute theleast to global climate change, they are likely toexperience the greatest loss in annual rainfalland the sharpest increases in its variability, withdire implications for agricultural productionand livelihoods. The magnitude of such losseshighlights the urgency of adopting copingmeasures to increase people’s resilience to climatechange.The cost of inaction will likely be high. Thelonger action is delayed, the higher the costwill be. To ensure sustainable economies andsocieties, new policies and structural changes10 | Human <strong>Development</strong> Report 2013
Box 4Why population prospects will likely differ in the Republic of Korea and IndiaEducational attainment has risen rapidly in the Republic of Korea. In the1950s a large proportion of school-age children received no formal education.Today, young Korean women are among the best educated women inthe world: more than half have completed college. As a consequence, elderlyKoreans of the future will be much better educated than elderly Koreansof today (see figure), and because of the positive correlation between educationand health, they are also likely to be healthier.Assuming that enrolment rates (which are high) remain constant, theproportion of the population younger than age 14 will drop from 16% in 2010to 13% in 2050. There will also be a marked shift in the population’s educationcomposition, with the proportion having a tertiary education projectedto rise from 26% to 47%.For India, the picture looks very different. Before 2000, more than half theadult population had no formal education. Despite the recent expansion in basicschooling and impressive growth in the number of better educated Indians(undoubtedly a key factor in India’s recent economic growth), the proportionof the adult population with no education will decline only slowly. Partly becauseof this lower level of education, particularly among women, India’spopulation is projected to grow rapidly, with India surpassing China as themost populous country. Even under an optimistic fast track scenario, whichassumes education expansion similar to Korea’s, India’s education distributionin 2050 will still be highly unequal, with a sizeable group of uneducated(mostly elderly) adults. The rapid expansion in tertiary education under thisscenario, however, will build a very well educated young adult labour force.Comparative population and education futures in the Republic of Korea and IndiaPopulation (millions)50Republic of Korea, constant enrolment ratiosPopulation (millions)2,000India, fast track scenario40TERTIARYTERTIARY1,500TERTIARY30SECONDARYSECONDARY1,000SECONDARY2010PRIMARYNO EDUCATIONPRIMARY500NO EDUCATIONPRIMARY0197019801990200020102020 20302040 20500197019801990200020102020 20302040 2050Source: Lutz and KC 2013.are needed that align human development andclimate change goals in low-emission, climateresilientstrategies and innovative publicprivatefinancing mechanisms.Managing demographic changeBetween 1970 and 2011, world populationswelled from 3.6 billion to 7 billion. As thatpopulation becomes more educated, its growthrate will decrease. <strong>Development</strong> prospects areinfluenced by the age structure of the population,as well as its size. An increasingly criticalconcern is the dependency ratio—that is, thenumber of younger and older people dividedby the working-age population ages 15–64.Some poorer countries will benefit from a“demographic dividend” as the share of thepopulation in the workforce rises, but only ifthere is strong policy action. Girls’ education,for instance, is a critical vehicle of a possible demographicdividend. Educated women tend tohave fewer, healthier and better educated children;in many countries educated women alsoenjoy higher salaries than uneducated workers.The richer regions of the South, by contrast,will confront a very different problem, as theirpopulation age, reducing the share of the working-agepopulation. The rate of populationageing matters because developing countrieswill struggle to meet the needs of an older populationif they are still poor. Many developingSummary | 11
some intergovernmentalprocesses wouldbe invigorated bygreater participationfrom the Southcountries now have only a short window ofopportunity to reap the full benefits of the demographicdividend.Demographic trends are not deterministic,however. They can be altered, at least indirectly,by education policies. The Report presentstwo scenarios for 2010–2050: the base casescenario, in which enrolment ratios remainconstant at each level of education, and a fasttrack scenario, in which the countries withthe lowest initial education levels embraceambitious education targets. The decline in thedependency ratio for low HDI countries underthe fast track scenario is more than twice thatunder the base case scenario. Ambitious educationpolicies can enable medium and highHDI countries to curb projected increases intheir dependency ratios, in order to make theirdemographic transition towards an ageing populationless difficult.Addressing these demographic challengeswill require raising educational attainmentlevels while expanding productive employmentopportunities—by reducing unemployment,promoting labour productivity and increasinglabour force participation, particularly amongwomen and older workers.Governance and partnershipsfor a new eraThe new arrangements promoted by the Southand the resulting pluralism are challengingexisting institutions and processes in the traditionaldomains of multilateralism—finance,trade, investment and health—sometimes directlyand sometimes indirectly through alternativeregional and subregional systems. Globaland regional governance is becoming a multifacetedcombination of new arrangements andold structures that need collective nurturing inmultiple ways. Reforms in global institutionsmust be complemented by stronger cooperationwith regional institutions—and in somecases broader mandates for those regional institutions.The accountability of organizationsmust be extended to a wider group of countries,as well as to a wider group of stakeholders.Many of the current institutions and principlesfor international governance were designedfor a world order that does not matchcontemporary reality. One consequence isthat these institutions greatly underrepresentthe South. If they are to survive, internationalinstitutions need to be more representative,transparent and accountable. Indeed, someintergovernmental processes would be invigoratedby greater participation from the South,which can bring substantial financial, technologicaland human resources.In all of this, governments are understandablyconcerned with preserving nationalsovereignty. Overly strict adherence to theprimacy of national sovereignty can encouragezero-sum thinking. A better strategy is responsiblesovereignty, whereby countries engage infair, rule-based and accountable internationalcooperation, joining in collective endeavoursthat enhance global welfare. Responsible sovereigntyalso requires that states ensure the humanrights security and safety of their citizens.According to this view, sovereignty is seen notjust as a right but as a responsibility.This changing world has profound implicationsfor the provision of public goods. Areasof global international concern meriting urgentattention and cooperation include trade,migration and climate change. In some cases,public goods can be delivered by regionalinstitutions, which can avoid the polarizationthat slows progress in larger, multilateral forums.Increasing regional cooperation may,however, have disadvantages—adding to acomplex, multi level and fragmented tapestryof institutions. The challenge therefore is toensure “coherent pluralism”—so that institutionsat all levels work in a broadly coordinatedfashion.International governance institutions can beheld to account not just by member states, butalso by global civil society. Civil society organizationshave already influenced global transparencyand rule setting on aid, debt, humanrights, health and climate change. Civil societynetworks can now take advantage of new mediaand new communications technologies. Yetcivil society organizations also face questionsabout their legitimacy and accountability andmay take undesirable forms. Nevertheless, thefuture legitimacy of international governancewill depend on the capabilities of institutionsto engage with citizen networks andcommunities.12 | Human <strong>Development</strong> Report 2013
Conclusions: partnersin a new eraMany countries of the South have alreadydemonstrated what can be done to ensurethat human development proceeds in waysthat are both productive and sustainable, butthey have gone only part of the way. For theyears ahead, the Report suggests five broadconclusions.Rising economic strength in theSouth must be matched by a fullcommitment to human developmentInvestments in human development are justifiednot only on moral grounds, but alsobecause improvements in health, educationand social welfare are key to success in a morecompetitive and dynamic world economy. Inparticular, these investments should target thepoor—connecting them to markets and increasingtheir livelihood opportunities. Povertyis an injustice that can and should be remediedby determined action.Good policymaking also requires greaterfocus on enhancing social capacities, not justindividual capabilities. Individuals functionwithin social institutions that can limit orenhance their development potential. Policiesthat change social norms that limit human potential,such as strictures against early marriagesor dowry requirements, can open up additionalopportunities for individuals to reach their fullpotential.Less developed countries can learnand benefit from the success ofemerging economies in the SouthThe unprecedented accumulation of financialreserves and sovereign wealth funds in theSouth as well as the North provides an opportunityto accelerate broad-based progress.Even a small portion of these funds dedicatedto human development and poverty eradicationcould have a large effect. At the sametime South–South trade and investment flowscan leverage foreign markets in new ways thatenhance development opportunities, such asby participating in regional and global valuechains.Burgeoning South–South trade and investmentin particular can lay the basis for shiftingmanufacturing capacity to other less developedregions and countries. Recent Chinese andIndian joint ventures and startup manufacturinginvestments in Africa serve as a preludeto a much expanded force. International productionnetworks provide opportunities tospeed up the development process by allowingcountries to leap-frog to more sophisticatedproduction modes.New institutions and new partnershipscan facilitate regional integrationand South–South relationshipsNew institutions and partnerships can helpcountries share knowledge, experiences andtechnology. This can be accompanied by newand stronger institutions to promote trade andinvestment and accelerate experience sharingacross the South. One step would be to establisha new South Commission to bring a freshvision of how the diversity of the South can bea force for solidarity.Greater representation for the Southand civil society can accelerateprogress on major global challengesThe rise of the South is leading to a greaterdiversity of voice on the world stage. Thisrepresents an opportunity to build governanceinstitutions that fully represent all constituenciesthat would make productive use of this diversityin finding solutions to world problems.New guiding principles for international organizationsare needed which incorporate theexperience of the South. The emergence of theGroup of 20 is an important step in this direction,but the countries of the South also needmore equitable representation in the BrettonWoods institutions, the <strong>United</strong> <strong>Nations</strong> andother international bodies.Active civil society and social movements,both national and transnational, are usingthe media to amplify their calls for just andfair governance. The spread of movementsand increasing platforms for vocalizing keymessages and demands challenge governanceinstitutions to adapt more-democratic andmore-inclusive principles. More generally, aThe unprecedentedaccumulation of financialreserves provides anopportunity to acceleratebroad-based progressSummary | 13
The rise of theSouth presents newopportunities for providingglobal public goodsmore effectively and forunlocking today’s manystalemated global issuesfairer and less unequal world requires spacefor a multiplicity of voices and a system ofpublic discourse.The rise of the South presentsnew opportunities for generatinga greater supply of public goodsA sustainable world requires a greater supplyof global public goods. Global issues todayare increasing in number and urgency, frommitigation of climate change and internationaleconomic and financial instability to the fightagainst terrorism and nuclear proliferation.They require a global response. Yet in many areas,international cooperation continues to beslow—and at times dangerously hesitant. Therise of the South presents new opportunitiesfor providing global public goods more effectivelyand for unlocking today’s many stalematedglobal issues.“Publicness” and “privateness” are in mostcases not innate properties of a public goodbut social constructs. As such, they represent apolicy choice. National governments can stepin when there is underprovision at the nationallevel, but when global challenges arise, internationalcooperation is necessary and can happenonly by voluntary action of many governments.Given the many pressing challenges, progress indetermining what is public and what is privatewill require strong, committed personal andinstitutional leadership.* * *The 2013 Human <strong>Development</strong> Report presentsthe contemporary global context and charts apath for policymakers and citizens to navigatethe increasing interconnectedness of the worldand to face the growing global challenges. It describeshow the dynamics of power, voice andwealth in the world are changing—and identifiesthe new policies and institutions necessaryto address these 21st century realities and promotehuman development with greater equity,sustainability and social integration. Progressin human development requires action and institutionsat both the global and national levels.At the global level, institutional reforms andinnovation are required to protect and provideglobal public goods. At the national level, statecommitment to social justice is important, asis the reality that one-size-fits-all technocraticpolicies are neither realistic nor effective giventhe diversity of national contexts, cultures andinstitutional conditions. Nevertheless, overarchingprinciples such as social cohesion, statecommitment to education, health and socialprotection, and openness to trade integrationemerge as means of navigating towards sustainableand equitable human development.14 | Human <strong>Development</strong> Report 2013
2012 HDI ranks and changes in rank from 2011 to 2012Afghanistan 175Albania 70 –1Algeria 93 –1Andorra 33 –1Angola 148Antigua and Barbuda 67 –1Argentina 45 –1Armenia 87 –1Australia 2Austria 18Azerbaijan 82 –1Bahamas 49Bahrain 48Bangladesh 146 1Barbados 38Belarus 50 1Belgium 17Belize 96Benin 166Bhutan 140 1Bolivia, Plurinational State of 108Bosnia and Herzegovina 81 –1Botswana 119 –1Brazil 85Brunei Darussalam 30Bulgaria 57Burkina Faso 183Burundi 178 –1Cambodia 138Cameroon 150Canada 11 –1Cape Verde 132 –1Central African Republic 180 –1Chad 184Chile 40China 101Colombia 91Comoros 169 –1Congo 142Congo, Democratic Republic of the 186Costa Rica 62Côte d'Ivoire 168 1Croatia 47 –1Cuba 59Cyprus 31Czech Republic 28Denmark 15Djibouti 164Dominica 72Dominican Republic 96 2Ecuador 89Egypt 112El Salvador 107 –1Equatorial Guinea 136Eritrea 181 1Estonia 33 1Ethiopia 173 –1Fiji 96 2Finland 21France 20Gabon 106Gambia 165→ → → → → → →→→ →→ →→ → → →→→→→→→ →→→Georgia 72 3Germany 5Ghana 135Greece 29Grenada 63 –1Guatemala 133Guinea 178 –1Guinea-Bissau 176Guyana 118 1Haiti 161 1Honduras 120Hong Kong, China (SAR) 13 1Hungary 37Iceland 13India 136Indonesia 121 3Iran, Islamic Republic of 76 –2Iraq 131 1Ireland 7Israel 16Italy 25Jamaica 85 –2Japan 10Jordan 100Kazakhstan 69 –1Kenya 145Kiribati 121Korea, Republic of 12Kuwait 54 –1Kyrgyzstan 125Lao People's Democratic Republic 138Latvia 44 1Lebanon 72Lesotho 158 1Liberia 174Libya 64 23Liechtenstein 24Lithuania 41 2Luxembourg 26Madagascar 151Malawi 170 1Malaysia 64 1Maldives 104 –1Mali 182 –1Malta 32 1Mauritania 155Mauritius 80 –1Mexico 61Micronesia, Federated States of 117Moldova, Republic of 113Mongolia 108 2Montenegro 52 –2Morocco 130Mozambique 185Myanmar 149Namibia 128Nepal 157Netherlands 4New Zealand 6Nicaragua 129Niger 186 1Nigeria 153 1→→ →→→ → →→→→ →→→ → → → → →→ →→→→→→ →Norway 1Oman 84 –1Pakistan 146Palau 52 2Palestine, State of 110 1Panama 59 1Papua New Guinea 156Paraguay 111 –2Peru 77 –1Philippines 114Poland 39Portugal 43 –3Qatar 36Romania 56 –1Russian Federation 55Rwanda 167Saint Kitts and Nevis 72 –1Saint Lucia 88Saint Vincent and the Grenadines 83 –2Samoa 96Sao Tome and Principe 144Saudi Arabia 57Senegal 154 –2Serbia 64Seychelles 46Sierra Leone 177 2Singapore 18Slovakia 35Slovenia 21Solomon Islands 143South Africa 121 1Spain 23Sri Lanka 92Sudan 171 –1Suriname 105Swaziland 141 –1Sweden 7Switzerland 9Syrian Arab Republic 116Tajikistan 125 1Tanzania, <strong>United</strong> Republic of 152 1Thailand 103 1The former Yugoslav Republic of Macedonia 78 –2Timor-Leste 134Togo 159 1Tonga 95Trinidad and Tobago 67 –1Tunisia 94Turkey 90Turkmenistan 102Uganda 161Ukraine 78<strong>United</strong> Arab Emirates 41 –1<strong>United</strong> Kingdom 26<strong>United</strong> States 3 –1Uruguay 51Uzbekistan 114 1Vanuatu 124 –2Venezuela, Bolivarian Republic of 71 –1Viet Nam 127Yemen 160 –2Zambia 163Zimbabwe 172 1→→ → →→ → → → → →→→→→ →→ → →→→→→ →→→ → →→Note: Positive or negative values and arrows indicate the number of positions upward or downward a country’s rank changed from 2011 to 2012 using consistent data and methodology; a blankindicates no change.Summary | 15
Human development indicesHDI rankHuman <strong>Development</strong>IndexInequality-adjustedHDIGender InequalityIndexMultidimensional PovertyIndexValue Value Rank Value Rank Value YearVery high human development1 Norway 0.955 0.894 1 0.065 5 ..2 Australia 0.938 0.864 2 0.115 17 ..3 <strong>United</strong> States 0.937 0.821 16 0.256 42 ..4 Netherlands 0.921 0.857 4 0.045 1 ..5 Germany 0.920 0.856 5 0.075 6 ..6 New Zealand 0.919 .. .. 0.164 31 ..7 Ireland 0.916 0.850 6 0.121 19 ..7 Sweden 0.916 0.859 3 0.055 2 ..9 Switzerland 0.913 0.849 7 0.057 3 ..10 Japan 0.912 .. .. 0.131 21 ..11 Canada 0.911 0.832 13 0.119 18 ..12 Korea, Republic of 0.909 0.758 28 0.153 27 ..13 Hong Kong, China (SAR) 0.906 .. .. .. .. ..13 Iceland 0.906 0.848 8 0.089 10 ..15 Denmark 0.901 0.845 9 0.057 3 ..16 Israel 0.900 0.790 21 0.144 25 ..17 Belgium 0.897 0.825 15 0.098 12 ..18 Austria 0.895 0.837 12 0.102 14 ..18 Singapore 0.895 .. .. 0.101 13 ..20 France 0.893 0.812 18 0.083 9 ..21 Finland 0.892 0.839 11 0.075 6 ..21 Slovenia 0.892 0.840 10 0.080 8 0.000 200323 Spain 0.885 0.796 20 0.103 15 ..24 Liechtenstein 0.883 .. .. .. .. ..25 Italy 0.881 0.776 24 0.094 11 ..26 Luxembourg 0.875 0.813 17 0.149 26 ..26 <strong>United</strong> Kingdom 0.875 0.802 19 0.205 34 ..28 Czech Republic 0.873 0.826 14 0.122 20 0.010 2002/200329 Greece 0.860 0.760 27 0.136 23 ..30 Brunei Darussalam 0.855 .. .. .. .. ..31 Cyprus 0.848 0.751 29 0.134 22 ..32 Malta 0.847 0.778 23 0.236 39 ..33 Andorra 0.846 .. .. .. .. ..33 Estonia 0.846 0.770 25 0.158 29 0.026 200335 Slovakia 0.840 0.788 22 0.171 32 0.000 200336 Qatar 0.834 .. .. 0.546 117 ..37 Hungary 0.831 0.769 26 0.256 42 0.016 200338 Barbados 0.825 .. .. 0.343 61 ..39 Poland 0.821 0.740 30 0.140 24 ..40 Chile 0.819 0.664 41 0.360 66 ..41 Lithuania 0.818 0.727 33 0.157 28 ..41 <strong>United</strong> Arab Emirates 0.818 .. .. 0.241 40 0.002 200343 Portugal 0.816 0.729 32 0.114 16 ..44 Latvia 0.814 0.726 35 0.216 36 0.006 200345 Argentina 0.811 0.653 43 0.380 71 0.011 200546 Seychelles 0.806 .. .. .. .. ..47 Croatia 0.805 0.683 39 0.179 33 0.016 2003High human development48 Bahrain 0.796 .. .. 0.258 45 ..49 Bahamas 0.794 .. .. 0.316 53 ..50 Belarus 0.793 0.727 33 .. .. 0.000 200551 Uruguay 0.792 0.662 42 0.367 69 0.006 2002/200352 Montenegro 0.791 0.733 31 .. .. 0.006 2005/200652 Palau 0.791 .. .. .. .. ..54 Kuwait 0.790 .. .. 0.274 47 ..55 Russian Federation 0.788 .. .. 0.312 51 0.005 200356 Romania 0.786 0.687 38 0.327 55 ..57 Bulgaria 0.782 0.704 36 0.219 38 ..57 Saudi Arabia 0.782 .. .. 0.682 145 ..59 Cuba 0.780 .. .. 0.356 63 ..59 Panama 0.780 0.588 57 0.503 108 ..61 Mexico 0.775 0.593 55 0.382 72 0.015 200616 | Human <strong>Development</strong> Report 2013
HDI rankHuman <strong>Development</strong>IndexInequality-adjustedHDIGender InequalityIndexMultidimensional PovertyIndexValue Value Rank Value Rank Value Year62 Costa Rica 0.773 0.606 54 0.346 62 ..63 Grenada 0.770 .. .. .. .. ..64 Libya 0.769 .. .. 0.216 36 ..64 Malaysia 0.769 .. .. 0.256 42 ..64 Serbia 0.769 0.696 37 .. .. 0.003 2005/200667 Antigua and Barbuda 0.760 .. .. .. .. ..67 Trinidad and Tobago 0.760 0.644 49 0.311 50 0.020 200669 Kazakhstan 0.754 0.652 44 0.312 51 0.002 200670 Albania 0.749 0.645 48 0.251 41 0.005 2008/200971 Venezuela, Bolivarian Republic of 0.748 0.549 66 0.466 93 ..72 Dominica 0.745 .. .. .. .. ..72 Georgia 0.745 0.631 51 0.438 81 0.003 200572 Lebanon 0.745 0.575 59 0.433 78 ..72 Saint Kitts and Nevis 0.745 .. .. .. .. ..76 Iran, Islamic Republic of 0.742 .. .. 0.496 107 ..77 Peru 0.741 0.561 62 0.387 73 0.066 200878 The former Yugoslav Republic of Macedonia 0.740 0.631 51 0.162 30 0.008 200578 Ukraine 0.740 0.672 40 0.338 57 0.008 200780 Mauritius 0.737 0.639 50 0.377 70 ..81 Bosnia and Herzegovina 0.735 0.650 45 .. .. 0.003 200682 Azerbaijan 0.734 0.650 45 0.323 54 0.021 200683 Saint Vincent and the Grenadines 0.733 .. .. .. .. ..84 Oman 0.731 .. .. 0.340 59 ..85 Brazil 0.730 0.531 70 0.447 85 0.011 200685 Jamaica 0.730 0.591 56 0.458 87 ..87 Armenia 0.729 0.649 47 0.340 59 0.001 201088 Saint Lucia 0.725 .. .. .. .. ..89 Ecuador 0.724 0.537 69 0.442 83 0.009 200390 Turkey 0.722 0.560 63 0.366 68 0.028 200391 Colombia 0.719 0.519 74 0.459 88 0.022 201092 Sri Lanka 0.715 0.607 53 0.402 75 0.021 200393 Algeria 0.713 .. .. 0.391 74 ..94 Tunisia 0.712 .. .. 0.261 46 0.010 2003Medium human development95 Tonga 0.710 .. .. 0.462 90 ..96 Belize 0.702 .. .. 0.435 79 0.024 200696 Dominican Republic 0.702 0.510 80 0.508 109 0.018 200796 Fiji 0.702 .. .. .. .. ..96 Samoa 0.702 .. .. .. .. ..100 Jordan 0.700 0.568 60 0.482 99 0.008 2009101 China 0.699 0.543 67 0.213 35 0.056 2002102 Turkmenistan 0.698 .. .. .. .. ..103 Thailand 0.690 0.543 67 0.360 66 0.006 2005/2006104 Maldives 0.688 0.515 76 0.357 64 0.018 2009105 Suriname 0.684 0.526 72 0.467 94 0.039 2006106 Gabon 0.683 0.550 65 0.492 105 ..107 El Salvador 0.680 0.499 83 0.441 82 ..108 Bolivia, Plurinational State of 0.675 0.444 85 0.474 97 0.089 2008108 Mongolia 0.675 0.568 60 0.328 56 0.065 2005110 Palestine, State of 0.670 .. .. .. .. 0.005 2006/2007111 Paraguay 0.669 .. .. 0.472 95 0.064 2002/2003112 Egypt 0.662 0.503 82 0.590 126 0.024 2008113 Moldova, Republic of 0.660 0.584 58 0.303 49 0.007 2005114 Philippines 0.654 0.524 73 0.418 77 0.064 2008114 Uzbekistan 0.654 0.551 64 .. .. 0.008 2006116 Syrian Arab Republic 0.648 0.515 76 0.551 118 0.021 2006117 Micronesia, Federated States of 0.645 .. .. .. .. ..118 Guyana 0.636 0.514 78 0.490 104 0.030 2009119 Botswana 0.634 .. .. 0.485 102 ..120 Honduras 0.632 0.458 84 0.483 100 0.159 2005/2006121 Indonesia 0.629 0.514 78 0.494 106 0.095 2007121 Kiribati 0.629 .. .. .. .. ..121 South Africa 0.629 .. .. 0.462 90 0.057 2008Human development inDICes | 17
HDI rankHuman <strong>Development</strong>IndexInequality-adjustedHDIGender InequalityIndexMultidimensional PovertyIndexValue Value Rank Value Rank Value Year124 Vanuatu 0.626 .. .. .. .. 0.129 2007125 Kyrgyzstan 0.622 0.516 75 0.357 64 0.019 2005/2006125 Tajikistan 0.622 0.507 81 0.338 57 0.068 2005127 Viet Nam 0.617 0.531 70 0.299 48 0.017 2010/2011128 Namibia 0.608 0.344 101 0.455 86 0.187 2006/2007129 Nicaragua 0.599 0.434 86 0.461 89 0.128 2006/2007130 Morocco 0.591 0.415 88 0.444 84 0.048 2007131 Iraq 0.590 .. .. 0.557 120 0.059 2006132 Cape Verde 0.586 .. .. .. .. ..133 Guatemala 0.581 0.389 92 0.539 114 0.127 2003134 Timor-Leste 0.576 0.386 93 .. .. 0.360 2009/2010135 Ghana 0.558 0.379 94 0.565 121 0.144 2008136 Equatorial Guinea 0.554 .. .. .. .. ..136 India 0.554 0.392 91 0.610 132 0.283 2005/2006138 Cambodia 0.543 0.402 90 0.473 96 0.212 2010138 Lao People’s Democratic Republic 0.543 0.409 89 0.483 100 0.267 2006140 Bhutan 0.538 0.430 87 0.464 92 0.119 2010141 Swaziland 0.536 0.346 99 0.525 112 0.086 2010Low human development142 Congo 0.534 0.368 96 0.610 132 0.208 2009143 Solomon Islands 0.530 .. .. .. .. ..144 Sao Tome and Principe 0.525 0.358 97 .. .. 0.154 2008/2009145 Kenya 0.519 0.344 101 0.608 130 0.229 2008/2009146 Bangladesh 0.515 0.374 95 0.518 111 0.292 2007146 Pakistan 0.515 0.356 98 0.567 123 0.264 2006/2007148 Angola 0.508 0.285 114 .. .. ..149 Myanmar 0.498 .. .. 0.437 80 ..150 Cameroon 0.495 0.330 104 0.628 137 0.287 2004151 Madagascar 0.483 0.335 103 .. .. 0.357 2008/2009152 Tanzania, <strong>United</strong> Republic of 0.476 0.346 99 0.556 119 0.332 2010153 Nigeria 0.471 0.276 119 .. .. 0.310 2008154 Senegal 0.470 0.315 105 0.540 115 0.439 2010/2011155 Mauritania 0.467 0.306 107 0.643 139 0.352 2007156 Papua New Guinea 0.466 .. .. 0.617 134 ..157 Nepal 0.463 0.304 109 0.485 102 0.217 2011158 Lesotho 0.461 0.296 111 0.534 113 0.156 2009159 Togo 0.459 0.305 108 0.566 122 0.284 2006160 Yemen 0.458 0.310 106 0.747 148 0.283 2006161 Haiti 0.456 0.273 120 0.592 127 0.299 2005/2006161 Uganda 0.456 0.303 110 0.517 110 0.367 2011163 Zambia 0.448 0.283 117 0.623 136 0.328 2007164 Djibouti 0.445 0.285 114 .. .. 0.139 2006165 Gambia 0.439 .. .. 0.594 128 0.324 2005/2006166 Benin 0.436 0.280 118 0.618 135 0.412 2006167 Rwanda 0.434 0.287 112 0.414 76 0.350 2010168 Côte d’Ivoire 0.432 0.265 122 0.632 138 0.353 2005169 Comoros 0.429 .. .. .. .. ..170 Malawi 0.418 0.287 112 0.573 124 0.334 2010171 Sudan 0.414 .. .. 0.604 129 ..172 Zimbabwe 0.397 0.284 116 0.544 116 0.172 2010/2011173 Ethiopia 0.396 0.269 121 .. .. 0.564 2011174 Liberia 0.388 0.251 123 0.658 143 0.485 2007175 Afghanistan 0.374 .. .. 0.712 147 ..176 Guinea-Bissau 0.364 0.213 127 .. .. ..177 Sierra Leone 0.359 0.210 128 0.643 139 0.439 2008178 Burundi 0.355 .. .. 0.476 98 0.530 2005178 Guinea 0.355 0.217 126 .. .. 0.506 2005180 Central African Republic 0.352 0.209 129 0.654 142 ..181 Eritrea 0.351 .. .. .. .. ..182 Mali 0.344 .. .. 0.649 141 0.558 2006183 Burkina Faso 0.343 0.226 124 0.609 131 0.535 2010184 Chad 0.340 0.203 130 .. .. 0.344 2003185 Mozambique 0.327 0.220 125 0.582 125 0.512 2009186 Congo, Democratic Republic of the 0.304 0.183 132 0.681 144 0.392 2010186 Niger 0.304 0.200 131 0.707 146 0.642 200618 | Human <strong>Development</strong> Report 2013
HDI rankHuman <strong>Development</strong>IndexInequality-adjustedHDIGender InequalityIndexMultidimensional PovertyIndexValue Value Rank Value Rank Value YearOther countries or territoriesKorea, Democratic People’s Rep. of .. .. .. .. .. ..Marshall Islands .. .. .. .. .. ..Monaco .. .. .. .. .. ..Nauru .. .. .. .. .. ..San Marino .. .. .. .. .. ..Somalia .. .. .. .. .. 0.514 2006South Sudan .. .. .. .. .. ..Tuvalu .. .. .. .. .. ..Human <strong>Development</strong> Index groupsVery high human development 0.905 0.807 — 0.193 — —High human development 0.758 0.602 — 0.376 — —Medium human development 0.640 0.485 — 0.457 — —Low human development 0.466 0.310 — 0.578 — —RegionsArab States 0.652 0.486 — 0.555 — —East Asia and the Pacific 0.683 0.537 — 0.333 — —Europe and Central Asia 0.771 0.672 — 0.280 — —Latin America and the Caribbean 0.741 0.550 — 0.419 — —South Asia 0.558 0.395 — 0.568 — —Sub-Saharan Africa 0.475 0.309 — 0.577 — —Least developed countries 0.449 0.303 — 0.566 — —Small island developing states 0.648 0.459 — 0.481 — —World 0.694 0.532 — 0.463 — —NoteThe indices use data from different years—see the Statistical annex of the full Report (available at http://hdr.undp.org) for details and for complete notes and sources on the data. Country classifications are based on HDIquartiles: a country is in the very high group if its HDI is in the top quartile, in the high group if its HDI is in percentiles 51–75, in the medium group if its HDI is in percentiles 26–50 and in the low group if its HDI is in thebottom quartile. Previous Reports used absolute rather than relative thresholds.Human development inDICes | 19
Global Human <strong>Development</strong> Reports: The 2013 Human <strong>Development</strong> Report is the latest in the series of global Human<strong>Development</strong> Reports published by UNDP since 1990 as independent, empirically grounded analyses of major developmentissues, trends, and policies.Additional resources related to the 2013 Human <strong>Development</strong> Report can be found on line at hdr.undp.org, including completeeditions or summaries of the Report in more than 20 languages; a collection of Human <strong>Development</strong> Research Papers commissionedfor the 2013 Report; interactive maps and databases of national human development indicators; full explanations ofthe sources and methodologies employed in the Report’s human development indices; country profiles; and other backgroundmaterials. Previous global, regional and national Human <strong>Development</strong> Reports (HDRs) are also available at hdr.undp.org.Regional Human <strong>Development</strong> Reports: Over the past two decades, regionally focused HDRs have also been produced in allmajor areas of the developing world, with support from UNDP’s regional bureaus. With provocative analyses and clear policyrecommendations, these regional HDRs have examined such critical issues as political empowerment in the Arab states, foodsecurity in Africa, climate change in Asia, the treatment of ethnic minorities in Central Europe, and the challenges of inequalityand citizens’ security in Latin America and the Caribbean.National Human <strong>Development</strong> Reports: Since the release of the first National HDR in 1992, National HDRs have been producedin 140 countries by local editorial teams with UNDP support. These reports—some 700 to date—bring a human developmentperspective to national policy concerns through local consultations and research. National HDRs have covered many keydevelopment issues, from climate change to youth employment to inequalities driven by gender or ethnicity.Human <strong>Development</strong> Reports 1990–20131990 Concept and Measurement of Human <strong>Development</strong>1991 Financing Human <strong>Development</strong>1992 Global Dimensions of Human <strong>Development</strong>1993 People’s Participation1994 New Dimensions of Human Security1995 Gender and Human <strong>Development</strong>1996 Economic Growth and Human <strong>Development</strong>1997 Human <strong>Development</strong> to Eradicate Poverty1998 Consumption for Human <strong>Development</strong>1999 Globalization with a Human Face2000 Human Rights and Human <strong>Development</strong>2001 Making New Technologies Work for Human <strong>Development</strong>2002 Deepening Democracy in a Fragmented World2003 Millennium <strong>Development</strong> Goals: A Compact among <strong>Nations</strong> to End Human Poverty2004 Cultural Liberty in Today’s Diverse World2005 International Cooperation at a Crossroads: Aid, Trade and Security in an Unequal World2006 Beyond Scarcity: Power, Poverty and the Global Water Crisis2007/2008 Fighting Climate Change: Human Solidarity in a Divided World2009 Overcoming Barriers: Human Mobility and <strong>Development</strong>2010 The Real Wealth of <strong>Nations</strong>: Pathways to Human <strong>Development</strong>2011 Sustainability and Equity: A Better Future for All2013 The Rise of the South: Human Progress in a Diverse World
<strong>United</strong> <strong>Nations</strong> <strong>Development</strong> <strong>Programme</strong>One <strong>United</strong> <strong>Nations</strong> PlazaNew York, NY 10017www.undp.orgEmpowered lives.Resilient nations.The 21st century is witnessing a profound shift in globaldynamics, driven by the fast-rising new powers of thedeveloping world. China has overtaken Japan as theworld’s second biggest economy, lifting hundreds ofmillions of people out of poverty in the process. India isreshaping its future with new entrepreneurial creativityand social policy innovation. Brazil is raising its livingstandards by expanding international relationships andantipoverty programmes that are emulated worldwide.But the “Rise of the South” is a much larger phenomenon.Indonesia, Mexico, South Africa, Thailand,Turkey and other developing countries are becomingleading actors on the world stage. The 2013 Human<strong>Development</strong> Report identifies more than 40 developingcountries that have done better than expected in humandevelopment in recent decades, with their progressaccelerating markedly over the past 10 years.Each of these countries has its own unique historyand has chosen its own distinct development pathway.Yet they share important characteristics and facemany of the same challenges. They are also becomingmore interconnected and interdependent. And peoplethroughout the developing world are increasinglydemanding to be heard, as they share ideas through newcommunications channels and seek greater accountabilityfrom governments and international institutions.The 2013 Human <strong>Development</strong> Report analyses thecauses and consequences of the continuing “Rise ofthe South” and identifies policies rooted in this newreality that could promote greater progress throughoutthe world for decades to come. The Report calls for farbetter representation of the South in global governancesystems and points to potential new sources offinancing within the South for essential public goods.With fresh analytical insights and clear proposals forpolicy reforms, the Report charts a course for peoplein all regions to face shared human developmentchallenges together, fairly and effectively.“The Report refreshes our understanding of the current state of global development, and demonstrates how much can belearned from the experiences of fast development progress in so many countries in the South.”—UNDP Administrator Helen Clark, from the Foreword“The human development approach is a major advance in the difficult exercise of understanding the successes anddeprivations of human lives, and in appreciating the importance of reflection and dialogue, and through that advancingfairness and justice in the world.” —Nobel Laureate Amartya Sen, from chapter 1“No one has a monopoly on good ideas, which is why New York will continue to learn from the best practices of other citiesand countries.” —New York City Mayor Michael Bloomberg, from chapter 3“A close look at the diverse pathways that successful developing countries have pursued enriches the menu of policyoptions for all countries and regions.” —Report lead author Khalid Malik, from the Introduction