DOCUMENI
DOCUMENI
DOCUMENI

Create successful ePaper yourself
Turn your PDF publications into a flip-book with our unique Google optimized e-Paper software.
OCUMENIORX/R64.2Ag7x/c.2AGRICULTURAL WATER USE INVENTORY FOR THE BEAR CREEK BASINA Portion of the"20501" REGIONAL WATER RESOURCES PLANAuthorized and Submitted by the Aqricultural CommunityBear Creek BasinReport Prepared ByERIC DITTMERI FSeptember, 1993
DEDICATIONThis paper is dedicated to the memory of Clifford Cordy,former Oregon State University Extension Agent in JacksonCounty. His knowledge, enthusiasm and energy helpedagriculture through many crises since the mid 1930's.This report was funded by the Rogue Valley Water User'sAssociation, Fruit Grower's League of Jackson County Inc.and the Rogue Valley Council of Governments.Cover photograph courtesyJackson Soil and Water ConservationDistrict- i i i i -
ACKNOWLEDGEMENTSThis report benefitted from the knowledge and generous inputprovided by the following people who represent the broadinterests of agriculture in the Bear Creek Basin.Irrigation DistrictsHazel Brown, Manager, Eagle Point Irrigation DistrictBill Caldwell, Manager, Medford Irrigation DistrictHollie Cannon, Manager, Talent Irrigation DistrictJim Pendleton, Manager, Rogue River Valley Irrigation DistrictWalt Hoffbuhr, Manager, Talent Irrigation District (retired)AgricultureLarry Cauble, CattlemanEd Earnest, Owner, Earnest OrchardsPete Naumes, Manager, Naumes OrchardsJudson Parsons, Manager, Hillcrest OrchardsRon Henri, Vice President, Orchard Division Harry and DavidJackson Soil and Water Conservation District: John Billings,Nicola Giardina, Linda TowneRon Meyer, President, Fruit Grower's LeagueDon Minear, Farm BureauMike Russell, owner Russell FarmsDalton Straus, cattlemanSmall farm interests -Jim Hutchins, Loren WittenbergPlanningJim Eisenhard, Planning Director, City of MedfordLaurel Prairie Kuntz, Planning Director, Jackson CountyMarc Prevost, Water Resources Coordinator, RVCOGPublic AgenciesJerry Buchheim, Regional Manager, Bureau of ReclamationDave Duncan, Bureau of ReclamationMarc Cooper, Bureau of ReclamationJim Hill, Manager, Medford Water Quality Control PlantMike Howell, Extension Agent, OSU Extension ServiceSue Kupillas, Jackson County CommissionerBrian Lanning, Soil Conservation ServiceEd Olson, Manager, Medford Water CommissionEd Weber, Oregon Department of AgricultureState Watermaster's Office (Jackson County Courthouse):Bruce Sund, Larry Menteer, Sandy Bandy, Susie SmithDave Hendrix, former State watermaster, Jackson County- ii i--
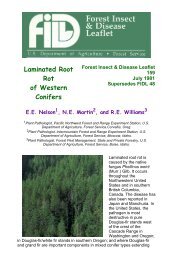
"2050" PLAN AGRICULTURAL WATER USE EXECUTIVE - SUMMARYI PRESENT CONDITIONSThe present water available to agriculture for wet, "normal" anddry years is Illustrated In the figure below,- 1 IRRIGATIONADISTRICT WATER AVAILABILITY AND NEED - v(ACRE FEET AT DIVERSION POINT)200 ,- 193 .* AVAIL*DEMAND '-R asORESERVEMMEOTr150 -1502 100 -Ed5ha~ 5 0.vD-4-4325-500 4-1/7)C=:)CT_,--3__j=Dr__T2CDII-43II FINDINGSThe current agricultural water resources are summarized below:* agricultural water resources are not adeauate to meetthe combination of existing irrigated lands, allpotentially irrigable lands and unmet stream flow waterrights even on wet years* Over 50,000 AF of water is needed to meet existingirrigation needs during drought periods* agriculture water resources are adequate to serveexisting irrigation needs during "normal" years (muchof the agricultural water resources not used during oneseason is reserved for future drought demands)* add i nq the demandJ-S of potentially irriqable acreages(6,000 AF) would further reduce reserves for carryover9 the annual use of 150,000 acre feet Gel irriqation waterpotentially benefits qround water n
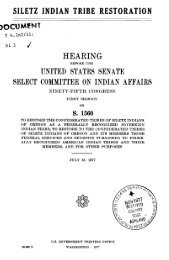
III FUTURE PROJECTIONSThe projections of future agricultural water needs must considersuch factors as urbanization, climate, conservation and newtechnology, additional water sources, new agricultural practicesand the possibility of marketing water for other uses. Some ofthese factors are summarized below.* agricultural water resources could increase by as muchas 50,000 acre feet by the year 2050 through additionalstorage, conservation and reclamation improvements* additional water resources will reduce the impacts of.future drought periods* Agriculture's need for water may remain constant assome new acreage may replace lands converted to urbanuses over the next 5 - 10 years.* the most significant issue affecting the future ofagriculture Is projected urban growth which couldreduce irrigated agricultural acreage and water demandssignificantly by the year 2050. The chart below showsthe agreage needed for urban land using currentdensities and a 2 % population growth rate.URBAN GROWTH &AGRICULTURE LAND USEPROJECTIONS AT 2.0% POPULATION GROWTH RATEoAgriculture MUrban90 82807 06760 554 8G~50 44413 83 0 24 28222 0 15 110~~~~~~~~~~~~~~~~~~~~~~1101992 2000 2010 2020 2030 2040 2050YEARUrban growth will occur. It is possible to encourage thatdevelopment away from prime resource lands. It is up to societyto support agriculture in preservlnQ aqriculture as a food and a,uat lity o+ life resource for tlc fut ur'-.
AGRICULTURAL WATERAGRICULTURAL WATER USE INVENTORYFOR THE BEAR CREEK BASINTable of ContentsPageDedication . . . . . . . . . . . . . . . . . . . . . . .Acknowledgements . . . . . . . . . . . . . . . . . . . .Executive Summary . . . . . . . . . . . . . . . . . . . . iTable of Contents ... . . . . . . . . . . . . . . . . .PART ONE - CURRENT AGRICULTURAL WATER INVENTORY . . . .1A. INTRODUCTION . . . . . . . . . . . . . . . . . . . . 1Background.1. ........Purpose.1. . .......Approach and Scope . . . . . . . . . . . . . . . . 1B. AGRICULTURE IN THE BEAR CREEK BASIN . . . . . . . . 4Historical Overview . . . . . . . . . . . . . . . . 4Climate . . . . . . . . . . . . . . . . . . . . . . 4Present Agricultural Setting . . . . . . . . . . . 4C. PRESENT AGRICULTURAL WATER USE . . . . . . . . . . . 5Agriculture Water Supply and Distribution System . . 5Water Available to Agriculture . . . . . . . . . . . 10Agricultural Water Supply and Demand . . . . . . . . 12Typical years .. . . . . . . . . . . . . . . . 12Low water years . . . . . . . . . . . . . . . . 15Current additional demands . . . . . . . . . . 16D. Summary - Current Agricultural Water Resources . . . 16PART TWO - FUTURE AGRICULTURAL WATER NEEDS . . . . . . . 17A. Issues Affecting Agricultural Water Use . . . . . . 17B. Priority Issues and Projections . . . . . . . . . . 17Urbanization . . . . . . . . . . . . . . . . . 18Climate . . . . . . . . . . . . . . . 22Conservation and technology . . . . . . . . . . 24Water marketing . . . . . . . . . . . . . . . . 25Environmental issues . . . . . . . . . . . . . 25other . . . . . . . . . . . . . . . . . . . . . 25C. Future Agriculture Water Sources . . . . . . . . . 27Storage . . . . . . . . . . . . . . . . . . . 27Importation . . . . . . . . . I . . . . . . . . 27Reclamation . ...... 27Conservation and new technology . . . . . . . . 28Summary, future water sources . . . . . . . . . 28-1-
D. Relationship of Agricultural Needs to Supply . . . . JU1. Current agricultural setting . . . . . . . . . . . 302. Future projections ...... . .. .. . .. . . 30PART THREE - RESPONSE TO AGRICULTURAL WATER ISSUES . . . 31A. Relationship to Other Water Uses . . . . . . . . . . 31B. A Possible Approach ................ . 31C. Regional Coordination . . . . . . . . . . . . . . . . 32D Recommendation . . . . . . . . . . . . . . . . . . . 32SUMMARY . . . . . . . . . . . . . . . . . . . . . . . . . 33LIST OF FIGURES1. Study Area Map, Bear Creek Basin . . . . . . . . . . . . 32. Irrigation District Boundaries . . . . . . . . . . . . . 63a. Nature and Distribution of Bear Creek Flows . . . . . . 7b. Monthly distribution of precipitation . . . . . . . . . 7c. Precipitation totals 1983 - 1992 . . . . . . . . . . . 74. Agricultural Water Needs and Supply . . . . . . . . . . 145. Population Projections ................ . 196 a. Urban Growth Land Use Projections (1.2%) . . . . . . . 19b. Urban Growth Land Use Projections (2%) . . . . . . . . 207. Current Urban Development Pattern - Study area . . . . . 21LIST OF TABLES1. Stored Water and Stream Flow by Irrigation District 92. Water Available for Agriculture . . . . . . . . . . . . 113. Average Irrigation Requirements per Acre . . . . . . . 134. Irrigation District Water Needs and Resources. . . . . . 135. Issues Affecting Future Agricultural Demands . . . . . . 176. Summary - Future Agricultural Water Sources . . . . . . 29LIST OF ATTACHMENTS1. History of Agriculture2. Bear Creek Climate Data3. Estimated Value of Agricultural Production - 19924. Summary - Bear Creek Water Rights5. Water Supply Conditions, Western United States6. Agricultural Needs Information, Bear Creek7. Summary, Agrimet and Hydromet Systems8. Summary, "Opportunities for System Improvement"
AGRICULTURAL WATER USE INVENTORYFOR THE BEAR CREEK BASINA Part of the "2050" Regional Water Resources PlanPART ONE -CURRENT AGRICULTURAL WATER INVENTORYA. INTRODUCTIONBackgroundWater is a critical resource for everyone. In the BearCreek Valley people are dependent on water for domestic,agricultural, industrial, recreational and wildlife habitatuses. Water resources are limited. There are times whenvirtually all beneficial uses of water are not completelysatisfied.The drought conditions since the mid 1980's illustrated thenature of these limitations. Water users realized that morelong term planning was needed to assess future water needsand supplies. Various water users Joined together todiscuss their shared concerns. The Rogue Valley Council ofGovernments (RVCOG) helped form a Water Resources Committeeto address the water situation on a regional basis. Subgroups were formed to determine:1) the total amount of water available to the Valley2) the water needed for domestic uses3) the water needed for agricultural uses4) the water needed for instream uses.Once these volumes were estimated and totalled the committeecould begin to work out long term plans to deal with currentand projected water shortfalls. This paper represents theagricultural water use part of the overall Water ResourcesPlan for the Bear Creek Basin.PurposeThe purpose of this inventory is to summarize the currentand future water needs for agricultural production in theBear Creek Basin including Eagle Point and the Eagle PointIrrigation District.ApproachPart one of the report inventories the sources and amountsof water available for irrigation and other agriculturaluses with emphasis on the water provided by each irrigationdistrict. The summer irrigation season deliveries,individual water rights and frost control waters areincluded as part of this inventory.-1-
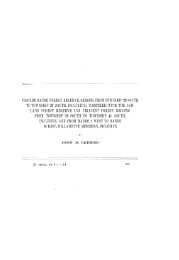
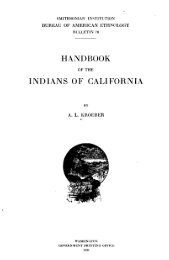
The term "irrigated agriculture" includes those areas servedby the four irrigation districts (commercial andnon-commercial crops) as well as any smaller parcels andother uses subject to irrigation water rights.Part one of the report will evaluate agricultural demandsfor a variety of conditions including wet and dry years.Part two of the report will project water needs foragriculture into the future. This projection will considerestimates of the effects of population growth, impacts ofconservation efforts, district "prove up" conclusions,legislation affecting agriculture, facility improvements,and any new water sources such as use of reclaimed water.Part three of the report is a discussion of the relationshipof agriculture to other water needs and how the agriculturalcommunity might address the issues raised on a regionalbasis.The water needed for processing agricultural products can beconsiderable. This water comes from urban source watersupplies and is covered in the municipal report portion ofthe overall water resources inventory.The source of information is the agricultural communityincluding farmers, ranchers, and agricultural organizationssuch as the Fruit Grower's League, Rogue Basin Water UsersAssociation, Farm Bureau, Soil Conservation Service, OSUExtension Service, Bureau of Reclamation, U. S. GeologicalSurvey, Oregon Water Resources Department, Oregon Departmentof Agriculture and other related interests as appropriate.These and other contributors to the report are listed underAcknowledgements.The "Bear creek Basin" study area includes the Bear CreekValley and the area around Eagle Point served by the EaglePoint Irrigation District (Fig. 1). The solid boundary linerepresents the actual study area for acreage-and waterapplication calculations. The dashed line indicates thoseareas that provide additional water or influence the amountof water available to the study area.Water imported into this area from other basins is includedas it is a resource available to agriculture in the studyarea.--2 -
aSar, 39 3cNa. all a a3I.0ml&e WIaS3aIV;.i_I./r aouanTJuI Jo e0VeaiV ApnjSorlVaaV Aufl.LS NISVq XHaŽID HVs
Historical overviewA brief summary of the history of agriculture and irrigationcompiled by the Bureau of Reclamation in a 1990 report isprovided in Attachment 1. A detailed historical overview ofagricultural development entitled, "History of the RogueValley Fruit Industry" is on file at the Rogue ValleyCouncil of Governments (Cordy, 1977). See the dedication.climateAttachment 2 summarizes the climate relating to agriculturalwater sources as found in the Rogue Basin Plan (OWRD,1985). Rainfall and temperature conditions varyconsiderably in Jackson County due to the varying geagraphy.Present Agricultural SettincaAgriculture in the Bear Creek Basin includes row crops,extensive orchards, irrigated pastures, specialty crops andmany smaller parcels, sometimes called "hobby farms" whereagricultural return is only a part of the owner's income. Adetailed countywide description of the relative production,cash value and acreages of these agricultural activities for1992 compiled by the OSU Extension Service is found inAttachment 3. The Bear Creek Basin dominates thisagricultural productivity.According to a 1993 survey of irrigation district managers,the four irrigation districts serve approximately 6,600parcels totalling 43,674 acres with an average parcel sizeof about 7 acres according to district managers.There are additional demands for water. Local irrigationdistricts have several hundred applications on file frompeople who would like to receive water but who are not nowpart of these districts. This represents a potentialincrease in irrigated land in the future.The agricultural community is concerned about the adequacyand reliability of their water supplies, a portion of whichis imported from another basin. There was not enough wateravailable during recent drought periods to meet currentirrigation demands.There are concerns about the future of agriculture as aresult of growing urbanization pressures. Also,urban/agricultural conflicts affect the cost of operationespecially for the commercial farmers and ranchers.Irrigation districts in the Bear Creek Valley are undergoinga "prove up" by the Oregon Water Resources Department toverify the ability to provide water to users within theirdistrict. No major changes in the districts' service areasare expected. However, the exact acreage of water rightusers in the Bear Creek Valley will not be known until the"prove up" is completed in 1994 or 1995.-4 -
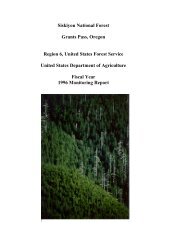
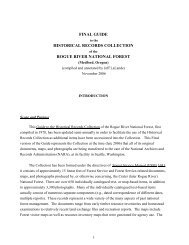
C. PRESENT AGRICULTURAL WATER USE1. Agricultural Water supply and Distribution SystemDue to the lack of adequate precipitation during the growingseason, most commercial agriculture crops depend onirrigation to supplement water needs. Commercial andnon-commercial agriculture in the Bear Creek study areaobtain water primarily from surface sources includingreservoir storage and stream flows.According to the U. S. Geological Survey, only about 2% ofthe local irrigation water comes from ground water sources(USGS, 1993 draft, unpublished data).Approximately 60% of the Irrigation water comes fromreservoir storage and 40% from streamflow. The water isdistributed in the basin by four irrigation districts.These districts hold most of the water rights of customerswithin their district boundaries. The Talent, Medford andRogue River Valley Irrigation Districts serve the Bear CreekValley. The Eagle Point Irrigation District serves the areaaround Eagle Point (Figure 2).The Talent Irrigation District (TID) releases stored waterfrom Hyatt, Howard Prairie and Emigrant Reservoirs as neededfor its customers and those of the Medford IrrigationDistrict (MID) and the Rogue River Valley IrrigationDistrict (RRVID). Hyatt and Howard Prairie Reservoirs arelocated in the Klamath Basin.The storage and distribution system in the Bear Creek Valleyis often referred to as the "Talent Project" since It was acombined effort among local irrigation districts and theBureau of Reclamation to fund and build the system (Fig 2).The Talent Project imports and distributes an average of40.000 acre feet additional water supplies for agricultureIn the Bear Creek Valley. A second source of imported wateris from the Applegate watershed which provides TID with justover 1,000 acre feet of live stream flow water.Without imported water Bear Creek would be dry early In thesummer according to Watermaster's records.The overall efficiency of irrigation is enhanced by thecoordination of water use among the three adjacentirrigation districts in the Bear Creek Valley. Thedistricts cooperate with each other on water deliveries,scheduling and use of return flows. Lower irrigationdistricts are able to reuse return flows from upperdistricts thus improving the efficiency of the combinedsystem above that of individual districts.Bear Creek is the main delivery channel to three majorirrigation district diversions (located in Ashland for TID,Talent for MID, Medford for RRVID). Tributaries to BearCreek also carry irrigation water, augmenting over 600 milesof canals and laterals (RVCOG, 1978).-5--
. - l* .. ..ta *O*1!\&~~~~~~so 01 M-les ~ t*#^ *"lVo* ~~~ ~~ ~~~~-'~OREGO4KEY MAP'\~~~~~~~~~~~~~~~~~~~l = , C ''I. -*.T.\t~.-.Cwj L. P_*t . 1 2 IRRIGATION DISTRICT ;' ..........................................D f R O D IRRIGA~~~~~~~~~~~llO 9 \ t < - '~~~~~~wtIW(oglSe - ! ar.eIRRIG JORNIGATINDITIT}"'TALENT DIVISION / *DISTRICT ., j*,R~ ~~~~~~~~~~~~~c..W--T.f--e09~~~~~~~~~~~~~~~~~~~~~~~~~~~~~f( 'f\E, .. r5 ~' McDonald Cana ),- XCA^ LIt F O I N 1A n-VV ST.cTuM tl"FIGURE 2IRRIGATION DISTRICT BOUNDARIES-6-
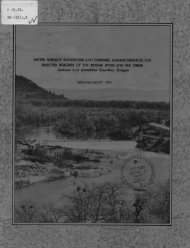
The long term annual discharge of Bear Creek Is illustratedIn Figure 3a. Figure 3b shows the distribution ofprecipitation by monthly percentages at Medford (OWRD RogueBasin Plan, 1985). Figure 3c illustrates the actualprecipitation recorded from 1983-1992 (Mail Tribune).FIGURE 3aHISTORIC FLOWS IN BEAR CREEK AT MEDFORD(Annual discharge in acre feet *)200000.C4150000cn:DuzH-~100000500000Courtesy U.S. Geological SurveyFIGURE 3bPRECIPITATION DISTRIBUTION (%)* (lcfs = about 2 AF/day)FIGURE 3C1983-1992 RAINFALL0z.:3-0I.MONTHLY DISTRIBUTIONzz..WI,- c00tia-*- 'r z W U IO Z k W < 2
-i8The Eagle Point Irrigation District (EPID) relies on a 100cubic feet per second (cfs) water right from Big Butte Creekfor all its water needs. However, actual flows duringnormal years are approximately 88 (cfs) during theirrigation season according to the manager, Hazel Brown.The District has an agreement with the Medford WaterCommission whereby any Big Butte Creek flows used by theMedford Water Commission which reduces district flow needsare replaced by releases from Willow Lake into Big ButteCreek. The 8,000 acre foot capacity of Willow Lake is anoperational resource to the district, but should not beconsidered an agricultural water source. Willow Lake istherefore not included in resource calculations in Table 1.The irrigation season legally begins April 1 for all fourIrrigation districts and extends through October 31 of eachyear. In the past the Irrigation season has been cut shortdue to the lack of adequate water resources.Irrigation districts are allowed to distribute water betweenFeb 15 and April 1 for acreages with frost control waterrights. Approximately 30 cfs of streamflow is availablefrom Bear Creek and its tributaries for this purpose.Summer water distribution Is usually on a two week rotationbasis though this rotation period may be extended duringperiods of water shortages. The irrigation districts arecareful to insure customers comply with water use policiesand do not waste water, sometimes adding staff expressly forthis purpose.There are many "best management practices" (BMP's) such assprinkler conversions, small ponds,, gravity irrigationconversions and buffer planting being used to improveagricultural productivity and Irrigation efficiency.Table 1 summarizes pertinent data provided by each of thefour irrigation districts including acreage served, numberof customers and water availability.There is a relatively large percentage of smaller parcelsserved by irrigation districts. The average parcel size forall irrigation districts is about 7 acres. The MedfordIrrigation District, for example, serves 1,300 parcels from0 - 2 acres, 400 from 2 - $ acres, 200 accounts from 5 - 10acres and 270 accounts greater than 10 acres in size.The parcels of less than 10 acres (88% of MID customers) areoften referred to as "hobby farms" Implying that they arenon-commercial operations. While Individual small farmproduction may not be larqe, the cumulative contribution ofthe large number of such farms is a major aspect of theagriculture economy in the basin. Many owners of smallfarms depend on the supplemental income from their land.In reality, small farms reflect an important and prevalentland use, an economic income to the owners and a significantagricultural activity reertiriq from irrigation water.
TABLE 1IRRIGATION DISTRICT DATA SUMMARYDATA EAGLE POINT MEDFORD ROGUE RIVER VALLEY TALENT (TOTAL,Irrigation Season Allowed 4/1 - 10/31 4/1 - 10/31 4/1 - 10/31 4/1 - 10/311992 (Drought Year) Actual 4/1 - Oct. 31 4/1 - 9/20 4/1 - 9/20 4/1 - 8/28Acreage Served (Proof Survey) (Proof Survey Under- (Proof Survey Underway)1979(Proof-Survey1980 way)RegularUnderway)8,260 12,519 8,221 (Total 17,700 43,674l _ 11,000 irrigated"When Available"8854) (15,560 irrigate_ 633 irrigated)Frost Control Acreage (Feb 15 - 1000 AC 375 - 1,375Mar 31)# Parcels 500+ 2,171 1000 Accts.; 802 users 3,143 6,616IrrigateAverage Parcel Size (Ac) 16 Ac 5.8 Ac 8.8 Ac 4.3 Ac 6.8 AcWater Sources Available EPID uses only Four Mile 8,867 Agate (4,671)1) Storage:Howard PrairieCapacitiesAnnualstream flow. Fish 5,224 Four MileReservoirs(4,433)- Total**Capacity(36,000) StoragePortion Talent Fish (2,612)Howard PrairieHyatt60,000Available** Stream flow for Project 8,000 Portion from TalentHyatt (16,180)16,180 power generation Subtotal 22,091 ProjectEmigrant(4.000 AF) Emigrant39,000 notTotal:included. Total StorageAgate 4,671(39,000) 114,792Avail. RRVIDFourmile15,716 Ac Subtotal:16,000ft 91,000Fish 7.836(M&I)- 2,195Total 143,687Effective Annual12.000Net 76,985Capacity: 117,492**2) Stream Flow Big Butte Cr. Little Butte (N&S) (N&S Forks) Bear Creek(Assumingand TotalAverage (S&N forks) 13,000 Little Butte and Bear various tribu-PrecipitationStreamRunoff) 100 cfs Water Right Bear 7,000 Creeks taries Flow:(88 cfs available) Subtotal 20,000 AF Subtotal: 12,000 -------------- 78,128Subtotal: 42,000 AF4,128iTotal Available (Surface Water 42,000 AF/Season 42,091 27,716Sources)AF 81,113(37,664 actuallyTOTAL:192,920_ _ _ _ _ _ _ __ _ _ _ i__ _ _ _ ___ a v a ila b le )__ _ _ _ _ _ _ _ _ _ _ _ _ _ _ _ _ _ _ _ _ _ _ _ _ _ _ __ _ _ _ _ _ _ _ _ _ _ _ _ _ _ _[eother *** I+4000 AF return flows +3000 AF return flows (-7000 AF)***46,091 30,716!!=~~~~~~~~~~~~ENoCtes: * Frost control water delivered by irrigation** Howarddistricts to customersPrairiewith temperatureCanalcontrolconnectionstream flow water rights=3.300limits transfer of water to 36,000 AF per year; 2,195 AF assigned to Ashland & Talent municipuses*** MID and RRVID utilize 7,000 AF of return flows increasing inter-district efficienciesOther(doessources:not affectThetotalU.S. Geologicalcalculations)estimates 3,000 AF of Ground Water is used for irrigation county-wide, perhaps 2,000 AF in the BeCreek Basin
4 . Oct ue I AV CL II a 1.4" v L. LA..Ljct L'i Q1, ,l %.A Qt- II t--.L 211J.L I L-U.L U LALCt-L U.,eSThe water available for agricultural Irrigation Includesannual precipitation and runoff, water stored from runoff,and ground water. Table 2 summarizes resources available tothe Bear Creek Basin for full reservoir, "normal" anddrought years. The combination of natural basinprecipitation, storage and inter-basin transfer results inapproximately 175,000 acre feet of water available to thefour irrigation districts on a "normal" water year.storage - Table 1 shows 143,000 acre feet (AF) of reservoirstorage capacity and notes some delivery limitations. only36,000 AF of the 60,000 AF capacity of Howard PrairieReservoir can be carried by the canal system to the BearCreek Basin in any one year. The cities of Ashland andTalent contract with TID for 2,195 acre feet of waterassigned to municipal uses from Howard Prairie Reservoir.Hyatt and Howard Prairie Reservoirs can provide water forthree consecutive drought years and refill in about 3 years.Evaporation from these reservoirs can total almost 5,Q000 AFassuming an evaporation rate of 36"/year and 4,767 acres ofreservoir surface area (SCS and TID data). This amount canbe significant if successive low water years deplete storagereserves in upper storage reservoirs. Evaporation fromlower reserviors such as Agate and Emigrant (3,000 AF/yr)does impact annual water availability.Stream flow - The four irrigation districts utilizeapproximately 75,000 acre feet of stream flow during anaverage season, approximately half from Big Butte Creek forEPID and the rest from water rights on the Bear Creeksystem. Irrigation districts divert their "live Streamflow" right early in the irrigation season when there isadequate flow and to delay the release of stored water aslong as possible. Stream flow water rights can go unused ifthe demand is less than available stream flow.The long term average annual yield for Bear Creek measuredat the Medford gaging station is 82,590 AF or 113 cubic feetper second (cfs) including imported waters (OWRD Basin Plan,1985). Water rights listed for Bear Creek total over 500cfs. (Attachment 4). Bear Creek was closed to furtherappropriation in 1959 because natural flow amounts were notadequate to satisfy all stream flow water rights. Until the"prove up" is completed, it is not possible to determine theamount of these rights actually being used.According to the irrigation district managers and the localWatermaster, individual water right holders, separate fromirrigation districts, irrigate approximately 5,000 acreswithin the study area.Approximately 3,500 acres of land are irrigated byindependent water riqhts on Little Butte Creek outside thestudy area. This use influences the water available to thelower Bear Creek Valley.-*10-
TABLE 2SURFACE WATER AVAILABLE BY IRRIGATION DISTRICT(Acre Feet)BY VOLUME (AP)EAGLE POINT MEDFORD ROGUE RIVER TALENT TOTALVALLEYFull Reservoir Year 42,000 AF(100 cfs) 42,091 27,716 81,113 192,920 AF(every 3-5 years)"Normal" Year 37,664 AF(88 cfs) 36,000 27,716 73,414 174,794 AF(90% storage; adequate stream) _Drought Year (1992)Delivered to gate * 21,000 AF 22,950 21,000 26,000 90,950 AFAmount diverted 24,705 27,000 24,705 30,588 106,998 AF(delivered + 85%) *** Typical year efficiencies: 80% conveyance (delivery); 70% on farm = 56% overall (Bureau data on MID other parcelscould vary)** 85% efficiency due to nature and intensity of water management in drought crisis
3. Agricultural Water Supply and Demanda. Typical supply and demandAccording to the Bureau of Reclamation, the Bear Creek Basinneeds 50,000 to 70,000 acre feet of additional waterannually to meet current Irrigation, domestic and In-streamwater needs. (Bureau, 1990). -Irrigation district managers believe the 175,000 acre feetof water available during a "normal" irrigation season laadequate to irrigate the 44,000 acres of land receivingwater within the four districts.There is no way of knowing the adequacy of stream flow wateravailable for all independent historic water rights listedin the study area until the current "prove up" verifiesacreages actually under irrigation. These rights total over500 cfs (Attachment 4). It is expected that many of theserights are no longer used and that those used may not allreceive adequate water for their needs.The Oregon State University Extension Service researched theamount of water used by various crops in the study area In1965. Research over the past five years by the Bureau ofReclamation further refined this information (Buchheim,1993). The recent work involved over 10,000 irrigated landsserved by the Medford Irrigation District. While thisrepresents only 1/5 of the irrigated lands in the studyarea, it does include a large percentage of parcels lessthan 10 acres in size and virtually all the types of cropsgrown in the area. The Bureau found that:* the average water need for all crops duringirrigation season (including rainfall) 26.8"* effective rainfall (that which contributesto crop growth during irrigation season) 4.2"* net irrigation requirement(excluding rainfall) 22.6"The Bureau research also included a determination of thedelivery system and on-farm irrigation efficiencies. Bureauofficials found the average delivery efficiency was 80% andon-farm efficiencies were 70% or 56% overall (Buchheim,1993). These relatively high efficiencies are due to thereuse of Irrigation return flows among adjacent districtsand the effective use of best management practices on highquality soils.According to officials from the Soil Conservation Service,there are irrigated lands in the study area wherelimitations in topography and soils result in irrigationefficiencies below 50% on farm.-12-
TABLE 3AVERAGE IRRIGATION SYSTEM REQUIREMENTS - PER AC-RECrop Consumptive Use per Acre per SeasonIrrigation Requirement Only(in addition to 4.2" of effective rainfall)Water Required at Farm Gate(assumes 70% on-farm efficiency)Water Required at Storage/Diversion Point(assumes 80% delivery efficiency)Total Amount of Water Required for 4 IrrigationDistricts (at storage/diversion point)Irrigated Acreage (four irrigation districts)Irrigated Acreage (independent users)Total Irrigated Acreage (Bear Creek Basin)27"/Ac23"/Ac33"/Ac41"/Ac.(or: 3.4 AF/ac)149,219 AF43,674 Ac5,Q00 Ac48,674 AcA comparison of irrigation district requirements with wateravailable during "full reservoir", "normal" and droughtyears is shown on Table 4 and illustrated in Figure 4.TABLE 4IRRIGATIQN DISTRICT WATER NEEDS AND RESOURCES(acre feet at point of diversion)Full Reservoir"Normal"Drought (1992)Water AvailableWater needed MIDs)Carryover(or deficit)192,920149, 214 3 ,701174,794149, 2192 5,57 5106,998149,2a- 42,221The data show that the capacity of the irrigation districtsystem exceeds customer water demands by almost 44,000 acrefeet during "full reservoir" and 25,000 acre feet during"normal" water years. There is a deficit during droughtperiods of over 42,000 acre feet in irrigation districts.If the 5,000 acres of independent water right users areadded and assuming that 30% of their need went unmet(similar to irrigation district shortfall), then anadditional 5,000 acre feet of water would have been needed.The total deficit would have been approximately 47,000 acrefeet in 1992. It 1- riot known how many other irrigationneeds went unmet fr, 13-92._-n
FIGURE 4IRRIGATION DISTRICT WATER AVAILABILITY AND NEED(ACRE FEET AT DIVERSION POINT)200193* AVAILN DEMANDO RESERVE/DEFICIT15015010050250-50 --43
. Low water periodsIrrigation supplies are not adequate during low water years.Each of the four irrigation districts summarized theirdeliveries during the 1992 irrigation season after 8 - 9years of extremely low precipitation (Table 2). The periodfrom 1983 to 1992 (Fig. 3c) was one of the most seriouswater short periods on record, a Category 4 on the PalmerDrought Index (Attachment 5).The lack of adequate water supplies in 1992 seriouslyreduced agricultural productivity. Irrigation districtcustomer demands alone exceeded supplies by over 42,000 acrefeet (Table 4). Rotation schedules increased from every twoweeks to as much as four weeks between deliveries.Irrigation district deliveries stopped as much as two monthsearly. Many farmers elected not to plant crops In 1992expecting inadequate water supplies. Impacts wereparticularly severe for the livestock farmers relying onpoorer quality soils.However, 1992 could have been much worse for agriculture.Fruit developed early reducing late irrigation demands. Theirrigation districts were able to monitor supplies andcoordinate their water delivery more efficiently than everbefore. Extreme conservation practices by irrigationdistricts and customers also saved water.Past investments in "best Management Practices" whichconserved water and improved on-farm productivity helped toreduce the financial impact of inadequate water supplies.Sprinkler conversions, for example, can reduce orchard waterconsumption by 30%.c. Current additional demandsHow much more land would be irrigated in the study areatoday if enough water were available? Any additional landswould have to have adequate soils, a potential water source,be large enough to justify the costs of the system and havean owner willing to invest in the effort.Ed Weber, former District-Conservationist for the SoilConservation Service, surveyed potentially irrigable landsin 1984. The inventory estimated there were approximately1,300 acres of land in the Bear Creek Valley which could beirrigated from the existing distribution system if waterwere available and improvements were added (Attachment 6).The acreage may be less now due to urbanization.The Rogue River Valley Irrigation District serves 633 acreswith water only "when available" by agreement within theirwater right permit. This represents a 2,000 acre footadditional annual de-mand.Irrigatinq 2,000 acres of potem-ntially irriqable and "whenavailable" lands would require approximately 6,000 acre fretof water at current application rates.-15-
D. Summary - Current Agricultural Water ResourcesThere appears to be adequate water supplies In the BearCreek Basin during "normal" or wet water years to serveexistiag irrigated acreages. Much of the water not usedduring the year ideally remains in high reservoirs carriedover for future low water years.Adding the demands of potentially irrigable acreages(6,000 AF) would further reduce reserves for carryover.There is not enough water available for existingagricultural acreage during drought neriods as shown by thecumulative impacts of low water years of the late 1980's. .There is not enough water available to meet the combinationof existing irrigated lands, all potentially Irrigable landsand unmet stream flow water rights even on wet years.Overall, approximately 50,000 acre feet of water iscurrently needed to overcome depleted resources resultingfrom extended drought periods.The amount of additional water needed to meet unmet waterrights is not known.-1 6 --
PART TWO -FUTURE AGRICULTURAL WATER NEEDSA. Issues Affecting Future Agricultural Water UseFuture agricultural water use will be affected by suchIssues as urbanization, climate, changes in croppingpatterns, water availability and environmental and otherregulations. These Issues are summarized in Table 5 below.TABLE 5SUMMARY -ISSUES AFFECTING FUTURE WATER DEMANDIssues Reducingq Future Agricultural Water Needs:* Population growth and urbanization - convertingagricultural lands to urban uses* Climate - cooler, wetter* Promotlnq conservation, technology and best managementpractices - increasing irrigation efficiency* Legislation and regulations - mandating reduced water use(160 ac. min. size; 1/80 cfs per ac limit)* Cropping changes - to crops which demand less waterIssues IncreasijnAgricultural Water Needs:* Climate changes - warmer, drier* Adding new irrigated acreage* Parcelization - complicating irrigation distribution* Cropping changes - to crops which demand more water or tomore intense farming* Environmental requirements for- augmenting flows for instream beneficial uses- ground water recharge* Legislation and regulation - facilitating farmingpractices* Land use planning - guiding location of urbanization* Accessing new water supplies - allowing more irrigation* Water marketing - opportunities for agriculture to sellwater for other beneficial uses* society support for agriculture - actively conservingproductive agricultural land* Aqriculture's view of the future - proactive planning andinvolvement- 1 7 -
B. Priority Issues In Agricultural Water Use ProjectionsProJections of the water resources needed in the future mustconsider the variables noted in Table 5. The issuesprojected as having the most impact on agriculture are urbangrowth, land use decisions and climate as discussed below.A critical factor will be the value placed on agriculturalresources by society and farmers in the future.. The higherthe value placed on this resource the more will be done topromote its future viability.1. UrbanizationThe most significant factor affecting agricultural water usein the future will be urban growth. Population growththrough the year 2050 could convert a significant amount ofagricultural land to urban uses decreasing agriculturalwater demands and increasing urban demands.Agricultural water use per acre can be compared to urbanresidential use and a city overall as follows:* typical irrigation requirement on-farm: 23"/Ac/vear(2 AFLArI; at deversion: 42"/Ac/year (3.4 AF/Ac/Yr)* residential use alone:(150 gal/person/day x 3.2 people/house) 500 gal/day(4 houses per acre x 500 gal/house) 2,000 gal/Ac/day(x 365 days/year = 730,000 gal/year) or 2.24 AF/Ac/yea* urban water use overall (Medford water Commission data):average water delivery, all uses 11,900,000 qal/day(= 36.5 acre feet/day x 365 days/year) = 13,325 AF/year(Medford = 18.5 sq. mi. or 11,840 Ac) = 1.13 Af/Ac/vrLow range population growth projection - (1.2%)The most water will be needed by agriculture if future urbangrowth follows lower projections. Portland State Universityhas applied a 1.2% growth rate for the urban areas withinthe Bear Creek Basin Including Ashland, Talent, Phoenix,Medford, Jacksonville, Central Point, White City and EaglePoint (draft "2050"' Urban Water Plan).This estimate shows a population of over 207,700 in the year2050. This is two times the 1992 urban population of104,000 in the Bear Creek Basin (Fig. 5).The amount of new urban land required under thisconservative scenario can be estimated by calculatingexisting urban densities. The 1992 population of Medford isapproximately 50,000 people occupying 18.5 sguare miles or11,840 acres (4.2 people per acre). Adding 104,000 peopleat similar densities would require approximately 2i,&00acres of land. or an area approximately half of the land nowirrigated in the Bear Creek Basin. If all this growthreplaces irrigated land, the agricultural water need woulddecrease by approximately half or 75,000 acre feet per year.- 18-
FIGURE 5URBAN GROWTH PROJECTIONS - BEAR CREEK BASIN(population x 1,000)Portland State University Projection (1.2%) 0-0-Recent- Urban Gro-wt-h Bath 19X) me J _ v''1I^- N '3Z300IL I 250-J200 -- - M , .0I50100104li- la,$ " ,145'261 -@8la1970 1920 1990 t00 2010YEAR2020 20o 2040 2050FIGURE 6 aURBAN GROWTH &AGRICULTURE LAND USEPROJECTIONS AT 1.2% GROWTH RATEIAgriculture EUrban50 _ 484845 _.-40 I353025 .-2444 44404036 3611 3232282825LiL:fC-)20 -1.1510 -5-0 - I _ I+11992 2000 2C 0 2020 2030 2040 2050YEARI : L , !I - , 4 'i "--,. 1 - o -V; -; I -I , ,(--- .-,. on 1 c; rn s now OW i I ] ,cz- t, l d .- 19-
High range population growth projection - (2%)Agriculture will require less water if more populationgrowth reduces the amount of irrigated acreage. Projectinga constant 2% population growth rate typical of the last fewyears, the 2050 population in the basin urbanized areaswould be 328,000 people, a 224,000 increase over 1992levels. Over 80 square miles (52,000 acres) of new urbanland would be required, an acreage larger than the currentirrigated acreage in the study area (Fig. 6b).URBAN GROWTH &AGRICULTURE LAND USEPROJECTIONS AT 2.0% POPULATION GROWTH RATEFIGURE 6 boAgriculture MUrban90 82so~~~~~~~~~~~~~~~~~~~~~~~~~~87 0 ~~~~~~~~~~~~~~~~~~~6760 5 5__ 48CZX50 44Ln' 4 0 3228~~~~~~~~22 0~~~~~~~~~~~~~~~~~~~~~~11992 2000 2010 2020 2030 2040 2050YEARThe above scenarios assume that past land use decisions andtrends will continue into the future and that growth willexpand concentrically from existing city locationscontinuing to impact the best agricultural lands (Fig. 7).However, the factors governing land use decisions and futurepopulation densities are changing as described below.Optimal agricultural water use projectionThe optimal view of the future of agriculture expects themost water demand. There is a growing interest by thepublic to preserve resource lands from conversion to otheruses. Agricultural lands grow valuable food crops andprovide a quality of life through the open spacetnvironument. Jackson County planning officials note thatthere has been a dramatic decrease in subdivision approvalsand parcelization in the county since the late 1980's. Newregulations affecting resource lands further limit theformaat i on cl new, smaller parcels in the cournty.Urbasn growth will continue but may he located on lands lessva ] ualhle fror aigri c(ultural production.-20-
FIGURE 7CURRENT URBANIZING AREAS -BEAR CREEK BASIN
These trends may cause population growth to concentrate morein cities. The county and cities are working together tominimize concentric outward expansions into the high valueagricultural lands. Major cities like Medford are takingcare to guide urban growth boundaries toward lower valuelands on the hillsides, if possible (Eisenhard, 1993).Growing public pressure may force more development towardnon-resource lands. Agricultural Interests are particularlyconcerned about the developmental impacts on the highquality lands around Central Point.It is conceivable that more residential growth might occurin the Eagle Point area along with commercial and industrialgrowth In the White City area where the poorer agriculturalsoils exist. This shift in growth trends could helpconserve the higher value lands in the Bear Creek Valley.Urban densities may increase. Many new residents areretired and do not need local employment. They may decideto buy smaller houses on smaller lots.Under this scenario perhaps only 1/3 of existing acreagemight be converted to urban uses with the correspondingannual water demand remaining at about 100,000 acre feet.DiscussiQnUrbanization will be a critical factor affecting long termagricultural water needs. The agricultural lands remainingin 50 years may be the most productive orchard and specialtycrops grown on the best soils with the least urbanconflicts. Agricultural lands closest to existing urbanareas are the most vulnerable to urban growth (Fig. 7).It is possible that parcels of 20 acres or less may remaindue to public demand for this lifestyle. These smallerparcels might not be split for more intense development.However, larger commercial lands become so valuable neargrowing cities that only development Interests can afford tobuy them. The next generation of farmers could not affordto buy these lands so the lands may convert to other uses.Costs for irrigation water could Increase for the remainingirrigated lands as a result of urbanization. There would beless agreage base to pay fixed costs. Increases in farmingcosts such as $50 vs. $35 per acre foot for water or newrequirements for BMP improvements could make costs exceedreturns especially on pasture land. Also, agriculturalyields will decrease and costs will rise if agriculture isforced out of the valley and onto poorer soils.A critical factor will be how society values agriculture.urban growth tends to compete for aqricultural land,particularly in valleys where the best soils exist and whereconstruction is easier. Society can become more aware aboutall the benefits of agriculture provides includinq food,quality of life and low environmental impacts. A societywhich values agriculture will learn to protect prime lands.
-23-2. ClimateThe second most significant issue is likely to be futureclimatic conditions. Variations in climate can be extreme.A decade such as the 1980's yielded only 3/4 of the "normal"rainfall expected based on long term averages in Medford.Future extended drought periods will deplete storagereserves to a point where the 1992 irrigation season mightbe repeated.The 1983 -1992 drought period was one of the most serious onrecord, below 4.0 on the Palmer Index (Attachment 5). It ispossible that this degree of severity extending beyond thethree year storage reserve capacity could reoccur every 20to 40 years. It could also happen again in the 1990's.Low range projection - If the area experiences average orbetter rainfall amounts, there may be little change in cropdemands except for that due to other factors.High rang!e demands - If the drought patterns of the 1980'sbecome more frequent and current agricultural acreagesremain, agriculture will need approximately 50,000 acre feetmore water to meet its current needs.3. Conservation and TechnologyAgriculture will likely continue to promote and adopt newconservation practices voluntarily. Irrigation districtsrecognize that canal lining and conversions to pipedpressure sprinkler systems will conserve water. Manygrowers are converting to overhead, under tree or dripirrigation systems which can reduce water use (and pumpingcosts) considerably. There will be more use of runoff andregulating ponds to conserve and recycle water and toincrease irrigation flexibility. These investments such asnew pumps and power costs can be expensive.Such "Best Management Practices" are expensive and may notbe as cost effective on lower value pasture lands as on moreintense row crop or orchard lands. Limited funding isavailable through the Agricultural StabilizationConservation Service (ASCS) and Soil Conservation Service(SCS) to help farmers with these improvements.New technology will improve delivery and on farmefficiencies. The Bureau of Reclamation Is alreadyMonitoring hydrology and agricultural rtmeteorological farmwater data in Medford. This "Hydromet" and "Agrimet" dataallow growers and irrigation district managers to trackreservoir supplies and anticipate crop water demands moreprecisely (Attachment 7). Such technology can save water byi-S-iri i-- that only the water needed Is brought down to thed, versioris. Knowing crop water needs reduces ex:cessriqaticon and runoff.
It may be possible for irrigation districts to convert froma rotation to an on-demand delivery system in the future.This is a major change, but it could allow new types ofcrops in the basin.Perhaps an overall efficiency rate of 65 - 70% (currently55 - 60%) may be attainable by the year 2050. This goal isachievable if a high percentage of productive crop land witheffective "BMP's" remains. The efficiency rates mentionedhere are already better than other irrigation distributionsystems elsewhere because of the effective reuse of watersamong adjacent districts.More and more commercial and small, "hobby farm", operaterswill use the lawn watering guide published in the localnewspaper. Knowledge of these daily evapo-transpirationfigures can reduce unnecessary crop and garden watering.However, conserving irrigation water can have negativeimpacts. Irrigation water not contributing directly toplant growth can benefit other users. Downstream users,natural stream flow, ground water and wetlands all benefitindirectly from agricultural irrigation. Lower elevationirrigation districts depend upon runoff from districtsabove. Irrigation and the distribution of Irrigation watercan recharge ground water supplies (refer to the groundwater portion of the "2050" Municipal and Industrial Planfor more details).4. Land use planningLand use planning is becoming more effective in preservingresource lands. Maps of high value soils are available todecision makers to indicate potential productivity. Somecities are attempting to guide urban growth away from thebest agricultural lands.5. water MarketingAgriculture may be able to provide water for alternativeuses in the future in or outside the basin. Growing urbanpopulations may need additional water supplies. More wateris needed today to solve instream water quality and riparianneeds. New demands outside the Bear Creek Basin (such asSam's Valley) may utilize water resources from the BearCreek system.Many legal and procedural issues will have to be addressedin order to market water. The Oregon legislature has begunto -deal with several of the issues during the 1993 session.-24-
6. Environmental issuesTnstream enhancement - Protecting and enhancing instreambeneficial uses of water depends on better water qualityand, in the Bear Creek Basin, increased flows. Protectingendangered species and riparian habitat is a growingconcern. Agriculture water management refinements mayresult in the release of water supplies for stream enhancingflows without compromising continued on farm watersupplies. (Note, agriculture already enhances local streamflows by storing winter runoff for summer distribution usingnatural stream channels).Runoff controls - The Department of Environmental Quality(DEQ) is required to improve the water quality of BearCreek. Agriculture is being asked to reduce its nutrientand sediment contributions to natural streams by reducingIrrigation runoff.Reclamation - Treated effluent can be a new water source forAgricultural irrigation. Both the Ashland and Medfordtreatment plants may make treated (class 4) water availablefor agricultural reuse. This could involve up to 20,000acre feet of water available during the irrigation season inthe year 2050.7. Other IssuesThe following issues also need to be considered whenprojecting future water needs for agriculture.Parcelization - Large agricultural acreage in the pasttended to be subdivided into smaller parcels. Deliveringirrigation water to many smaller parcels is generally lessefficient than to a few larger ones thus requiring morewater to do the same job. However, recent trends in landuse planning practices indicate a marked decrease insubdivision activity outside urban growth boundaries,according to Jackson County planning officials.Land use laws could allow resident farming of smallerparcels increasing productivity to the point of adequateeconomic return.Legislation - There is an increasing amount of legislationwhich is aimed at preserving the environment, improvingwater management and limiting agricultural conflicts. Such"right to farm" legislation can have siqnlificant effects onthe nature and viability of future agriculture. To theextent future legislation helps protect agriculturalproduction, there will be a proportiona'l need for waterserving those lands.-25-
Regulation - New regulations can decrease agricultural wateruse. However, agricultural productivity could also bedecreased due to reduced operational flexibility. The ratesand duties proposed by the Oregon Water Resources Departmentsuch as a limit of 1/80 cfs per acre per season may not beadequate for some types of crops or soils. The Bureau ofReclamation also enforces acreage limitations under theReclamation Reform Act and requires certain reporting ofirrigation on lands benefitting from Bureau projects.In some cases bureaucracy can limit local flexibility toimplement system improvements. The Bureau of Reclamationmust approve any major changes to the "Talent Project".Such approvals can be time consuming because of thepossibility of extensive federal reviews. This decreasesthe operational flexibility of the Medford, Rogue RiverValley and Talent Irrigation Districts. The Bureau workscooperatively with local officials but must also comply withcomplex (and growing) federal and state regulations.Economics - Agricultural lands may be sold for another usebecause the monetary return is too low and/or the problemsinvolved in farming in the future become too large for theowner to continue farming. Many farmers count on theIncreasing value of their lands as a possible futureresource. As these lands become more valuable near growingurban areas, land use conflicts increase and the pressure tosell becomes very strong.Conversly, future laws may allow water sales among userswithout threatening the original water right thus increasingthe flexibility of agriculture to share water resources.Agricullturp's Vip.w of the Future - How does agriculture viewits own future? If there is a concensus that agriculturewill remain a major economic force in the area, moreagricultural land will remain in the year 2050. If not, orIf there Is no real concensus, then more agricultural landswill be converted to other uses.Many commercial farmers have voiced the concern that theirchildren and other young people do not want to go intofarming. There are more "profitable" careers with bettersalaries and fewer problems. The lack of new youngagricultural professionals may mean that the existingagricultural lands will not have agricultural buyers whencurrent farmers retire. The implications are that theselands will be sold for other uses.There must be an economic Incentive to farm which encour7-Ctoday's farmers to stay in agriculture. Agriculture alsoneeds to be an attractive career for our children. Perhapsadditional ways can be found by society to keep all thebe -net i tC) of a=r i_ tune viable in th- e future.
C. Future Agricultural water SourcesThe development of additional water sources will help reducethe impacts of future extended drought periods and help meetthe needs of potentially irrigable lands. Those sourcesinclude system improvements such as additional storage,importation, conservation and reclamation are describedbelow. Additional stream flows are not available becauseBear Creek was closed to further appropriation by the OregonWater Resources Department in 1959 as total water rightdemands exceeded available flows.1. System ImprovementsThe Bureau of Reclamation reviewed existing Irrigationdistrict facilities in a 1990 report entitled,"Opportunities for System Improvement". The reportnoted that expanding the 4,000 acre foot AgateReservoir to 8,000 AF would increase effective wateravailability by 13,000 AF through better watermanagement. The estimated project cost then was$6,000,000. Enlarging Agate and possible on farmimprovements were the only projects reviewed consideredcost effective. A summary of that report is includedin Attachment 8.New storage sites are also limited. The Rogue BasinPlan notes a 3,300 acre foot site on Walker Creeknortheast of Ashland as a possibility (OWRD, 1985).Large storage projects are difficult to build andfinance during these times of increasing environmentalconcerns and agency permit processing.The future may lie in the development of more smallfarm ponds. Such ponds can store both winter runoffbefore irrigation season starts and excess canal flowsduring irrigation season by arrangement with irrigationdistricts. This increases on farm irrigationflexibility and efficiency as well.Small impoundments (less than 9 acre feet capacity) arenot subject to as many regulations as larger ponds.Information outlining the procedures for developing asmall pond is available at the SCS and StateWatermaster's office in Jackson County.2. Importation - Lost Creek ReservesApproximately 35,000 acre feet of water 13 designatedfor agricultural use in Lost Creek Reservoir. Waterrights are granted on a first come, first serve basis.The Rogue Valley Council of Governments coordinated apreliminary feasibility study in 1991 on transportingthat water to the Bear Creek Val- y. The contexceeded $40,000,000 for 60 fifs dur lnq the irriqationseason and could not be justified by agriculturalbenefits alone. Fish, municipal and water qualitybenefits may justify further review in the future.
3. ReclamationThe agricultural reuse of treated effluent (reclaimed water)from urban waste water treatment plants is becoming morecommon. Increasing water quality concerns and regulationsregarding nutrients are limiting the ability to dischargethe treated effluent into streams. However, agriculture canuse this water provided the water is properly treated andmonitored.Both Medford and Ashland are considering land application asan alternative to stream discharge. They are currentlyworking with Individual land owners and irrigation districtsto investigate this possibility. The Regional Water QualityControl Plant treated effluent volume in 1993 is 15 milliongallons a day (46 AF/day). Ashland's volume is 6 AF/day.The 19,000 AF annual volume Is over 5 times the capacity ofthe Walker Creek Dam site and is more than enough water toserve potentially irrigable land in the Bear Creek basin.Ashland's discharge point, adjacent to the TID diversion,is convenient for agriculture. The region's effluent wouldneed to be transported to Sam's valley or to Aqate Lakewhere it could be carried by canal to the Phoenix area.Agate Lake could be enlarged to hold winter flows and becomea better regulating reservoir in the process.A reclaimed water supply is a more reliable source thanstream flow or storage which depend on rainfall. Theconstant nature of these flows is a major benefit toirrigation water management. The use of reclaimed watercould serve the more frequent irrigations required ofshallow rooted plants. Some agricultural lands couldbenefit from water available "on-demand" rather than onlyevery two weeks. New crops might be feasible in the valley.The cost per acre foot of accessing reclaimed water may beless than the cost of developing an equal amount of newstorage. Municipalities also save on the treatment costs ofwater applied to the land as compared to that required fordischarge to "nation's waters".According to Jim Hill, Medford Waste Water Treatment Plantoperator, reclaimed effluent treated to the level plannedfor has no use restrictions and has been used successfullyin similar situations. A cooperative program would beimplemented to educate both the public and any concernedfood processors that reclaimed waste water is as safe as anyexIstinq irrigation water.Reclaimed water volumes will increase in proportion tof-ut:ure urban qrcowth. A future urban population of 208,000wo.ld generate approximately 25,000"f aiF of water annually; apopulation of 328,000 would generate almost 40,000 AF ofwater a year if wet weather storaqpe 1i. provided Ted. Ismna-jor potential resource for agricultune.-28-ta
The combination of accessing reclaimed water along with theother possible sources could eliminate the need for morecostly dams or water importation prolects.4. Conservation and New TechnologyAgriculture may be able to realize a 10 - 15% increasein water availability over the next 50 years throughcontinued promotion of on farm and deliveryconservation practices. The use of such technology asHydromet and Agrimet can help irrigation districts andfarmers meet this conservation goal.5. Summary of Future Agricultural Water SourcesTable 7 sunmmarizes the sources and associated wateramounts that might be available in the year 2050.TABLE 6POTENTIAL NEW AGRICULTURAL WATER SUPPLIES - YEAR 2050SourceSYSTEM IMPROVEMENTSAmount(AF)IMPORTATIONRECLAMATION *Walker Creek Dam * 3,300Aqate Reservoir enlargement 13,000small ponds * 5,000Lost Creek 35,000today: Region (17,000 AF)Ashland (2,000 AF)future 2050 population 270,000:(available Mar. - Oct.) 30,000 Af/yr *CONSERVATION (AF at diversion point)Or- Farm improvement (5%) * 7,500Systtema Manaqement (5%) * 7,500OVERALL TOTAL101,300 AF* Thle mo,:,st lik.-ly c. these possible soures- to: becoi-ereality are conser2vatiorn, reclamation, the enlargement ofAgate Reservoir and the construction of some small pondswhich could tot,;7 ,,vir 50.00O acre feet of additional waterfor agriculture and- other users.
D. Relationship of Agricultural Needs to Supply1. Current SettingThe current status of agricultural water resources can besummarized as follows:* agriculture water resources are adequate to serve existingirrigation needs during "normal" and "wet" years* agricultural water resources are not adequate to meet thecombination of existing irrigated lands, allpotentially Irrigable lands and unmet stream flow waterrights even on wet years.* over 40,000 AF of water Is needed to meet existingirrigation needs during drought periods.* much of the agricultural water resources not used duringone season is reserved for future drought demands* adding the demands of potentially irrigated acreages(6,000 AF) would further reduce reserves for carryover.2. Future projection* projected urban growth could reduce agricultural acreageand water demands from 30 to 100% by the year 2050* agricultural water resources could increase by as much as50,000 acre feet by the year 2050 through additionalstorage, conservation and reclamation improvementsThe need for agriculture water will probably remain constantover the next 5-10 years as some new Irrigated acreage mayreplace lands converted to urban uses. Additional watersupplies may be applied to future drought reserves.However, a 20-50 year projection indicates that urban growthcould significantly reduce agricultural acreage and waterdemands by the year 2050.
PART THREE -RESPONSE TO AGRICULTURAL WATER ISSUESA. Relationship to other Water UsersIrrigation districts, anticipating a decreased serviceacreage, are looking to find other, non-traditionalcustomers for the future.1. Municipal usersThe existing irrigation storage and distribution system canprovide water to urban areas by gravity. Irrigationdistricts can provide water suitable for industrial or lawnwatering needs thus reducing the amount and costs of watertreatment for domestic consumption. It is possible thatdecreases in agricultural Irrigation could reduce groundwater recharge and adversly affect ground water supplies.Water now used by agriculture may be available. in the futurefor ground water recharge by agreement.2. In-stream UsersThere is a definite need for additional flows in streams andtributaries for fish, riparian habitat and water qualitybenefits within the study area. Bear Creek, in particularsuffers from inadequate flows, excessive temperatures andhigh nutrient loadings impacting instream beneficial uses.The storage and distribution of Irrigation water benefitssummer stream flows in the Bear Creek Basin. However,agricultural runoff does contribute somewhat to highnutrient levels. The irrigation delivery system which usesnatural stream channels to convey water can cause extremevariations in flow which impacts natural habitat.Agriculture may be able to augment stream flows by exchangeor contract agreement in the future improving water qualityand riparian habitat of natural streams in the valley.B. A Possible ApproachUsers should pay for the benefits received from waterresources made available to them. It is difficult toactually "pay" for instream benefits. However, a possiblescenario appears to address this problem.The citizens of Medford and Ashland need to find a way todispose of treated effluent In the most beneficial manner.Agricuittuie is. a potential customer for that water. Ifagriculture used reclaimed water and replaced that waterwith st4rae releases into natural streams, cities wouldbenefit from more stream flow which improves water qualityand riparjan habitat and perhaps also benefit from reducedtreoatkie. t (-o tm Aqric u-It re wouldc hnave a quwrt-nteed watersource. The e-istinq irrigation storage and distributionsystem can beh utilized for this purpose.-. I,,_j
C. Regional CoordinationThe Rogue Valley Council of Governments is coordinating aneffort with water users in the area to develop an overallwater resources plan for the future. The effort involvesthe Medford Water Commission preparing the data for urbanneeds, Jackson County doing ground water research and othersdoing the instream report. This paper describes theagricultural water needs today and into the future.Once all these reports are combined, the overall waterresources picture can be described for the study area. Thevarious water interests can then work with each other withinput from the citizen users and other agency officials onthe next phase which is to develop and overall long rangeplan for the combined water needs in the Bear Creek Basin.This process can be an example for other basins to follow.D. RecommendationThis report includes significant findings affecting thefuture of agriculture in the study area. All agriculturalinterests should become aware of the nature of thesefindings and the implications for their future.Agricultural interests include the owners of larger,commercial acreages as well as the many owners of smallfarms. Also Included are formal organizations such as theFruit Grower's League, Cattleman's Association andsupporting public agencies such as irrigation districts andSoil Conservation Service. Many commercial operations suchas Grange Co-operatives and equipment suppliers are part ofthe overall agricultural economy.Agricultural interests should also include the people whobenefit from agriculture in terms of food production,economic return, and quality of life. Citizens arerepresented by public officials who often make pivotaldecisions relating to agricultural land use.Every attempt should be made to present this information toall these interests so they may address the future eitherindividually or as a unified group.The next step is for "agriculture", individually or as agroup, to decide on their water needs for the future andwu!k with u thre water users to see thaL adequate watersupplies are available and euit!hly '!sttrihut-.- in thefuture.
SUMMARYThis report describes the current and future agricultural waterneeds and resources available to meet those needs. The reportdoes not determine agriculture's water resource goals for thefuture. However, the following conclusions can be made:* agricultural water resources are not adequate to meetthe combination of existing irrigated lands, allpotentially irrigable lands and unmet stream flow waterrights even on wet years* Over 50,000 AF of water is needed to meet existingirrigation needs during drought periods* agriculture water resources are adequate to serveexistinq irrigation needs durinq "normal" and "wet"years (much of the agricultural water resources notused during one season is reserved for future droughtdemands )* addinq the demands of potentially irrigated acreages(6,000 AF) would further reduce reserves for carryover* agricultural water resources could increase by as muchas 50,000 acre feet by the year 2050 through additionalestorage, conservation and reclamation improvements* projected urban growth could reduce irriqated acreageand water demands significantly by the year 2050It may be possible to to meet all the beneficial water needs inthe Bear Creek Basin through future cooperative management ofwater without involving major new capital improvements.This report includes some significant findinqs on the currentand projected availability of water and the implications offuture urban growth on the nature of agriculture in the year2050Agriculture has the opportunity to become proactive in its ownfuture and Join with other agricultural Interests to addressthese issues.Society must support agriculture in order to preserve the futureof agriculture in the Bear Creek Basin.-33-
BIBLIOGRAPHYBuchheim, Jerry and Richard J. Roseberg. 1993. "Calibration ofIrriqation Requirements And Crop Growth Functions". Bureauof Reclamation. Global Climate Change Response Program.Bureau of Reclarriatlon. 1990. "Opportunities for SystemImprovement and Optimizing Water Use". Rogue River BasinProject, Oregon Talent Division. U. S. Department of theInterior.Bureau of Reclamiation. 1992. "1992 Water Supply Conditions ForThe Western United ,States and Outlook For 1993i". US.Department of the Interior.CH2 M Hill. 1992. "Lost Creek. Prolect". A preliminaryfe-.sltilit:^ -tud-l~y of i mportinrj Lost r '.--ter to the BearCreek Valley. Rogue Valley Council QL Gohvernments.Cordv, Clifford. .1977. "History of the PoF- i 11 e Y Fr i itIndJu~tr'v" Or^Heqon Sit-te Ulniver:-st. :- iit?: Service.B,9F in",?tE.RuqutlleDittmer, Fx Ec 1:9192. "water ty T,.tl- 1-*.1 -- PIt~-r r eVa-_lley ConC. i 1(of C(Gve:,nViueniDittifier, Eric. 1992. "Buildiinq a Small 1ond ' . R0tue V>13eyCouncil of Governments-Jackson coil arid Water Conservation DiIti;V. 19 81."Ag r iCultureal Water Need.s Information For Reese Creek,Evarn Cr et- e , T h ompsocn C ae>: ri B t.1 a CY- C-kC)S i-?Conservation Service.Medford Mail Tribune. 1992. "The Drouqht" A -fprecial report(.1 PP 1 lmen by -t Garv Neo.Jo ie -I , 1' J.Me-dfordl Maal Tr ibunre, 1. 9 93 , "vally WCttes V.ince I 8- .- 4",Art is](-- bLy Mark Freeman. Aucan usq 31 ;I1 Imtedford Water CrOfiff. t i'on .n )i3, " Be -i r-'iL V-t Iley '12-!'0,' W..terSIpply Plan" . Unpubl ished Vre Ii msct r, reportOreqon State University. "Estimated Value of AqriculturalProduction and Informative Statistlcs For Jackson County1992". Extension Office.Oregon State University. 1965. "Consumptive Use and NetT rI cvit- I er wseqn ire-lnentl ?qt m.ls-itfo' r,f M!9s~th 1}'i Var?3) ip, F'r'44. ; -- - -~- 1 - . ,f; ,-.; - ', - ;4 # _f-.4aY/-K fj.- ) ~ i - 1"*' + t*.*-.tt -; i ', 1'-)' 1,.tui:y" Eear. C~reek. Su}b-b-asli.ii, I /, ; 44J4 - - !i : - I? - - -4',= + r~~~~~~~ 4 . 4 -. . ; 4 ! - 4 . -
ATTACHMENTS
ATTACHMENT 1The following historical summary is excerpted from a1990 Bureau of Reclamation report, "Opportunities forSystem Improvement and Optimizing Water Use - Rogue BasinProject Talent Division"Irrigation has been practiced in the upper Rogue River basin for about acentury. Intensive agricultural production is not possible in the areawithout irrigation because of a long dry summer season, nor is there anylatitude for crop diversification. Thus, the value and need for irrigationare fully recognized by the local citizens. Early irrigation development usedunregulated streamflow. Prior to the development of water storage forirrigation in the 1920's, Bear Creek was often dry and stagnant in the mid- tolate summer. Other creeks tributary to the Rogue River also experienced lowflows or became completely dry during the sunner months when there waslittle precipitation.Before cities developed sewage treatment facilities, Bear Creek receiveduntreated waste water and was highly polluted. At present, the pollution inBear Creek exceeds the state standard for water contact activities by two tothree times. The pollutants that enter Bear Creek today come from: (1) urbanstorm drains that may contain waste from leaking sewers, (2) failing septicsystems, (3) natural waste from wild animals, and (4) agricultural waterrunoff carrying farm animal wastes, soil particles and nutrients.The need for a more reliable water supply resulted in storage developmentthat at present includes 144,000 acre-feet of active storage capacity.Current irrigation development consists of 15,100 acres in the TalentIrrigation District, 11,500 acres in the Medford Irrigation District and8,300 acres in the Rogue River Valley Irrigation District. The irrigationwater supply is considered inadequate during water short periods.After storage was developed in the basin, streamflows of tributaries tothe Rogue River during critical periods of the year have generally improved,but streamflows during the summer and early fall are less than desirable forwater quality and fishery purposes.' Water quality continues to be aparticularly severe problem in Bear Creek due to high temperatures and lowdissolved oxygen levels. During and immediately following the irrigationseason, streamflows diminish and some reaches become dry. During theseperiods, water temperatures become quite high and the~-ctannel sustainsabundant growths of unsightly and undesirable aquatic vegetation.City, county, state, Federal and private entities of the area havecombined to form the Rogue Valley Council of Governments to seek ways todecrease pollution problems. Much has been accomplished to reduce pollutionduring the 1980's, but quality problems continue to: (1) constrain theanadromous and resident fishery, (2) create sanitary problems, and (3) reducerecreational and aesthetic values.
ATTACHMENT 2The following climate summary is excerpted from theOregon Water Resources Department "Rogue Basin Study"of 1985.ClimateThe Bear Creek Basin has a moderate climate with marked seasonalcharacteristics. Late fall, winter and early spring months are damp,cloudy and cool under the influence of marine air. Late spring,summer and early fall are warm, dry and sunny due to the drycontinental nature of the prevailing winds that cross the area. Theaverage frost-free period in the lowlands varies from 140 days to 165days. Low humidity and high temperatures are common in July andAugust.Air temperatures at Medford airport vary from an average of 38 0 F inJanuary to 72 0 F in July. Average monthly temperatures andprecipitation for Medford airport, Ashland and Green Springs PowerPlant are displayed in Table 41.TABLE 41BEAR CREEK BASINAVERAGE MONTHLY TEMPERATURE (FO) and PRECIPITATON (in) at:Ashland, ORJAN FEB MAR APR MAY JUN JUL AUG SEP OCT NOV DEC TOTALTemp: 38 42 44 49 56 63 70 68 62 53 43 38 52Precip: 2.7 1.8 1.9 1.4 1.3 1.1 0.3 0.5 0.91.7 2.6 3.2 19.2Medford, ORJAN FEB MAR APR. MAY JUN JUL AUG SEPTemp: 38 43 46 50 58 65 72 .71 65Precip: 3.3 2.1 1.9 1.0 1.2 0.7 0.3 0.5 0.8OCT NOV DEC TOTAL54 44 38 541.6 3.0 3.6 19.9Period of record: 1952-1981Green Springs Power PlantJAN FEB MAR APR MAY JUN JUL AUG SEP OCT NOV DEC TOTALPrecip: 3.3 2.0 2.4 1.9 1.3 1.0 0.2 0.6 0.9 1.9 3.2 4.1 22.8Period of record: 1961-1981Source:U.S. Department of Commerce, National Oceanic and AtmosphericAdministration
ATTACHMENT 3ESTIMATEDVALUE OF AGRICULTURAL PRODUCTIONandINFORMATIVE STATISTICSforJACKSON COUNTY1992r 74- - b,3 11 - -5Jackson County Extension Officeoa Oregon State University1301 Afo pbe Grem, nDrireMedforcd, OR 97501-7986i ~ -. oTZ - i .' A t i:l. I ;, 1 I.!. ] .......... :1- ; '. ! ' : I 'I.( ! | - -.............................-: .l I ;;,'T l C T " 11 .:,.5:,.-l:, I -. o i; .: , -, ., - . I ), :. - .,\i' - - I .', I 4 -,se wIcc v*, 1 :. - E" {'-- t'' ' .
1992 JACKSON COUNTYESTIMATED GROSS VALUE OF AGRICULTURAL PRODUCTION ........ 73,662,500Each year an estimate of the Gross Value of Agriculture Production fromJackson County farms, orchards, and ranches is prepared by the O.S.U. ExtensionService. This estimate is prepared from the information obtained from USDAStatistical Reporting Service, the Oregon State University Extension Service, theAgricultural Census, producers, marketing companies and others.This report was prepared to give you a reliable estimate of the gross value ofagricultural production for 1992. You will notice it includes horticulture crops, fieldand forage crops, products from private non-industrial forestland and the variousclasses of livestock.In addition to production information there is a summary of Jackson Countystatistics plus information on the mission and impact of all Extension Program areas.Drought conditions plus an early spring seemed to have a negative impact oncattle numbers and sales. Alfalfa hay and some cereals also suffered due to thedrought. A noticeable increase was experienced in private non-industrial forestlands.This is due to the impact of the current old growth policies, politics, and other factors.Please note that the sales figures are gross sales and not net income to theproducer.The attached information was assembled by the Jackson County ExtensionAgents: Allan Campbell, Phil VanBuskirk, George Tiger, Randy White and MichaelE. Howell in cooperation with Oregon State University Extension Economist, StanMiles.Sincerely,Michael E. HowellStaff Chairman}I: lg
STATISTICSTOTAL AREAFederal Land OwnershipState Land OwnershipLocal Government Land Ownership1,799,744 Acres*914,056 Acres*10,715 Acres*27,071 Acres*ALL LAND IN FARMSCROP LANDPRIVATE NON-INDUSTRIAL FORESTLAND(i.e., commercial forestland not exceeding 5,000 acres in any* Area = 164,000 acres* Volume of commercial timber-growing stock = 207,000,000 cubic feet-sawtimber = 551,000,000 board feet* Ownership = 2,180 landowners301,871 Acres*74,598 Acres*one ownership)NOTE: (1)Area and Volume Data from:Gedney, Donald R.,"The Timber Resources of Western Oregon-Highlights and Statistics"USDA Forest Service Resource Bulletin, PNW-97, April 1982(a)(b)Growing stock includes trees 5.0 inch d.b.h. and largerSawtimber includes softwood trees 9.0 inches d.b.h. and largerand hardwood trees 11.0 inch d.b.h. and larger.(2) Ownership data from Jackson County Survey in 1981.TOTAL NUMBER OF FARMSAVERAGE SIZE OF ALL FARMSACRES OF IRRIGATED LANDANNUAL RAINFALLPOPULATION TRENDS:1,588-188 Acres*52,350 Acres*17-20 inches1940195019601 -1701986! 991, * Hi,)-36,21358,51073,31695,5313)131,73S138,400151,400153;0f.0'* I _ z7 ClNS 1S -) I i \', I i. I 1 Ziv
ESTIMATED1992 GROSS VALUE OF AGRICULTURAL PRODUCTIONJACKSON COUNTY, OREGONI. HORTICULTURE AND SPECIALTY CROPS - $44,851,0001. Fruits and Nuts - $41,913,000Crop*Bartlett Pears*Winter Pears*Asian Pears*ApplesPeachesCherries, TartCherries, SweetPlums & PrunesWalnutsGrapes**Acreage2,0505,60025250250520812180Production18,710 tons4,7250 tons280 tons125,000 boxes65,000 boxes10 tons40 tons60 tons10 tons540 tonsValue ($000)6,12732,7001931,3751,06383212113922. Vegetable and Nursery Crops - $2,938,000CropBerriesOnionSweet CornTomatoesMisc. Vegetables andtruck cropsNursery, Greenhouse.and Specialty Crops**Acreage154032510458Production45 tons16,000 tons2,500 tons2,500 cwt3,945 tonsValue ($000)50112280505961850*Value of fresh commercial pack included.II. FARM CROPS - $5,815,0001. Forage Crops - $4,598,000CropAlfalfa HayOther HayCorn SilageHay Silage**Acreage550017,000500900Production24,750 tons34,000 tons12,000 tons6,000 tonsValue ($000)2,2282,0402281022. Cereals - $547,4)00CropIAWheatjBarlfvOats-**Acreage1,1 I 0 "I ',({; fI (; "Production8.030 hul I-(,0 () be,,00n buValue ($000).)1!1 I
Page 23. Seed and Specialty Crops - $670,000CropAlfalfa SeedGrass SeedSugar Beet Seed***Production acreage onlyIII. DAIRY PRODUCTS - $1,976,000IV. BEEF -. $7,344,000V. SHEEP - $212,000WOOL - $13,215VI. SWINE - $333,000**Acreage8035073Production34,000 lbs140,000 lbs385,000 lbsValue ($000)28453189VII. MISCELLANEOUS LIVESTOCK - $2,020,000Honey Bees - $160,000Horses, Mules, Ponies - $1,100,000Rabbits - $293,000Miscellaneous - S450,000VIII. ALL POULTRY - $3,004,000IX. PRIVATE NON-INDUSTRIAL FORESTIAND PRODUCTS -$8,192,000(e.g., old growth timber, small saw timber, poles, posts, fuelwood, Christmastrees)SUMMARYHorticultureForage CropsCerealsSpecialty Seed CropsDairyBeefSheep & WoolSwvil-ePou itrvIv1isCedlauiuus ,iv ustockPrivate Non-Industrial Forestlaiid ProCLucit.$ 44,851,0004,590,000547,000670,0001,976,0007,344,000225,500333,0003,004,000',)02,0008,1S02,000Total $73,662,500
inOREGON STATE UNIVERSITY EXTENSION SERVICEJACKSON COUNTYMISSION:The Oregon State University Extension Service educates Oregonians by deliveringresearch-based, objective information to help them solve problems, develop leadership,and manage resources wisely.EXTENSION SERVICE IS:Research Backed: Extension clients learn from OSU faculty (Extension Agents)who work in each Oregon county. County programs are supported by other faculty(Extension Specialists) on campus.Informally Delivered: Extension clients learn through meetings, workshops, shortcourses, tours, and demonstrations. Others benefit from Extension informationoffered through nearly 1,500 publications and a variety of newsletters, correspondencecourses, video tapes, slide sets, and news media activities.Widely Used: Extension has over 40,000 face to face educational contacts withJackson County citizens each year.Volunteer Oriented: In 1992, 1,430 Extension clients volunteered 71,500 hours ata value of $339,625 to extend programs in the areas of home economics, gardening,energy conservation, 4-H/Youth, woodland management, and agriculture.Broadly Supported: Citizen support for Extension comes from four fundingsources: approximately 50 percent from State Government, 25 percent from theFederal government, and 15 percent from Jackson County. Another 10 percentcomes from gifts, grants, and fee programs. Jackson County provides the funds tooperate the county office and also provides the office and auditorium facilities.PROGRAM AREAS:Agriculture: The agriculture program provides research-based education onproduction, financial management, and marketing of crops and livestock valued at$73.7 million annually from 1,588 Jackson County farms.Home Economics: Extension home economists, assisted by 180 trained volunteereducators, teach individuals and families to manage their resources to meet needs forfood, clothing, fina-nce, shelter, parenting, and humnan relationships.4-H/Youth: The 4-H/Youth program works with 1,254 voting cii.iZeiS, L'heir aiiliet,and 315 enrolled, plus "miscellaneous other", adult volunteers. Together, thevdevelop practical skills and know-`edge tflrouJly h'na1 ednu,ograns aninnalSC;l C 11C, p LInt sc i ri'Ct', i10iMOYP (ŽC'.'C{ll I CS H'W
Forestry: Sustained yield timber production remains an integral and vital part ofthe Jackson County economy. There are 164,000 acres of commercial forestland inJackson County that are classified as private non-industrial forestlands (smallwoodlands). Owned by approximately 2,200 individuals/families, these lands havegreat potential for the production of a variety of crops including sawlogs, veneer logs,chip logs, poles, posts and firewood. Total 1992 small woodland timber production(saw and veneer logs) for Jackson County is estimated to be 18 million board feet(approximately $8.1 million). Added values of recreation, water, and wildlifeenhance the environment and livability of Jackson County.Energy: The Energy Program is helping Jackson County build a sustainable energyfuture by educating and assisting people in resources. The Energy Program in thecounty involves over 750 people annually.Community Development: Programs in commnunity development focus educationon issues of economic viability of rural comm-nunities, land management andpreservation (both agricultural and forestry), community leadership, and use of ournatural resources to sustain a livable Jackson County.ORGANIZATIONAL STRUCTURE: The Jackson County OSUI Extension OfficeStaff consists ofA. Eight Extension Agents with the following responsibilities:- Michael E. Howell, Staff Chairman- Allan Campbell 3rd, Forestry- Janice Gregg, Home Economics- Phil VanBuskirk, Agriculture- Randy White, Livestock-Anne Manlove, 4-HiYouth-George Tiger, Agriculture-- Larry Giardina, EnergyB. Three support staff:- Marion Vroman, Office Coordinator- Dianne Roberts, Office Assistant- Nancy Graber, Office Assistant.1 1 -A
Attachment 4 is excerpted from the Rogue Basin Study prepared by theOregon Water Resources Department in 1985.TABLE 44BEAR CREEK BASINSURFACE WATER RIGHTS -July, 1981in cfsIRR STK MUN IND FISH WLDLF MIN PWR TEMP REC FIREBear Cr. 69.194 1.0 1.45Ashland Cr.and misc.5.164.1028.542 .7 54.0 .224Emigrant Cr.and misc.60.048.795.10 .05 .25 1.5:iGriffin Cr.and misc.Wagner Cr.and misc.78.467.07 .03 1.0 2.5 .0535.196 5.20 .25 .01H3X3MWalker Cr.and misc.8.712.272 .01 1.52Bear Cr.misc.304.4571.436 .15 2.035 .15 .421 9.60418.75111.73 .04Rogue R.and misc.3.425 1.85 14.32 .50TOTALS 564.663 2.673 .26 30.577 1.85 2.351 1.77 15.80418.75(1)55.5 30.0 .974 .10(1) 11/1 to 5/1
ATTACHMENT 51992 WATER SUPPLY CONDITIONSFOR THE WES'I'-4tN SrlTATESANDOUTLOOKs FOR 1993UNITED STATES DEPAIY. .; rBUREAU 0F'' tia (AAviMATIObN{ w t 'Li - INTERIORP4 ox
OVERVIEWWATER YEAR 1992 WATER SUPPLY CONDITIONSAND OUTLOOK FOR 1993This overview summarizes water supply conditions at selected Bureau ofReclamation (Reclamation) project areas during water year 1992 (the periodOctober 1, 1991, through September 30, 1992). Water supply can bequantified by several parameters, including soil moisture, snow waterequivalents, streamflow forecasts, accumulated precipitation, accumulatedinflow, and reservoir storage. No single parameter can reflect the totalwater supply picture due to climatic variables and water storagedevelopment in the Western United States.Reclamation comprises five regions: Pacific Northwest, Mid-Pacific, LowerColorado, Upper Colorado, and Great Plains. (See frontispiece map.) Thefollowing discussion describes regional water supply conditions in general; alore complete discussion of water supply conditions by region is provided inthe summaries at the end of this document. As noted below, several regionsexperienced drought or low water supplies during 1992, which adverselyaffected water users.PALMER DROUGHT SEVERITY INDEXThe Palmer Drought Severity Index is a measurement tool for relativedryness or wetness, indicating prolonged and abnormal deficiencies orexcesses of soil moisture. The Palmer Drought Severity Index, as shown onfigures 1 through 5, indicates how soil moisture conditions changedthroughout the water year. The year began with moderate to extremedrought conditions in the Pacific Northwest and northern California (PacificNorthwest and Mid-Pacific Regions) and wet conditions in New Mexico andTexas (Great Plains Region). In addition,,the September 28, 1991, index(figure 1) indicated mild drought conditions in Arizona (Lower ColoradoRegion), the Great Basin (Nevada and Utah; Mid-Pacific and UpperColorado Regions), and Idaho (Pacific Northwest Region). By December 28,1991, the index (figure 2) showed that conditions had improved in the GreatBasin. The extreme northwest and most of Arizona, New Mexico, and Texaswere unusually moist to extremely moist. Overall, drought index conditionshad improved from the September 28, 1991, values.By March 28, 1992, the index (figure 3) indicated that severe droughtconditions predominated in the Pacific Northwest, central Montana, andnorthern Nevada. Although soil moisture in southwestern California(Mid-Pacific-Region) was near normal, soil moisture in the rest of the Statewas below average. The April 25, 1992, index showed that droughtconditiosh'wei'e intensifying and spreading, particularly in the ColurniliiaRiver Basin of the Pacific Northwest, eastern Oregon, most of soutthern
Idaho, and northwestern Nevada (Pacific Northwest and Mid-PacificRegions). Moderate to severe drought conditions prevailed in northernIdaho and western Montana, California, northeastern Nevada, Wyoming,and other isolated areas, while moist to extremely moist conditions':'prevailed across Arizona, New Mexico, and Texas.This pattern continued into June. The index for May 30, 1992, (figure 4),indicated that severe drought conditions persisted in the Columbia RiverBasin of the Pacific Northwest, eastern Oregon, most of Idaho, northernNevada, northwest and southeast California, and a large portion ofWyoming. The index continued to show extreme drought in the PacificNorthwest Region throughout the summer months.I ISNOW WATER EQUIVALENTSAND STREAMFLOW FORECASTSSnow water equivalents are used to estimate streamflow during the snowaccumulation season and, subsequently, the volume of water that will flowinto reservoirs during snowmelt. Streamflow forecasts are useful watersupply indicators in the West because of the importance of snowpack in thewater supply. The Soil Conservation Service provides West-wide snowwater equivalent data and streamflow forecasts each year beginningJanuary 1. The forecasts are updated as the snow season progresses. Inaddition, forecasts are made by River Forecast Centers and Reclamationoffices.Table 1, figures 6 and 7, and 8 through 11 show how snow waterequivalents and streamflow forecasts fluctuated as the water yearprogressed. In January, the data in several areas were influenced by theearly snowfalls of November and indicated that normal or above normalrunoff would be expected. However, below normal runoff would be expectedin the Sierra Nevada Mountains of California (Mid-Pacific Region), theGreat Basin (Mid-Pacific and Upper Colorado Regions), eastern Oregon(Pacific Northwest Region), and northern Utah (Upper Colorado Region).This pattern persisted into February because of early January snowfall.However, several areas experienced less than average snowfall theremainder of the season, which significantly influenced the streamfilowforecasts.By May 1, the band of much below average snowfall and forecastedstreamflow had spread over most of the Western States north of Arizonaand New Mexico. None of the snow stations shown in table 1 had abovenormal snow water equivalents on May 1, and measurements at severalstations were considerably below normal. The May I data reflect thatsnowpack was melting earlier than usual and that the snowpack was low.The early melting was also reflected in the accumulated inflow andreservoir storage data.9
- * I .cl ~-* -q w* w-AA . .v :Aq o '- W,.-a a_.a 1_m,lwc~~~P0r A Po a4F'e C4 fo- E0 @Vo. I GV O-4 S!D V AX3 *3NgW '3 I A J . q a -
ATTACHMENT 6A G R I C U LTU RA LW A T E R N E E D S I N F 0 R M A T I 0 N F O RREESECREEKEVANSCREEKTHOMPSONCREEKBEARCREEKREPARED BY: JACKSON SOIL & WATER CONSERVATION DISTRICT 1-5-°4E\vIsED ii7/O/4
BEAR CREEK:ROGUE RIVER VALLEY IRRIGATION DISTRICT:Hopkins Diversion: (Includes Stored Water)Aori I1981-83 Av. ____|23._ 7M may June Jull, I Aua I ';e t n'-f,__ _ _ _ _ _ _ I . . , _ _ __ _ _ __ 25.1 26._3 27.3 24.7 7 _1964& 1960 12. 9 29.2 31.7 32. -31.-6 27.6 14.31j55 & 196 | | 5.7 J 7J 12.0 I10. i1954-60 Av. I 3.0 12.8 15.2 1 i7, 1 14.9 ! 13-4 3. 91961-67 Av. 9 5 24.2 1 2O.9 29.2 28.98234 I 11.1_ _Hi gh | 30.6_121 32.5 I 34. 3 123; 8 33' . 7LowO-_ _I __ 7 9_Low 0..0 0.0 0.0 10.3 _-_ j 7*9 35 _ i_Hct;i'.s Di .ersi on ,.a er Riaht:60i^*Oacrefs6 0 c `F SOther Diversions:Harry & David, Airport Orchard, 30 ac. ------1 cfsGriffin Creek, 140 ac. -------------------- 1.8 cfsJackson Creek, 150 ac. --------------------------- 1.9 cfsBear Creek, 544 ac. ------------------------------ 6,8 cfs11.5 cfs 11.5 cfsPotential Additional Land:Hopkins Diversion, 340 ac. 4-----------------.3 cfsGriffin Creek, 33 ac. --------------------------- 0.4 cfsJackson Creek, 76 ac. --------------------------- 1.0 cfsBear Creek, 208 ac. ----------------------------- 2.6 cfs8.3 cfs 3. 3 cfs79.8 CiSRecorn.ended Flr.s:I A Dril I May lU-ne I July I Auq s i2 t -i, 0 5 6 1 7 I 1 3o , 5 I o 91 i 56 I I69! e rz
BEAR CRE E:IMEDFORDIRRIGATION DISTRICT:6ear Creek Diversicn: (Includes Store d Water)I Apri 1 May June1979-3?, Av. 11._( 19koJuly I Au- I Sep ton ly)C.3 .07 1 36.7 43.0 506 1 -. 3 2 3Hic 24 6 | 41.4 j 42. 2 j 51.4 54 8 j 91 32.3Low 0.0 _16.0 I 30.4 ! 38.3 47.8 28.4 0.03ear Creek Diversion iater Right: --------------------------Other Div2rsions:5,770 acri72 cfsPotential Additional Land:Bear Creek Diversion, 650 ac. ------------------- 8.1 cfsRecommended Flows:I April 1 : ay I June I July I Aua | Sect I cct6i I 1II I36 1 0 I 62 175 180II- - ----
BEARCREEK:TALENT IRRIGATION DISTRICT:Oak Street Diversion: (Includes Stored Water)AverageHiahLowApril May June July Aui SortJune July Au' %ct7.5 38. 5 4d 8 65 . 5 g I . '2 1 . :18.0 54.0 64.0 89.0 9.0 l 4.00.0 0.5 29.0 20.0 23.0 2.0Oak Street Diversion Water Right: -------------------------- 4,204 acres(Bear, Ashland, & Neil Creeks)55 cfsOther Diversions:Wagner CreekColeman CreekAnderson Creek (Griffin CreekKenutchen CreekMyers CreekButler CreekHarry & David, Dugan Orchard, 100 ac.Potential Additional Land:---------------------------------- 3,440 acres43 cfsApril 13 cfsMay-Sept. 3 cfs_Recommended Flows:lApril ! May I oune I July mug i Sept Oc! 40 1 83 i f35 1 12 0 83 i_
ATTACHMENT 7
ATTACHMENT 8Rogue River Basin Project, OregonTalent DivisionOPPORTUNITIES FOR SYSTEM IMPROVEMENTANDOPTIMIZING WATER USE_Bureau of ReclamationBoise, IdahoMay 1990
SUMMARYThe Talent, Medford, and Rogue River Valley Irrigation Districts areinterested in improving the operation of their respective districts andresolving water problems in the drainage basin. The Bureau of Reclamation hascooperated with the districts under the Investigation of Existing Projectsprogram to review water use, irrigation facilities, problems and needs, andpotential measures to reduce problems that exist.The irrigation districts identified measures to modify and improve theexisting systems that they felt would increase their effectiveness and extendthe use of the available water supply.Those irrigation facility improvements that appear to be economical plusan enlargement of Agate Dam and Reservoir would provide an effective increasein the useable water supply of about 13,000 acre-feet. This represents about10 percent of the water diverted during normal water years for irrigation bythe districts. During water short periods increased useable water supplywould provide an additional two irrigations for district lands.During average and above average water years, a major portion of the13,000 acre-foot increase in water supply could be retained in the reservoirsystem as insurance water for the subsequent irrigation season or released forstreamflow enhancement.The investment to implement these measures would be $8 to $9 million.this total, $6 million would be for enlargement of Agate Dam and Reservoir.OfThe reregulating reservoir systems evaluated in the Talent IrrigationDistrict do not appear to be cost effective.The plan to pump from Howard Prairie Lake to Hyatt Reservoir is noteconomical. Costs are high and the quantity of water that could be added tothe annual water supply available for use in the drainage basin is small.Modification of Fish Lake Dam to reduce seepage through the dam couldsave from 400 to 500 acre-feet of water annually. However, in light of thefuture Safety of Dams action and the marginal cost effectiveness of themeasure, implementation should be deferred.Development of hydrogeneration at Howard Prairie Dam appears marginalunder present conditions. It may be economically implemented in future yearswhen the demand for electrical energy is greater and alternative sources aremore costly.The pump/generation facility between Howard Prairie Lake and HyattReservoir is not an economic development.On-farm irrigation water management and a coordinated system operationappear to have potential for decreasing irrigation water demands but were notanalyzed as part of this study. Reclamation will consult with districtmanagers about these possibilities as a part of ongoing operation andmaintenance program liaison in the area.Potential sources of funding for implementing effective measures includeFederal and nonFederal. Federal programs include the Small ReclamationProjects Act of 1956, the Rehabilitation and Betterment Act, and Reclamation'sGeneral Investigation Program under which construction %'ouild requireCongressional authorization. NonFederal funding sonarces may include OregonState, county, city, irrigation entities and other local beneficiaries. Useof Federal funding for project implementation will rfenuire some level of