Tetratech Interior Drainage Study for Potomac Park - National ...
Tetratech Interior Drainage Study for Potomac Park - National ...
Tetratech Interior Drainage Study for Potomac Park - National ...

You also want an ePaper? Increase the reach of your titles
YUMPU automatically turns print PDFs into web optimized ePapers that Google loves.
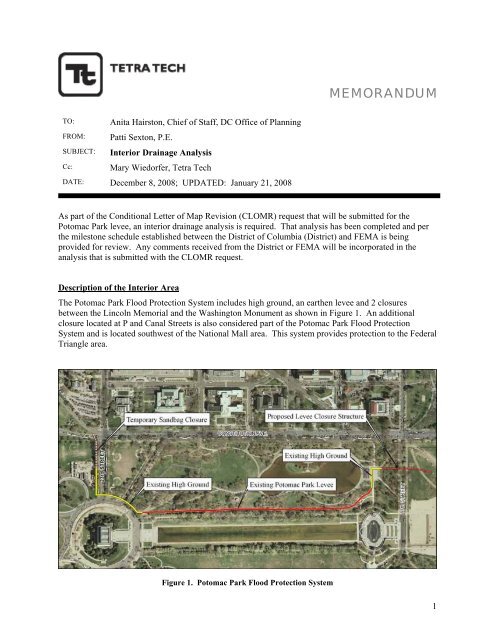
MEMORANDUMTO: Anita Hairston, Chief of Staff, DC Office of PlanningFROM: Patti Sexton, P.E.SUBJECT: <strong>Interior</strong> <strong>Drainage</strong> AnalysisCc: Mary Wiedorfer, Tetra TechDATE: December 8, 2008; UPDATED: January 21, 2008As part of the Conditional Letter of Map Revision (CLOMR) request that will be submitted <strong>for</strong> the<strong>Potomac</strong> <strong>Park</strong> levee, an interior drainage analysis is required. That analysis has been completed and perthe milestone schedule established between the District of Columbia (District) and FEMA is beingprovided <strong>for</strong> review. Any comments received from the District or FEMA will be incorporated in theanalysis that is submitted with the CLOMR request.Description of the <strong>Interior</strong> AreaThe <strong>Potomac</strong> <strong>Park</strong> Flood Protection System includes high ground, an earthen levee and 2 closuresbetween the Lincoln Memorial and the Washington Monument as shown in Figure 1. An additionalclosure located at P and Canal Streets is also considered part of the <strong>Potomac</strong> <strong>Park</strong> Flood ProtectionSystem and is located southwest of the <strong>National</strong> Mall area. This system provides protection to the FederalTriangle area.Figure 1. <strong>Potomac</strong> <strong>Park</strong> Flood Protection System1
MEMORANDUMThe Federal Triangle is at the bottom of a watershed that extends north to Buchanan Street NW and isshown on Figure 2. This watershed is approximately 5.2 square miles. The <strong>Potomac</strong> <strong>Park</strong> levee itself isoutside of this watershed and is located such that very little overland flow is generated in the drainagearea directly tributary to the levee. This levee watershed is also shown in Figure 2. Note in Figure 2 thatthe watershed boundary separating the Federal Triangle and <strong>Potomac</strong> <strong>Park</strong> basins is not governed entirelyby the topographic contour lines because the subsurface storm drainage system handles a portion of floodrunoff.The Federal Triangle area is served by a partially separated sewer system. The combined system is partof a large and complex sewer system that serves the combined and separate sewered areas in the Districtof Columbia and portions of the separately sewered areas Maryland and Virginia. The combined systemis operated by the District of Columbia Water and Sewer Authority (DC WASA). The Federal Trianglearea is part of the B Street / New Jersey (NJ) Avenue system. This system includes a network of pipeswhich terminate in the O Street and Main Pumping Stations. The O Street Pump Station provides theprimary service <strong>for</strong> the Federal Triangle area. These pump stations handle combined sewage during largestorms. The Federal Triangle area is also drained by a storm drain that drains by gravity to the TidalBasin and then into the <strong>Potomac</strong> River.The O Street and Main Pumping Stations serve an area much greater than the Federal Triangle. The MainPumping Station serves the entire area in the northeast and southeast portions of the District. Flows areconveyed to the pump station primarily by the B Street / NJ Avenue Trunk Sewer, the Tiber Creek TrunkSewer and the East Side Interceptor. The O Street Pumping Station which is adjacent to the MainPumping Station can be considered a supplement to the Main Pumping Station (O&M Manual, 1993).Overflow from both pump stations is discharged to the Anacostia River. The operation and maintenancemanual <strong>for</strong> these pump stations (included in Appendix B) indicates that the main purpose of the pumpstations is to prevent sewage from entering the river by pumping it to the Blue Plains WastewaterTreatment Plant. Each pump station includes sanitary and stormwater pumps. The effect of the pumps onthe Federal Triangle area is dependent on the amount of flow that is being conveyed to the pumps fromthe other service areas.Previous <strong>Study</strong>In 1992 the U.S. Army Corps of Engineers (Corps) developed a General Design Memorandum <strong>for</strong> theModifications to Washington D.C. and Vicinity Flood Protection Project. As part of that report aninterior drainage analysis was prepared to document the residual flooding in the interior area. Thisanalysis focused on the effects from local rainfall and states that because the storm sewer capacity is afunction of pumping capacity, the stage of the river has little impact on the interior pond elevation. Aconclusion of the report is that the project will not worsen interior flooding in most areas.While no significant changes in the WASA sewer system have occurred since the Corps study wascompleted, new topography has become available. Much of the methodology used by the Corps is similarto what is reflected in this updated study.The final interior ponding area identified in this report is shown on the figures associated with theanalyses per<strong>for</strong>med <strong>for</strong> this current study. The significant area of ponding in the Corps’ analysis isidentified as Pond IA. The pond elevation associated with the 100-year rainfall in Pond IA is 10.76 feetNGVD29 (approximately 10 feet NAVD88).2
MEMORANDUMFigure 2. Watershed Areas3
MEMORANDUM<strong>Interior</strong> <strong>Drainage</strong> AnalysisAn interior drainage analysis was per<strong>for</strong>med to assess the residual flooding in the area protected by the<strong>Potomac</strong> <strong>Park</strong> Levee system. This analysis looks at both the impacts of rainfall within the District ofColumbia (the interior area) and flood stages on the <strong>Potomac</strong> River and the interaction between theinterior and exterior conditions.The approach <strong>for</strong> the interior drainage analysis relies on an assessment of a range of scenarios to quantifythe anticipated range of flooding associated with the interior ponding area. In several of these scenariosthe impact of the pumping stations were not directly considered. This was deemed necessary because ofthe fact that the system serves an area much larger than the Federal Triangle area. As such, the ability ofthe pumping stations to evacuate floodwaters from the Federal Triangle area depends on the geographicaldistribution of rain and the timing of runoff produced by areas geographically far removed from theFederal Triangle and the pumping stations. There<strong>for</strong>e, the operating procedures <strong>for</strong> the pumping stationsdo not definitively address flooding in the Federal Triangle area in a way that would satisfy the FEMArequirements.Watershed DataTo support the analysis WASA provided a map delineating the Federal Triangle Basin Catchments. Thismap is provided in Appendix A and identifies the individual sewersheds associated with each combinedsewer outflow (CSO). Following the sewershed map is a schematic that shows the layout of the sewersystem in the study area. In conjunction, these two maps with Figure 2 illustrate that the boundary of thewatershed on the ground surface changes once flow is conveyed into the pipe system.Throughout the watershed stormwater is picked up by catch basins distributed throughout the system.WASA provided in<strong>for</strong>mation <strong>for</strong> each sewershed regarding the number of catch basins and the capacity ofthose catch basins to convey flow into the pipe network system.Ponding AreaRunoff that is not conveyed into the pipe system via the catch basins will flow down the streets to the lowpoint of the watershed which is the Federal Triangle area. Once water reaches this area it will collect andpond. Elevation-volume curves were generated using the 2008 LiDAR data that was provided throughthe Office of the Chief Technology Officer (OCTO). Contours and subsequent 3D raster surfaces werecreated from the LiDAR points which were spaced at 100-ft intervals, allowing 2-ft contours to begenerated. Some areas of the topo are distorted due to ‘blurring’ of the data in areas of high nationalsecurity priority such as around the White House, Washington Memorial, and the Capital. The data wasassembled and analyzed in ArcGIS 9.2. The storage-elevation curve is included in Appendix B.<strong>Interior</strong> <strong>Drainage</strong> OutletsThe interior drainage of the Federal Triangle can be drained in two ways: (1) the Constitution Avenuegravity storm drain and (2) the B Street / New Jersey combined sewer system. The Constitution Avenuegravity storm drain ranges in diameter from 57” to 72” pipe and runs <strong>for</strong> approximately one mile alongConstitution Avenue from 6th Street NW to 15th Street NW.The storm drain then turns south, crosses the <strong>National</strong> Mall, and discharges to the <strong>Potomac</strong> River at theTidal Basin. Appendix A includes an analysis of the outlet capacity of this pipe under different tailwaterconditions.The B Street / New Jersey combined sewer flows to the O Street and Main Pumping Stations. Thecombined sewer also contains two gravity overflow points that discharge flows to the Anacostia River.4
MEMORANDUMThe two pump stations are both separated into a sanitary and stormwater side. The sanitary side of bothpump stations pump flows to the Blue Plains Treatment Plant. The stormwater side of both pump stationsdischarges flows to the Anacostia River. The stormwater side of the O Street Pump Station contains 6-100 MGD pumps (design capacity 500 MGD (775 cfs) with one pump held in reserve.) The stormwaterside of the Main Pumping Station contains 6-80 MGD pumps (400 MGD (620 cfs) capacity with onepump held in reserve.) While O Street and Main Pumping Stations are both connected to the B Street /New Jersey combined sewer line, the sewer is primarily drained by the O Street Pump Station.<strong>Interior</strong> <strong>Drainage</strong> ModelUsing the U.S. Army Corps of Engineers (Corps) HEC-HMS software, a model of the Federal Trianglewatershed was developed. The following describes the drainage basin parameters that were used in themodel. Summary HEC-HMS data is provided <strong>for</strong> one analysis scenario in Appendix B. All input andoutput files are included on the CD attached to this memorandum.The HMS model was used to generate runoff throughout the watershed area, route the flows down to thelow point (the Federal Triangle), and route the flows through the detention basins using various outletscenarios. The model was also used to determine the elevation of the interior pond.<strong>Drainage</strong> AreaA sewershed shapefile, provided by WASA, was used as the basis <strong>for</strong> the subwatersheds in the HEC-HMS model. The sewersheds were clipped to match the extent of the Federal Triangle overland flowdrainage area, also provided by WASA as a shapefile. The subsequent clipped sewersheds were used tocalculate drainage areas and assist in delineating flow routes <strong>for</strong> the HEC-HMS model. Sewershedprocessing was done in ArcGIS.The topographic data base used is a 2008 LiDAR dataset provided by OCTO. Spot checks were donebetween this dataset and the previous OCTO data that was generated in 2004. This verification resultedin elevation discrepancies on the order of 2.5 feet. The 2008 data was corrected to remove the effects ofvegetation while this was not done in the 2004 data. The 2004 data has a smaller grid (1 meter) ascompared to the 100-foot grid in the 2008 data. Data from the U.S. Coastal and Geodetic (USCG) Surveywere obtained <strong>for</strong> several benchmarks in the study area and compared with elevations from the 2004 and2008 data at the same locations. Several of these points are shown in the table below.Table 1. Elevation ComparisonPoint USCG 2004 2008 Locationelevation elevation elevation1 11.02’ 10.12’ 11.2’ Capitol Grounds2 6.23’ 6.58’ 4.21’ Constitution & 9 th3 6.49’ 6.74’ 4.00’ Pennsylvania & 9 th4 12.30’ 12.83’ 12.69’ Constitution & 15 th5 14.56’ 14.56’ 14.05’ Pennsylvania & 13 thAn analysis of the data indicates that agreement among all 3 data sets is good except along ConstituionAvenue. In this area the USCG and 2004 data are approximately 2 feet to 2.5’ higher than the 2008 data.The 2008 data was used <strong>for</strong> this analysis because it is the most recent available data. If further analysisby OCTO results in a shift in the 2008 elevations along Constitution Avenue it would have some impacton the ponding elevation and ponding footprint. Preliminary analyses were per<strong>for</strong>med to assess the likelyrange of impact if elevations along Constitution Avenue were increased by 2.5’. The results of this5
MEMORANDUManalysis show that the ponding elevation and footprint are unaffected due to the relatively small volumeof storage in question.RainfallVarious rainfall frequency events were defined in the HMS model. The rainfall amounts wereinterpolated from the NOAA Atlas 14, Volume 2 and are shown below in Table 1. The SCS 24-hourType II rainfall distribution was used.Table 2. Precipitation DepthFrequencyPrecipitation(inches)100-year 8.3050-year 7.1510-year 4.802-year 3.14LossesUsing the SCS method, a curve number was defined <strong>for</strong> each of the sewersheds. Table 2 shows thevalues that were used <strong>for</strong> the land types found in the watershed. Based on visual inspection of the aerialphotography a composite <strong>for</strong> the sewershed was developed using the Table 2 values. The final curvenumbers ranged from 70 to 93.Land Type DescriptionTable 3. SCS Curve NumbersSCS CNUrban: Commercial 93Residential: 1/8 acre or less 89Open Space: Good 70RoutingLag times were developed within each sewershed to determine the time <strong>for</strong> the runoff to reach thecollection point of the sewershed. Flow Velocity was calculated based on the Manning’s equation:V = (1.49/n) x R 0.67 x S 0.5A Manning’s n-value of 0.013 was used to represent asphalt, a typical street section was used todetermine the hydraulic radius (R), and the slopes were identified from the topographic data. Times ofconcentration <strong>for</strong> each sewershed ranged from 2 minutes (5 minute minimum used in the analysis) to 19minutes. From the base of each sewershed routing reaches were identified along which to convey flow tothe low area in the Federal Triangle. Flow routes were determined through interpretation of the digitalelevation models topography as well as the CSO network in<strong>for</strong>mation.ReservoirThe reservoir component of the HEC-HMS model was used to determine the depth of ponding that wouldresult from the watershed runoff.Pond Outlet6
MEMORANDUMAs described previously, flow can be discharged from the pond via a gravity drain or through the pumpstations. Various HMS simulations were set up to analyze the impacts of the possible outlets.<strong>Interior</strong> <strong>Drainage</strong> ScenariosA series of simulations were per<strong>for</strong>med to assess various scenarios. The following pages include the mapshowing the interior ponding elevation resulting from each simulation. The maps were generated usingthe LiDAR topographic base. Minor manual corrections were made to compensate at the locations wherethe topography had been obscured <strong>for</strong> security reasons. These locations included the WashingtonMonument grounds and the Capitol grounds. The maps show the inundation area associated with thatscenario as well as the one determined in the 1992 Corps study.Scenario 1 – no outletsIn this simulation the total runoff from a 100-year storm was routed down to the Federal Triangle. Theriver stage was assumed to be at the 100-year level at which time the gravity drain outlet has negligibleimpact on the pond elevation. The pumps were not used to drain the interior in order to reflect theuncertain operational procedures. Thus, this scenario is a conservative estimate of the interior pondingarea and was generated to establish a maximum extent of the expected inundated area. The elevation ofthe ponded area was calculated based on the elevation-storage curve to be 9.4 feet NAVD88 and thefootprint of the area is shown on the map included as Exhibit 1.It should be noted that 3 tunnel entrances are located within the identified interior drainage area or northof the area. This will allow water to enter the tunnels and be conveyed to the south. The inundation areashown on Exhibit 1 includes a ponding area south of the main pond that identifies the ponding at thesouth limit of the tunnel. It should be noted that the analysis per<strong>for</strong>med does not consider storage withinthe tunnel.Scenario 2 – catch basin diversionsIn this simulation the runoff from a 100-year storm was generated <strong>for</strong> the watershed. The capacity of thecatch basins was modeled to divert flow out of the watershed. It is assumed that the water will beconveyed through the combined sewer pipe system and the pump stations will discharge the flow to theBlue Plains Treatment Plant or the Anacostia River. The flow not collected by the catch basins wasrouted to the Federal Triangle and allowed to pond in the low areas. The river stage was assumed to be atthe 100-year level at which time the gravity drain outlet has negligible impact on the pond elevation. Theelevation of the ponded area was calculated based on the elevation-storage curve. The interior pondelevation in this scenario is 6.1 feet NAVD88 and the footprint of the area is shown on the map includedas Exhibit 2. This scenario produces a minimum 1% probability interior area flood stage.The Scenario 2 flooded area is smaller compared to Scenario 1 due to the significant diversion of flowthat is assumed to occur through the catch basins. The analysis of the catch basins (included in AppendixA) assumes that 25% of the catch basins are clogged and accept minimal flow while the remaining catchbasins are fully operable under orifice flow. Flow that bypasses the catch basin in the originatingwatershed is not given an opportunity to enter the system at a downstream catch basin, but is routed to theFederal Triangle. An underlying assumption of this analysis is that the pipes have sufficient capacity toconvey the flow collected by the catch basins. The ability of the pipes to convey that capacity is in partdependent on the operation of the combined system contributing to the pump stations and the operation ofthe pump stations themselves. This scenario provides a possible inundation limit that could result under acertain pumping operation.It should be noted that 3 tunnel entrances are located within the identified interior drainage area or northof the area. This will allow water to enter the tunnels and be conveyed to the south. The inundation area7
MEMORANDUMshown on Exhibit 2 includes a ponding area south of the main pond that identifies the ponding at thesouth limit of the tunnel. It should be noted that the analysis per<strong>for</strong>med does not consider storage withinthe tunnel.Scenario 3 – pump dischargeIn this simulation the total runoff from a 100-year storm was routed down to the Federal Triangle. Nodiversion of flow through the combined sewer system in the watershed was considered. The pumpingcapacity of the O Street pump station was used to drain the ponded areas. Based on the design capacity ofthe pump station, a constant pumping rate of 500 MGD was used. The river stage was assumed to be atthe 100-year level at which time the gravity drain outlet has negligible impact on the pond elevation. Themaximum elevation of the ponded interior in this scenario is 7.6 feet NAVD88; the footprint of the area isshown on the map included as Exhibit 3.It should be noted that 3 tunnel entrances are located within the identified interior drainage area or northof the area. This will allow water to enter the tunnels and be conveyed to the south. The inundation areashown on Exhibit 3 includes a ponding area south of the main pond that identifies the ponding at thesouth limit of the tunnel. It should be noted that the analysis per<strong>for</strong>med does not consider storage withinthe tunnel.An assumption made in this analysis is that the full pumping capacity of the O Street pump station isavailable to drain the Federal Triangle area which is part of the B / NJ combined sewer. However, asshown in the schematic of the system (included in Appendix A) B St /NJ also drains a large area upstreamof the Federal Triangle. The upstream system includes many other pump stations and combined seweroverflow points. Previous modeling ef<strong>for</strong>ts made by WASA indicate that during the 100-year stormevent, the pipes downstream of the Federal Triangle are conveying 900+ cfs. This indicates that thepumps cannot fully keep up with the total flow in the system and some ponding would be expected. Thisscenario provides another possible inundation limit that could results under certain pumping operations.However its likely that the pumps would be partially (rather than full) used to drain the Federal Trianglearea. This would indicate that a realistic interior pond that accounts <strong>for</strong> the pumping as the only pondoutlet is between the one shown in this scenario (7.6 feet) and Scenario 1 (9.4 feet) where no pumping isconsidered.Scenario 4 – gravity drainThis scenario is a joint probability analysis that looks at a range of rainfalls on the interior and the abilityof the Constitution Avenue drain (the gravity drain outlet) to discharge from the Federal Triangle areabased on a range of river stages in the <strong>Potomac</strong> River. High stages on the <strong>Potomac</strong> River impact theinterior flooding only at the Constitution Avenue gravity drain outlet. This outlet includes a closurestructure so flow from the river cannot backup into the Federal Triangle area; however during high riverstage, the interior would need to pond to a sufficient depth to create enough hydraulic head to <strong>for</strong>ce flowthrough this drain. The details of the joint probability analysis are included in Appendix C. A review ofthe results shows that the stage of the river has little impact on the elevation of the pond interior. Thissame conclusion was reached in the 1992 Corps study. Based on the analysis of this scenario, the interiorpond elevation that has a 1% probability of occurring is 9.3 feet NAVD88; the footprint of the area isshown on the map included as Exhibit 4.No direct benefit of the pumping station is considered in this scenario. However an indirect benefitconsidered is that the pumping capacity will provide enough relief to the combined sewers that nosurcharging of the B St / NJ Avenue line will occur through the Federal Triangle area.It should be noted that 3 tunnel entrances are located within the identified interior drainage area or northof the area. This will allow water to enter the tunnels and be conveyed to the south. The inundation areashown on Exhibit 4 includes a ponding area south of the main pond that identifies the ponding at the8
MEMORANDUMsouth limit of the tunnel. It should be noted that the analysis per<strong>for</strong>med does not consider storage withinthe tunnel.Future StudiesIt should be noted that an additional study that addresses the interior drainage is anticipated to begin inthe near future. This study will be per<strong>for</strong>med by DC WASA in conjunction with the <strong>National</strong> CapitalPlanning Commission, the District of Columbia, the General Services Administration, the SmithsonianInstitute, and FEMA. This study will provide a more in-depth analysis of the complexities of thecombined sewer system and the impact on the interior flooding through the District. It is anticipated thatthis study will provide a greater level of detail and eliminate some of the conservative assumptions usedin this study. The study will also identify alternatives to reduce the magnitude and duration of predictedponding in the Federal Triangle area. At this time, the results of that study are expected to supersede thisstudy be<strong>for</strong>e the Letter of Map Revision is submitted <strong>for</strong> the <strong>Potomac</strong> <strong>Park</strong> Levee project.Conclusion and RecommendationScenarios 1 through 4 simulate interior drainage runoff and ponding <strong>for</strong> a range of conditions reflectingthe uncertainties inherent in the operation and per<strong>for</strong>mance of the WASA storm drain system, catchbasins, and pumping stations. Scenarios 1, 3, and 4 indicate maximum ponding elevations that rangefrom 7.6 feet to 9.4 feet NAVD88. The calculated 1% probability ponding elevations among thesescenarios is not significantly different. The Scenario 4 analysis with an estimated 1% probability interiorpond elevation of 9.3 feet NAVD88 is a conservative analysis of the ponding elevation <strong>for</strong> whichadequate documentation can be provided. The pond footprint associated with Scenario 4 is recommendedto be adopted as the interior drainage pond area associated with the Federal Triangle and is recommended<strong>for</strong> adoption as part of the FEMA Flood Insurance Rate Maps (FIRMs).9
Appendix ASewershed Catchment AreasCatch Basin Capacity AnalysisSewer System Schematic
CSO 049-fLEGENDCSO 010CSO 049-dCSO 012CSO 019CSO 049-cCSO 019-zCSO 019-abCSO 020CSO 035CSO 043CSO 049CSO 043-aCSO 019-yCSO 019-aaCSO 035-hMcMillan ReservoirCSO 019-xCSO 019-uCSO 019-wCSO 019-tCSO 019-vCSO 019-sCSO 019-rFederal Triangle <strong>Drainage</strong> BasinCSO 020-fCSO 012-gCSO 020-dH:\1163\Misc\Federal Triangle\Tetra Tech Ponding\FIGURE 4 - Federal Triangle <strong>Drainage</strong> Area with catchments.mxdEPMC-3ACSO 020-cD.C. WATER & SEWER AUTHORITYCSO 010-gCSO 020-eCSO 010-fCSO 010-eCSO 012-hFederal TriangleCSO 010-dCSO 012-eCSO 010-cCSO 012-dFEDERAL TRIANGLE DRAINAGE BASIN CATCHMENTS0 750 1,500 3,000 4,500 6,000FeetU.S. CapitolFIGURE 4
Total Capacity of Catch Basins in Federal Triangle <strong>Drainage</strong> BasinCatchbasinIn<strong>for</strong>mationSubshed# of catchbasinsInlet not submerged - per VDOT <strong>Drainage</strong>manual# of CBs(AssumingInletcapacityTotal CBCapacityTotal CBCapacityCB length(ft)CBopeningInlet submerged 6" deep - Treat like orifice: Q=0.6A(2gh) 0.5Area perCB (sq ft)Head onorifice (ft)25% per CB (cfs) (mgd)(ft)25% CB inlet opening(cfs) (cfs) (mgd)010-c 108 27 0.5 14 9 3 0.33 0.99 0.74 0.50 0.17 0.34 2.08 169 109 182 118010-d 110 27.5 0.5 14 9 3 0.33 0.99 0.74 0.50 0.17 0.34 2.08 172 111 186 120010-e 49 12.25 0.5 6 4 3 0.33 0.99 0.74 0.50 0.17 0.34 2.08 77 50 83 53010-f 105 26.25 0.5 13 8 3 0.33 0.99 0.74 0.50 0.17 0.34 2.08 164 106 177 115010-g 106 26.5 0.5 13 9 3 0.33 0.99 0.74 0.50 0.17 0.34 2.08 166 107 179 116012-d 92 23 0.5 12 7 3 0.33 0.99 0.74 0.50 0.17 0.34 2.08 144 93 155 100012-e 300 75 0.5 38 24 3 0.33 0.99 0.74 0.50 0.17 0.34 2.08 469 303 507 327012-g 191 47.75 0.5 24 15 3 0.33 0.99 0.74 0.50 0.17 0.34 2.08 299 193 322 208012-h 148 37 0.5 19 12 3 0.33 0.99 0.74 0.50 0.17 0.34 2.08 231 150 250 162019-r 80 20 0.5 10 6 3 0.33 0.99 0.74 0.50 0.17 0.34 2.08 125 81 135 87019-s 108 27 0.5 14 9 3 0.33 0.99 0.74 0.50 0.17 0.34 2.08 169 109 182 118019-t 56 14 0.5 7 5 3 0.33 0.99 0.74 0.50 0.17 0.34 2.08 88 57 95 61019-u 186 46.5 0.5 23 15 3 0.33 0.99 0.74 0.50 0.17 0.34 2.08 291 188 314 203019-v 85 21.25 0.5 11 7 3 0.33 0.99 0.74 0.50 0.17 0.34 2.08 133 86 144 93019-w 269 67.25 0.5 34 22 3 0.33 0.99 0.74 0.50 0.17 0.34 2.08 421 272 454 294019-x 116 29 0.5 15 9 3 0.33 0.99 0.74 0.50 0.17 0.34 2.08 181 117 196 127019-y 172 43 0.5 22 14 3 0.33 0.99 0.74 0.50 0.17 0.34 2.08 269 174 290 188019-z 140 35 0.5 18 11 3 0.33 0.99 0.74 0.50 0.17 0.34 2.08 219 141 236 153019-aa 130 32.5 0.5 16 11 3 0.33 0.99 0.74 0.50 0.17 0.34 2.08 203 131 220 142019-ab 74 18.5 0.5 9 6 3 0.33 0.99 0.74 0.50 0.17 0.34 2.08 116 75 125 81020-c 97 24.25 0.5 12 8 3 0.33 0.99 0.74 0.50 0.17 0.34 2.08 152 98 164 106020-d 156 39 0.5 20 13 3 0.33 0.99 0.74 0.50 0.17 0.34 2.08 244 158 263 170020-e 94 23.5 0.5 12 8 3 0.33 0.99 0.74 0.50 0.17 0.34 2.08 147 95 159 103020-f 112 28 0.5 14 9 3 0.33 0.99 0.74 0.50 0.17 0.34 2.08 175 113 189 122035-h 79 19.75 0.5 10 6 3 0.33 0.99 0.74 0.50 0.17 0.34 2.08 124 80 133 86043-a 46 11.5 0.5 6 4 3 0.33 0.99 0.74 0.50 0.17 0.34 2.08 72 46 78 50049-c 212 53 0.5 27 17 3 0.33 0.99 0.74 0.50 0.17 0.34 2.08 331 214 358 231049-d 131 32.75 0.5 16 11 3 0.33 0.99 0.74 0.50 0.17 0.34 2.08 205 132 221 143049-f 121 30.25 0.5 15 10 3 0.33 0.99 0.74 0.50 0.17 0.34 3.40 309 199 324 209Area perCB withWaterDepth @Centerlineof CBQ intoeach CBTotal CBCapacityTotal CBCapacityTotal CapacityCFSMGD
Appendix BStorage-Elevation CurveHEC-HMS Summary output (100-year rainfall, gravity drain outlet)Joint Probability Analysis
ELEVATION (ft)STORAGE (af)0 0.00Storage-Elevation Curve3.5 84.17164 135.794.5 213.545 312.89145.5 434.836 580.67126.5 754.407 947.967.5 1156.198 1375.578.5 1614.649 1865.319.5 2128.2810 2403.2410.5 2692.7811 2990.0011.5 3294.0112 3603.8812.5 3924.4013 4248.7613.5 4576.7114 4908.2214.5 5245.6615 5585.44Elevation (ft)10864200.00 1000.00 2000.00 3000.00 4000.00 5000.00 6000.00Storage (af)
Project:DC HEC HMS Simulation Run: 100yr 24hr-noDiv,w/OutletStart of Run: 01Jan2000, 00:00 Basin Model: DC Basin-NoDiv,w/OutlEnd of Run: 02Jan2000, 01:00 Meteorologic Model: SCS 100yr-24hrCompute Time: 21Jan2009, 13:35:29 Control Specifications: 24-HRVolume Units: INHydrologicElement<strong>Drainage</strong> Area(MI2)Peak Discharge(CFS)Time of PeakVolume(IN)010-c 0.119411 487.1 01Jan2000, 12:10 8.17010-d 0.143024 713.4 01Jan2000, 12:05 7.94010-e 0.106172 684.8 01Jan2000, 11:58 7.94010-f 0.155635 933.1 01Jan2000, 12:00 7.94010-g 0.172351 1021.2 01Jan2000, 12:01 8.17012-d 0.138559 925.9 01Jan2000, 11:58 8.17012-e 0.328665 1749.3 01Jan2000, 12:03 8.17012-g 0.261754 1562.4 01Jan2000, 12:01 8.17012-h 0.202255 1336.8 01Jan2000, 11:58 8.17019-aa 0.274847 1024.7 01Jan2000, 12:07 6.15019-ab 0.289872 1906.2 01Jan2000, 11:58 7.76019-r 0.107064 669.5 01Jan2000, 11:59 8.03019-s 0.186882 826.1 01Jan2000, 12:08 7.84019-t 0.092788 590.0 01Jan2000, 11:59 7.84019-u 0.256473 1596.1 01Jan2000, 11:59 7.84019-v 0.110934 601.0 01Jan2000, 12:03 7.84019-w 0.342820 1430.3 01Jan2000, 12:09 7.84019-x 0.240868 1599.7 01Jan2000, 11:58 8.03019-y 0.261430 1696.1 01Jan2000, 11:58 7.84019-z 0.303061 1490.3 01Jan2000, 12:01 6.15020-c, Outside 0.349647 2311.7 01Jan2000, 11:58 7.94020-d 0.062320 416.4 01Jan2000, 11:58 8.17020-e 0.115978 775.0 01Jan2000, 11:58 8.17020-f 0.150275 856.7 01Jan2000, 12:02 8.17035-h 0.079981 525.8 01Jan2000, 11:58 7.84Page 1
HydrologicElement<strong>Drainage</strong> Area(MI2)Peak Discharge(CFS)Time of PeakVolume(IN)049-c,043-a 0.071716 406.4 01Jan2000, 12:02 7.84049-d 0.093847 617.0 01Jan2000, 11:58 7.84049-f 0.049346 356.3 01Jan2000, 11:55 7.84Junction-1 1.010973 4770.1 01Jan2000, 12:05 6.85Junction-2 1.862532 8218.5 01Jan2000, 12:12 7.33Junction-3 2.654865 10528.9 01Jan2000, 12:13 7.48Junction-A 0.858814 3790.4 01Jan2000, 12:04 8.13Junction-B 5.067975 12254.0 01Jan2000, 12:52 7.77Reach-01 0.049346 356.3 01Jan2000, 11:57 7.84Reach-02 0.143193 969.0 01Jan2000, 12:12 7.84Reach-03 0.289872 1906.2 01Jan2000, 12:05 7.76Reach-04 0.446254 1864.8 01Jan2000, 12:05 6.69Reach-05 1.010973 4770.1 01Jan2000, 12:12 6.85Reach-06 1.862532 8218.5 01Jan2000, 12:13 7.33Reach-07 0.261430 1696.1 01Jan2000, 12:04 7.84Reach-08 0.502298 2945.6 01Jan2000, 12:13 7.93Reach-09 0.071716 406.4 01Jan2000, 12:04 7.84Reach-10 0.151697 864.9 01Jan2000, 12:12 7.84Reach-11 0.494517 2272.4 01Jan2000, 12:18 7.84Reach-12 0.605451 2472.2 01Jan2000, 12:27 7.84Reach-13 2.654865 10528.9 01Jan2000, 12:15 7.48Reach-14 2.761929 10662.6 01Jan2000, 12:18 7.50Reach-15 3.023683 10997.0 01Jan2000, 12:33 7.56Reach-16 3.352348 11261.1 01Jan2000, 12:52 7.61Reach-A 0.150275 856.7 01Jan2000, 12:10 8.17Reach-B 0.328573 1580.9 01Jan2000, 12:04 8.17Reach-C 0.500924 2545.7 01Jan2000, 12:10 8.17Reach-D 0.202255 1336.8 01Jan2000, 11:59 8.17Reach-E 0.858814 3790.4 01Jan2000, 12:09 8.13Reach-F 0.964986 4035.7 01Jan2000, 12:12 8.11Reach-G 0.349647 2311.7 01Jan2000, 12:17 7.94Page 2
Project: DC HEC HMSSimulation Run: 100yr 24hr-noDiv,w/Outlet Reservoir: Res-OutletStart of Run: 01Jan2000, 00:00 Basin Model: DC Basin-NoDiv,w/OutletEnd of Run: 02Jan2000, 01:00 Meteorologic Model: SCS 100yr-24hrCompute Time: 21Jan2009, 13:35:29 Control Specifications: 24-HRVolume Units: INComputed ResultsPeak Inflow : 12254.0 (CFS) Date/Time of Peak Inflow : 01Jan2000, 12:52Peak Outflow : 0.0 (CFS) Date/Time of Peak Outflow : 01Jan2000, 00:00Total Inflow : 7.77 (IN) Peak Storage : 2099.7 (AC-FT)Total Outflow : 0.00 (IN) Peak Elevation : 9.4 (FT)
JOINT PROBABILITY ANALYSIS FOR FEDERAL TRIANGLE (INTERIOR POND) AND RIVER (POTOMAC RIVER)Int Pond StageGRAVITY DRAIN OUTLET OF INTERIOR POND HEC-HMS FLOOD ROUTING RESULTS RIVER INDEX STAGE FOR CONDITIONAL PROBABILITY ANALYSISProportion oftime riverQ <strong>for</strong> Stage stage ProbabilityStageIntervalindexstageDischarge from <strong>Interior</strong> Pond (cfs) Based on Gravity Drain Outlet 100-year interior rainfall Stage (feet) (cfs) exceeded Interval (feet) (feet)Tailwater at 3.5' Tailwater at 4.5' Tailwater at 5.4' Tailwater at 6.7' Tailwater at 10.1' Tailwater at 12.0' vary tailwater <strong>for</strong> gravity drain outlet(2-year river stage) (10-year river stage) (50-year river stage) (100-year river stage) Tailwater* pond elev Maximum QoutProportion oftime riverstage is withinstage interval(ft)6.0 1.0 1.0 1.0 0.0 0.0 0.0 (feet) (feet) (cfs) 3 600 1.00000 NA NA6.5 3.7 3.7 3.7 0.0 0.0 0.0 3.5 9.3 4 25000 0.10600 B1 3 to 4 3.5 0.894007.0 39.8 39.8 39.8 18.1 0.0 0.0 4.5 9.3 5 90000 0.00650 B2 4 to 5 4.5 0.099507.5 70.3 59.0 49.9 29.5 0.0 0.0 5.4 9.3 6 147000 0.00118 B3 5 to 6 5.5 0.005328.0 73.7 65.8 55.6 38.6 0.0 0.0 6.7 9.3 7 202000 0.00059 B4 6 to 7 6.5 0.000598.5 78.2 70.3 61.2 45.8 0.0 0.0 10.1 9.4 8 262000 0.00032 B5 7 to 8 7.5 0.000279.0 82.8 74.8 65.8 52.2 0.0 0.0 12.0 9.4 9 320000 0.00015 B6 8 to 9 8.5 0.000179.5 86.2 78.2 70.5 57.8 0.0 0.0 10 375000 0.00009 B7 9 to 10 9.5 0.0000610.0 74.8 63.5 0.0 0.0 11 421000 0.00005 B8 10 to 11 10.5 0.0000410.5 79.4 68.0 20.4 0.0 50-year interior rainfall 12 457000 0.00001 B9 11 to 12 11.5 0.0000411.0 83.5 72.6 31.3 0.0 vary tailwater <strong>for</strong> gravity drain outlet Total = 0.9999911.5 87.3 76.7 39.7 0.0 Tailwater* pond elev Maximum Qout12.0 90.7 81.6 46.5 0.0 (feet) (feet) (cfs)12.5 94.6 85.0 53.3 22.7 3.5 8.713.0 98.2 88.9 59.0 34.0 4.5 8.713.5 101.4 92.3 64.2 41.5 5.4 8.714.0 104.8 96.2 68.9 48.5 6.7 8.814.5 107.7 99.3 73.7 54.4 10.1 8.915.0 111.1 103.0 77.8 59.2 12.0 8.9EXTERIORINTERIORRIVER STAGE at Tidal Basin Based on FIS Precipitation Frequency 10-year interior rainfall2-yr 5.4' precipitation frequency interior range vary tailwater <strong>for</strong> gravity drain outlet10-yr 6.68' 0.45" 1.3-yr 3.5' Tailwater* pond elev Maximum Qout50-yr 10.1' 1.0" 1.6-yr 4.5' (feet) (feet) (cfs)100-yr 12' 3.14" 2-yr 6.5' 3.5 7.44.8" 10-yr 7.4' - 7.5' 4.5 7.47.15" 50-yr 8.7' - 8.9' 5.4 7.48.3" 100-yr 9.3' - 9.5' 6.7 7.5Notes: Stage-Flow relationship based on HEC-RAS done <strong>for</strong> FIS 10.1 7.5Precipitation based on NOAA 2-yr - 100-yr; 1.3-yr and 1.6-yr interpolated 12.0 7.52-year interior rainfallvary tailwater <strong>for</strong> gravity drain outletTailwater* pond elev Maximum Qout(feet) (feet) (cfs)3.5 6.54.5 6.55.4 6.56.7 6.510.1 6.512.0 6.5*Note - tailwater varied based on 2-yr, 10-yr, 50-yr, and 100-yrCONDITIONAL PROBABILITY ANALYSIS<strong>Interior</strong> Elevation River Stage=3.5' River Stage=4.5' River Stage=5.4' River Stage=6.5' River Stage=7.5' River Stage=8.5' River Stage=9.5' River Stage=10.5' River Stage=11.5' Weighted Probability(feet) P(B1) = 0.894 P(B1) = 0.0995 P(B1) = 0.00532 P(B2) = 0.00059 P(B3)= 0.00027 P(B4)= 0.00017 P(B5)= 0.00006 P(B5)= 0.00004 P(B7)= 0.00004 Pond Elevation0 1.0000 1.0000 1.0000 1.0000 1.0000 1.0000 1.0000 1.0000 1.00003.5 0.7692 0.7692 0.7692 0.7692 0.7692 0.7692 0.7692 0.7692 0.7692 77%4.5 0.6250 0.6250 0.6250 0.6250 0.6250 0.6250 0.6250 0.6250 0.6250 62%6.5 0.5000 0.5000 0.5000 0.5000 0.5000 0.5000 0.5000 0.5000 0.5000 50%7.4 0.1000 0.1000 0.1000 0.1100 0.1100 0.1100 0.1100 0.1100 0.1100 10%7.5 0.0760 0.0760 0.0760 0.1000 0.1000 0.1000 0.1000 0.1000 0.1000 8%8.7 0.0200 0.0200 0.0200 0.0200 0.0220 0.0220 0.0220 0.0220 0.0220 8%8.8 0.0170 0.0170 0.0170 0.0200 0.0200 0.0210 0.0210 0.0210 0.0210 8%8.9 0.0150 0.0150 0.0150 0.0167 0.0170 0.0180 0.0190 0.0200 0.0200 8%9.3 0.0100 0.0100 0.0100 0.0100 0.0100 0.0111 0.0111 0.0125 0.0125 1%9.4 0.0008 0.0008 0.0008 0.0008 0.0008 0.00091 0.00091 0.0100 0.0100 0.83%<strong>Interior</strong> Pond Elevation with a 1% Probability of Occurrence: is 9.3 feet