download (pdf, 455 kb) - Institute of Pharmacology and Toxicology
download (pdf, 455 kb) - Institute of Pharmacology and Toxicology
download (pdf, 455 kb) - Institute of Pharmacology and Toxicology

Create successful ePaper yourself
Turn your PDF publications into a flip-book with our unique Google optimized e-Paper software.
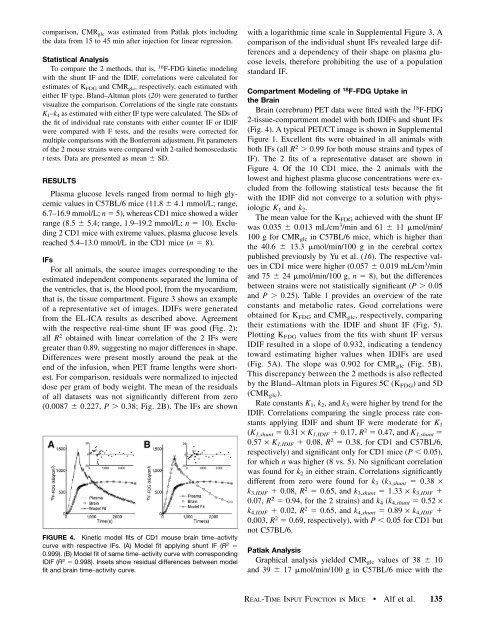
comparison, CMR glc was estimated from Patlak plots includingthe data from 15 to 45 min after injection for linear regression.Statistical AnalysisTo compare the 2 methods, that is, 18 F-FDG kinetic modelingwith the shunt IF <strong>and</strong> the IDIF, correlations were calculated forestimates <strong>of</strong> K FDG <strong>and</strong> CMR glc , respectively, each estimated witheither IF type. Bl<strong>and</strong>–Altman plots (20) were generated to furthervisualize the comparison. Correlations <strong>of</strong> the single rate constantsK 1 –k 4 as estimated with either IF type were calculated. The SDs <strong>of</strong>the fit <strong>of</strong> individual rate constants with either counter IF or IDIFwere compared with F tests, <strong>and</strong> the results were corrected formultiple comparisons with the Bonferroni adjustment. Fit parameters<strong>of</strong> the 2 mouse strains were compared with 2-tailed homoscedastict tests. Data are presented as mean 6 SD.RESULTSPlasma glucose levels ranged from normal to high glycemicvalues in C57BL/6 mice (11.8 6 4.1 mmol/L; range,6.7–16.9 mmol/L; n 5 5), whereas CD1 mice showed a widerrange (8.5 6 5.4; range, 1.9–19.2 mmol/L; n 5 10). Excluding2 CD1 mice with extreme values, plasma glucose levelsreached 5.4–13.0 mmol/L in the CD1 mice (n 5 8).IFsFor all animals, the source images corresponding to theestimated independent components separated the lumina <strong>of</strong>the ventricles, that is, the blood pool, from the myocardium,that is, the tissue compartment. Figure 3 shows an example<strong>of</strong> a representative set <strong>of</strong> images. IDIFs were generatedfrom the EL-ICA results as described above. Agreementwith the respective real-time shunt IF was good (Fig. 2);all R 2 obtained with linear correlation <strong>of</strong> the 2 IFs weregreater than 0.89, suggesting no major differences in shape.Differences were present mostly around the peak at theend <strong>of</strong> the infusion, when PET frame lengths were shortest.For comparison, residuals were normalized to injecteddose per gram <strong>of</strong> body weight. The mean <strong>of</strong> the residuals<strong>of</strong> all datasets was not significantly different from zero(0.0087 6 0.227, P . 0.38; Fig. 2B). The IFs are shownFIGURE 4. Kinetic model fits <strong>of</strong> CD1 mouse brain time–activitycurve with respective IFs. (A) Model fit applying shunt IF (R 2 50.999). (B) Model fit <strong>of</strong> same time–activity curve with correspondingIDIF (R 2 5 0.998). Insets show residual differences between modelfit <strong>and</strong> brain time–activity curve.with a logarithmic time scale in Supplemental Figure 3. Acomparison <strong>of</strong> the individual shunt IFs revealed large differences<strong>and</strong> a dependency <strong>of</strong> their shape on plasma glucoselevels, therefore prohibiting the use <strong>of</strong> a populationst<strong>and</strong>ard IF.Compartment Modeling <strong>of</strong> 18 F-FDG Uptake inthe BrainBrain (cerebrum) PET data were fitted with the 18 F-FDG2-tissue-compartment model with both IDIFs <strong>and</strong> shunt IFs(Fig. 4). A typical PET/CT image is shown in SupplementalFigure 1. Excellent fits were obtained in all animals withboth IFs (all R 2 . 0.99 for both mouse strains <strong>and</strong> types <strong>of</strong>IF). The 2 fits <strong>of</strong> a representative dataset are shown inFigure 4. Of the 10 CD1 mice, the 2 animals with thelowest <strong>and</strong> highest plasma glucose concentrations were excludedfrom the following statistical tests because the fitwith the IDIF did not converge to a solution with physiologicK 1 <strong>and</strong> k 2 .The mean value for the K FDG achieved with the shunt IFwas 0.035 6 0.013 mL/cm 3 /min <strong>and</strong> 61 6 11 mmol/min/100 g for CMR glc in C57BL/6 mice, which is higher thanthe 40.6 6 13.3 mmol/min/100 g in the cerebral cortexpublished previously by Yu et al. (16). The respective valuesin CD1 mice were higher (0.057 6 0.019 mL/cm 3 /min<strong>and</strong> 75 6 24 mmol/min/100 g, n 5 8), but the differencesbetween strains were not statistically significant (P . 0.05<strong>and</strong> P . 0.25). Table 1 provides an overview <strong>of</strong> the rateconstants <strong>and</strong> metabolic rates. Good correlations wereobtained for K FDG <strong>and</strong> CMR glc , respectively, comparingtheir estimations with the IDIF <strong>and</strong> shunt IF (Fig. 5).Plotting K FDG values from the fits with shunt IF versusIDIF resulted in a slope <strong>of</strong> 0.932, indicating a tendencytoward estimating higher values when IDIFs are used(Fig. 5A). The slope was 0.902 for CMR glc (Fig. 5B).This discrepancy between the 2 methods is also reflectedby the Bl<strong>and</strong>–Altman plots in Figures 5C (K FDG ) <strong>and</strong> 5D(CMR glc ).Rate constants K 1 , k 2 , <strong>and</strong> k 3 were higher by trend for theIDIF. Correlations comparing the single process rate constantsapplying IDIF <strong>and</strong> shunt IF were moderate for K 1(K 1,shunt 5 0.31 · K 1,IDIF 1 0.17, R 2 5 0.47, <strong>and</strong> K 1,shunt 50.57 · K 1,IDIF 1 0.08, R 2 5 0.38, for CD1 <strong>and</strong> C57BL/6,respectively) <strong>and</strong> significant only for CD1 mice (P , 0.05),for which n was higher (8 vs. 5). No significant correlationwas found for k 2 in either strain. Correlations significantlydifferent from zero were found for k 3 (k 3,shunt 5 0.38 ·k 3,IDIF 1 0.08, R 2 5 0.65, <strong>and</strong> k 3,shunt 5 1.33 · k 3,IDIF 10.07, R 2 5 0.94, for the 2 strains) <strong>and</strong> k 4 (k 4,shunt 5 0.52 ·k 4,IDIF 1 0.02, R 2 5 0.65, <strong>and</strong> k 4,shunt 5 0.89 · k 4,IDIF 10.003, R 2 5 0.69, respectively), with P , 0.05 for CD1 butnot C57BL/6.Patlak AnalysisGraphical analysis yielded CMR glc values <strong>of</strong> 38 6 10<strong>and</strong> 39 6 17 mmol/min/100 g in C57BL/6 mice with theREAL-TIME INPUT FUNCTION IN MICE • Alf et al. 135