download (pdf, 455 kb) - Institute of Pharmacology and Toxicology
download (pdf, 455 kb) - Institute of Pharmacology and Toxicology
download (pdf, 455 kb) - Institute of Pharmacology and Toxicology

You also want an ePaper? Increase the reach of your titles
YUMPU automatically turns print PDFs into web optimized ePapers that Google loves.
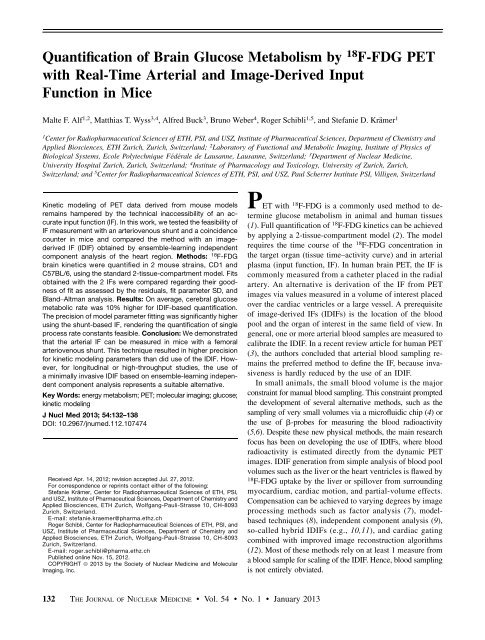
Quantification <strong>of</strong> Brain Glucose Metabolism by 18 F-FDG PETwith Real-Time Arterial <strong>and</strong> Image-Derived InputFunction in MiceMalte F. Alf 1,2 , Matthias T. Wyss 3,4 , Alfred Buck 3 , Bruno Weber 4 , Roger Schibli 1,5 , <strong>and</strong> Stefanie D. Krämer 11Center for Radiopharmaceutical Sciences <strong>of</strong> ETH, PSI, <strong>and</strong> USZ, <strong>Institute</strong> <strong>of</strong> Pharmaceutical Sciences, Department <strong>of</strong> Chemistry <strong>and</strong>Applied Biosciences, ETH Zurich, Zurich, Switzerl<strong>and</strong>; 2 Laboratory <strong>of</strong> Functional <strong>and</strong> Metabolic Imaging, <strong>Institute</strong> <strong>of</strong> Physics <strong>of</strong>Biological Systems, Ecole Polytechnique Fédérale de Lausanne, Lausanne, Switzerl<strong>and</strong>; 3 Department <strong>of</strong> Nuclear Medicine,University Hospital Zurich, Zurich, Switzerl<strong>and</strong>; 4 <strong>Institute</strong> <strong>of</strong> <strong>Pharmacology</strong> <strong>and</strong> <strong>Toxicology</strong>, University <strong>of</strong> Zurich, Zurich,Switzerl<strong>and</strong>; <strong>and</strong> 5 Center for Radiopharmaceutical Sciences <strong>of</strong> ETH, PSI, <strong>and</strong> USZ, Paul Scherrer <strong>Institute</strong> PSI, Villigen, Switzerl<strong>and</strong>Kinetic modeling <strong>of</strong> PET data derived from mouse modelsremains hampered by the technical inaccessibility <strong>of</strong> an accurateinput function (IF). In this work, we tested the feasibility <strong>of</strong>IF measurement with an arteriovenous shunt <strong>and</strong> a coincidencecounter in mice <strong>and</strong> compared the method with an imagederivedIF (IDIF) obtained by ensemble-learning independentcomponent analysis <strong>of</strong> the heart region. Methods: 18 F-FDGbrain kinetics were quantified in 2 mouse strains, CD1 <strong>and</strong>C57BL/6, using the st<strong>and</strong>ard 2-tissue-compartment model. Fitsobtained with the 2 IFs were compared regarding their goodness<strong>of</strong> fit as assessed by the residuals, fit parameter SD, <strong>and</strong>Bl<strong>and</strong>–Altman analysis. Results: On average, cerebral glucosemetabolic rate was 10% higher for IDIF-based quantification.The precision <strong>of</strong> model parameter fitting was significantly higherusing the shunt-based IF, rendering the quantification <strong>of</strong> singleprocess rate constants feasible. Conclusion: We demonstratedthat the arterial IF can be measured in mice with a femoralarteriovenous shunt. This technique resulted in higher precisionfor kinetic modeling parameters than did use <strong>of</strong> the IDIF. However,for longitudinal or high-throughput studies, the use <strong>of</strong>a minimally invasive IDIF based on ensemble-learning independentcomponent analysis represents a suitable alternative.Key Words: energy metabolism; PET; molecular imaging; glucose;kinetic modelingJ Nucl Med 2013; 54:132–138DOI: 10.2967/jnumed.112.107474Received Apr. 14, 2012; revision accepted Jul. 27, 2012.For correspondence or reprints contact either <strong>of</strong> the following:Stefanie Krämer, Center for Radiopharmaceutical Sciences <strong>of</strong> ETH, PSI,<strong>and</strong> USZ, <strong>Institute</strong> <strong>of</strong> Pharmaceutical Sciences, Department <strong>of</strong> Chemistry <strong>and</strong>Applied Biosciences, ETH Zurich, Wolfgang-Pauli-Strasse 10, CH-8093Zurich, Switzerl<strong>and</strong>.E-mail: stefanie.kraemer@pharma.ethz.chRoger Schibli, Center for Radiopharmaceutical Sciences <strong>of</strong> ETH, PSI, <strong>and</strong>USZ, <strong>Institute</strong> <strong>of</strong> Pharmaceutical Sciences, Department <strong>of</strong> Chemistry <strong>and</strong>Applied Biosciences, ETH Zurich, Wolfgang-Pauli-Strasse 10, CH-8093Zurich, Switzerl<strong>and</strong>.E-mail: roger.schibli@pharma.ethz.chPublished online Nov. 15, 2012.COPYRIGHT ª 2013 by the Society <strong>of</strong> Nuclear Medicine <strong>and</strong> MolecularImaging, Inc.PET with 18 F-FDG is a commonly used method to determineglucose metabolism in animal <strong>and</strong> human tissues(1). Full quantification <strong>of</strong> 18 F-FDG kinetics can be achievedby applying a 2-tissue-compartment model (2). The modelrequires the time course <strong>of</strong> the 18 F-FDG concentration inthe target organ (tissue time–activity curve) <strong>and</strong> in arterialplasma (input function, IF). In human brain PET, the IF iscommonly measured from a catheter placed in the radialartery. An alternative is derivation <strong>of</strong> the IF from PETimages via values measured in a volume <strong>of</strong> interest placedover the cardiac ventricles or a large vessel. A prerequisite<strong>of</strong> image-derived IFs (IDIFs) is the location <strong>of</strong> the bloodpool <strong>and</strong> the organ <strong>of</strong> interest in the same field <strong>of</strong> view. Ingeneral, one or more arterial blood samples are measured tocalibrate the IDIF. In a recent review article for human PET(3), the authors concluded that arterial blood sampling remainsthe preferred method to define the IF, because invasivenessis hardly reduced by the use <strong>of</strong> an IDIF.In small animals, the small blood volume is the majorconstraint for manual blood sampling. This constraint promptedthe development <strong>of</strong> several alternative methods, such as thesampling <strong>of</strong> very small volumes via a micr<strong>of</strong>luidic chip (4) orthe use <strong>of</strong> b-probes for measuring the blood radioactivity(5,6). Despite these new physical methods, the main researchfocus has been on developing the use <strong>of</strong> IDIFs, where bloodradioactivity is estimated directly from the dynamic PETimages. IDIF generation from simple analysis <strong>of</strong> blood poolvolumes such as the liver or the heart ventricles is flawed by18F-FDG uptake by the liver or spillover from surroundingmyocardium, cardiac motion, <strong>and</strong> partial-volume effects.Compensation can be achieved to varying degrees by imageprocessing methods such as factor analysis (7), modelbasedtechniques (8), independent component analysis (9),so-called hybrid IDIFs (e.g., 10,11), <strong>and</strong> cardiac gatingcombined with improved image reconstruction algorithms(12). Most <strong>of</strong> these methods rely on at least 1 measure froma blood sample for scaling <strong>of</strong> the IDIF. Hence, blood samplingis not entirely obviated.132 THE JOURNAL OF NUCLEAR MEDICINE • Vol. 54 • No. 1 • January 2013
To our knowledge, there is currently no gold st<strong>and</strong>ard todefine the real-time 18 F-FDG arterial IF in mice in a reliable<strong>and</strong> easily accessible manner. In this study, we adapted amethod for direct blood radioactivity measurements <strong>and</strong> anapproach for the generation <strong>of</strong> IDIFs for use in mice. Weacquired real-time blood radioactivity curves by means <strong>of</strong>a new coincidence counter in combination with an arteriovenousshunt <strong>and</strong> compared the findings to IDIFs generatedfrom PET data <strong>of</strong> the cardiac region with an ensemblelearningindependent component analysis (EL-ICA) algorithm(13). We used 2 different mouse strains to explore the possiblestrain dependency <strong>of</strong> our methods: C57BL/6 mice, becausethey are relevant for studies <strong>of</strong> genetically modified animals,<strong>and</strong> CD1 mice, because they are valuable as disease models,such as cerebral ischemia (14). The purpose <strong>of</strong> this work was2-fold. First, we evaluated whether the arteriovenous-shunt/counter technique, which was previously demonstrated inrats (15), is also feasible in mice. Second, we compared18F-FDG kinetic parameters <strong>and</strong> fit precisions obtained withthe experimental shunt IF <strong>and</strong> the IDIF.MATERIALS AND METHODSAnimal PreparationAll animal experiments were performed by licensed investigators,<strong>and</strong> the experimental procedures were reviewed by an ethicalcommittee <strong>and</strong> authorized by the veterinary authority <strong>of</strong> the cantonZurich. Methods conformed to the guidelines <strong>of</strong> the Swiss AnimalProtection Law (Act <strong>of</strong> Animal Protection, December 16, 2005, <strong>and</strong>Animal Protection Ordinances, April 23, 2008, <strong>and</strong> April 12, 2010).Male CD1 mice (n 5 10; weight, 37.2 6 2.6 g) <strong>and</strong> male C57BL/6mice (n 5 5; 26.1 6 1.4 g) were obtained from Charles River. Themice were housed under approved conditions with no special husb<strong>and</strong>ry<strong>and</strong> had free access to food <strong>and</strong> water before the experiments.For surgery, the animals were anesthetized with is<strong>of</strong>lurane atapproximately a 2% maintenance dose in a 2:1 mixture <strong>of</strong> air <strong>and</strong>oxygen. Body temperature was maintained at 37°C by means <strong>of</strong>a heating pad (Harvard Apparatus). Polyethylene catheters (PE10with an internal diameter <strong>of</strong> 0.28 mm; Smiths Medical) filled withheparinized (20 IU/mL) saline were inserted into the right femoralartery <strong>and</strong> vein with the help <strong>of</strong> a stereomicroscope <strong>and</strong> securelyfastened with ligatures (6-0 silk thread). Additionally, catheters wereheld in place with tape. The animals were kept under anesthesia forall subsequent procedures.Data AcquisitionAftertheanimalhadbeenplacedonthePET/CTscanner(VISTA eXplore [GE Healthcare]; axial FOV <strong>of</strong> 4.8 cm), a CTscout image was acquired <strong>and</strong> the bed position was adjusted forthe subsequent PET scan to include the heart <strong>and</strong> the brain in theFOV. The arterial <strong>and</strong> venous catheters were connected to anarteriovenous shunt running through a coincidence counter (twilite;Swisstrace GmbH) positioned next to the scanner bed. The volumeinside the counter was approximately 6 mL (10 cm <strong>of</strong> PE10). Thearteriovenous shunt was also used for radiotracer injection (Fig. 1).The total volume <strong>of</strong> the tube system was approximately 60 mL.Counter data were recorded with the acquisition tool <strong>of</strong> the imagings<strong>of</strong>tware, PMOD, version 3.3 (PMOD Technologies Inc.). A constantflow <strong>of</strong> 120 mL/min was maintained by a peristaltic pump(Ismatec; Wertheim-Mondfeld). This corresponds to about half theFIGURE 1. Schematic <strong>of</strong> arteriovenous shunt setup. Blood, driven byperistaltic pump, flows from femoral artery through coincidence probe<strong>and</strong> back to femoral vein. Two 3-way valves, t1 <strong>and</strong> t2, are used fortracer application <strong>and</strong> blood sampling, respectively.average velocity we, as well as Yu et al. (16), observed in a shortpiece <strong>of</strong> PE10 tube driven by the animal’s blood pressure <strong>and</strong> waschosen because it can be expected not to influence the overall <strong>and</strong>thus brain physiology within a normal blood pressure range.For PET acquisition, the respiration rate was monitored (1025L; SA Instruments) <strong>and</strong> maintained at 90 bpm by adjusting theis<strong>of</strong>lurane dose if required. Body temperature was kept at 37°C bya fan controlled by a rectal temperature probe. A dynamic listmodePET scan (45 min), recording <strong>of</strong> the blood coincidencecounter, <strong>and</strong> infusion <strong>of</strong> 18 F-FDG (routine production for clinicaluse; University Hospital Zurich) were started simultaneously.18F-FDG was infused in 100–150 mL <strong>of</strong> saline over a period <strong>of</strong>4–6 min with a syringe pump (Harvard Apparatus). Injected activitieswere between 10 <strong>and</strong> 16 MBq. Immediately after the PETacquisition, an arterial blood sample was collected in a heparinizedvial, <strong>and</strong> plasma was separated by centrifugation. Plasma glucosewas measured with a glucose oxidase/reflectance system (VitrosDT60 II; Ortho Clinical Diagnostics). Meanwhile, a CT scan wasacquired for anatomic orientation. The anesthetized animals werethen sacrificed by decapitation.The coincidence counter <strong>and</strong> PET scanner were calibrated tokBq/cm 3 once per day by means <strong>of</strong> a phantom scan: A 5-mLsyringe <strong>and</strong> a piece <strong>of</strong> PE10 tube were filled with the same 18 F-FDG solution <strong>of</strong> known radioactivity concentration (;1 MBq/mL),mimicking the conditions <strong>of</strong> a PET mouse scan. A static scan <strong>of</strong>5 min was acquired in parallel with a coincidence counter measurement<strong>of</strong> the PE10 tube.Image AnalysisPET images were reconstructed to a nominal voxel size <strong>of</strong>0.3875 · 0.3875 · 0.775 mm (actual resolution <strong>of</strong> 0.9 mm in fullwidth at half maximum in the center <strong>of</strong> the FOV (17)) with a3-dimensional FORE/2-dimensional OSEM algorithm <strong>and</strong> userdefinedtime frames. Scatter correction was applied. Data werenot corrected for attenuation, as suggested for mice by our recentsystem evaluation (17). The shortest frames had a duration <strong>of</strong> 10 s<strong>and</strong> were grouped around the time when infusion was stopped, thatis, when plasma 18 F-FDG concentration changed most rapidly.REAL-TIME INPUT FUNCTION IN MICE • Alf et al. 133
FIGURE 2. (A) Representative shunt IF <strong>and</strong> corresponding IDIF.Squares represent averaged radioactivity <strong>of</strong> each time frame at respectivemid time frame. (Inset) Differences (IDIF 2 shunt IF). Deviationsare mostly in short frames around peak where infusion stops.(B) Differences as in A from all scanned mice <strong>and</strong> their binnedmeans, normalized by injected dose per gram <strong>of</strong> body weight (st<strong>and</strong>ardizeduptake value [SUV]). Mean <strong>of</strong> residuals is not systematicallydifferent from zero (P . 0.38); their temporal average is 0.009 6 0.227.The maximum frame lengths toward the end <strong>of</strong> the scan were 4 min(Fig. 2). The s<strong>of</strong>tware package PMOD (PMOD Technologies Ltd.)was used for PET data analysis <strong>and</strong> kinetic modeling. For eachmouse, a brain volume <strong>of</strong> interest was defined manually correspondingto the cerebrum, guided by the coregistered CT scan (SupplementalFig. 1; supplemental materials are available online only athttp://jnm.snmjournals.org). The brain time–activity curve was generatedfrom this volume <strong>of</strong> interest <strong>and</strong> converted to kBq/cm 3 .Shunt/Coincidence Counter IFThe whole-blood radioactivity measurements from the coincidencecounter were corrected for counter crystal backgroundcounts. Background counts were about 125 cps, that is, 18%–25%<strong>of</strong> the maximum value around the infusion stop <strong>and</strong> 25%–70% <strong>of</strong>the total value at 45 min. The remaining coincidence counts werethen corrected for 18 F decay before conversion to plasma radioactivityby applying a correction for erythrocyte uptake, given byEquation 1 (16),A plasma 5 A whole blood · 0:39 · e 2 0:19t 1 1:17 ; Eq. 1where A plasma <strong>and</strong> A whole blood are the radioactivity in plasma <strong>and</strong>whole blood, respectively, at time t in minutes after the start <strong>of</strong>18F-FDG infusion. To reduce statistical noise caused by the r<strong>and</strong>omnature <strong>of</strong> radioactive decay, a moving average over 5 s wasused to smooth the IF. The experimentally determined dispersion<strong>of</strong> a 5-s step function in the coincidence counter tube was used toevaluate the influence <strong>of</strong> dispersion on the experimental IF. Thesimulated effect was negligible (Supplemental Fig. 2).IDIFA cuboid volume <strong>of</strong> interest was defined around the whole heart<strong>of</strong> each animal. A representative transversal cross-section is shownin Figure 3. PET image data within the volume <strong>of</strong> interest were transformedto a matrix with the format voxel · time frame with MATLAB(The MathWorks Inc.). The data matrix was processed by EL-ICA.The algorithm was developed by Naganawa et al. for human brainPET (13). The original EL-ICA framework was created at CambridgeUniversity (18). We adjusted the set <strong>of</strong> initial options to match theconvergence criteria <strong>and</strong> the initially assumed noise variance to ourdata. A rectified gaussian <strong>and</strong> a Laplacian-shaped distribution wereused as priors for the mixing matrix <strong>and</strong> source image, respectively.All time frames <strong>of</strong> the reconstructed PET data were included inthe analysis. Analogous to the analysis by Naganawa et al. (13),we assumed 2 components to be estimated by the EL-ICA, representingthe radioactivity in the blood <strong>and</strong> tissue compartments,respectively. The resulting time curve corresponding to the bloodcomponent was scaled with two 20-s averages from the decaycorrectedcoincidence counter data, one at roughly 1,000 s <strong>and</strong> theother at the middle <strong>of</strong> the last frame at 2,600 s. Scaling includedmultiplication by a factor <strong>and</strong> addition <strong>of</strong> a constant. The scaledcurves were then translated to plasma radioactivity, that is, to theIDIF, as described in Equation 1.Kinetic ModelingThe st<strong>and</strong>ard 18 F-FDG 2-tissue-compartment model (2) wasfitted to the brain time–activity curve, with either the IDIF or theshunt IF. For the latter, a delay corresponding to the transfer time <strong>of</strong>blood (approximately 10 s) from the femoral artery to the counter wasincluded in the model. Fitting was performed using the Levenberg–Marquardt algorithm. A blood fraction <strong>of</strong> 5.5% was assumed for thebrain time–activity curve, as indicated by recent micro-CT findings inmice (19). The 2-tissue-compartment model is defined by the followingrate constants: K 1 (apparent influx rate constant), k 2 (efflux rateconstant), k 3 (phosphorylation rate constant), <strong>and</strong> k 4 (rate constant <strong>of</strong>dephosphorylation). The hybrid 18 F-FDG uptake constant (K FDG )<strong>and</strong> cerebral glucose metabolic rate (CMR glc ) were calculated asshown in Equations 2 <strong>and</strong> 3, respectively:K FDG 5 K 1 · k 3k 2 1 k 3Eq. 2CMR glc 5 K FDG · C p; Eq. 3LCwhere C p denotes the glucose concentration in plasma <strong>and</strong> LC thelumped constant. The lumped constant was set to 0.6 to allow fordirect comparison <strong>of</strong> our results with those <strong>of</strong> Yu et al. (16). ForFIGURE 3. Source images correspondingto independent components used to generateIDIF: tissue component (left), bloodcomponent (middle), <strong>and</strong> original PET image(right). Image borders correspond to boundaries<strong>of</strong> heart volume <strong>of</strong> interest in respectivedimensions. Color axis is in arbitraryunits (EL-ICA is not scale-invariant).134 THE JOURNAL OF NUCLEAR MEDICINE • Vol. 54 • No. 1 • January 2013
comparison, CMR glc was estimated from Patlak plots includingthe data from 15 to 45 min after injection for linear regression.Statistical AnalysisTo compare the 2 methods, that is, 18 F-FDG kinetic modelingwith the shunt IF <strong>and</strong> the IDIF, correlations were calculated forestimates <strong>of</strong> K FDG <strong>and</strong> CMR glc , respectively, each estimated witheither IF type. Bl<strong>and</strong>–Altman plots (20) were generated to furthervisualize the comparison. Correlations <strong>of</strong> the single rate constantsK 1 –k 4 as estimated with either IF type were calculated. The SDs <strong>of</strong>the fit <strong>of</strong> individual rate constants with either counter IF or IDIFwere compared with F tests, <strong>and</strong> the results were corrected formultiple comparisons with the Bonferroni adjustment. Fit parameters<strong>of</strong> the 2 mouse strains were compared with 2-tailed homoscedastict tests. Data are presented as mean 6 SD.RESULTSPlasma glucose levels ranged from normal to high glycemicvalues in C57BL/6 mice (11.8 6 4.1 mmol/L; range,6.7–16.9 mmol/L; n 5 5), whereas CD1 mice showed a widerrange (8.5 6 5.4; range, 1.9–19.2 mmol/L; n 5 10). Excluding2 CD1 mice with extreme values, plasma glucose levelsreached 5.4–13.0 mmol/L in the CD1 mice (n 5 8).IFsFor all animals, the source images corresponding to theestimated independent components separated the lumina <strong>of</strong>the ventricles, that is, the blood pool, from the myocardium,that is, the tissue compartment. Figure 3 shows an example<strong>of</strong> a representative set <strong>of</strong> images. IDIFs were generatedfrom the EL-ICA results as described above. Agreementwith the respective real-time shunt IF was good (Fig. 2);all R 2 obtained with linear correlation <strong>of</strong> the 2 IFs weregreater than 0.89, suggesting no major differences in shape.Differences were present mostly around the peak at theend <strong>of</strong> the infusion, when PET frame lengths were shortest.For comparison, residuals were normalized to injecteddose per gram <strong>of</strong> body weight. The mean <strong>of</strong> the residuals<strong>of</strong> all datasets was not significantly different from zero(0.0087 6 0.227, P . 0.38; Fig. 2B). The IFs are shownFIGURE 4. Kinetic model fits <strong>of</strong> CD1 mouse brain time–activitycurve with respective IFs. (A) Model fit applying shunt IF (R 2 50.999). (B) Model fit <strong>of</strong> same time–activity curve with correspondingIDIF (R 2 5 0.998). Insets show residual differences between modelfit <strong>and</strong> brain time–activity curve.with a logarithmic time scale in Supplemental Figure 3. Acomparison <strong>of</strong> the individual shunt IFs revealed large differences<strong>and</strong> a dependency <strong>of</strong> their shape on plasma glucoselevels, therefore prohibiting the use <strong>of</strong> a populationst<strong>and</strong>ard IF.Compartment Modeling <strong>of</strong> 18 F-FDG Uptake inthe BrainBrain (cerebrum) PET data were fitted with the 18 F-FDG2-tissue-compartment model with both IDIFs <strong>and</strong> shunt IFs(Fig. 4). A typical PET/CT image is shown in SupplementalFigure 1. Excellent fits were obtained in all animals withboth IFs (all R 2 . 0.99 for both mouse strains <strong>and</strong> types <strong>of</strong>IF). The 2 fits <strong>of</strong> a representative dataset are shown inFigure 4. Of the 10 CD1 mice, the 2 animals with thelowest <strong>and</strong> highest plasma glucose concentrations were excludedfrom the following statistical tests because the fitwith the IDIF did not converge to a solution with physiologicK 1 <strong>and</strong> k 2 .The mean value for the K FDG achieved with the shunt IFwas 0.035 6 0.013 mL/cm 3 /min <strong>and</strong> 61 6 11 mmol/min/100 g for CMR glc in C57BL/6 mice, which is higher thanthe 40.6 6 13.3 mmol/min/100 g in the cerebral cortexpublished previously by Yu et al. (16). The respective valuesin CD1 mice were higher (0.057 6 0.019 mL/cm 3 /min<strong>and</strong> 75 6 24 mmol/min/100 g, n 5 8), but the differencesbetween strains were not statistically significant (P . 0.05<strong>and</strong> P . 0.25). Table 1 provides an overview <strong>of</strong> the rateconstants <strong>and</strong> metabolic rates. Good correlations wereobtained for K FDG <strong>and</strong> CMR glc , respectively, comparingtheir estimations with the IDIF <strong>and</strong> shunt IF (Fig. 5).Plotting K FDG values from the fits with shunt IF versusIDIF resulted in a slope <strong>of</strong> 0.932, indicating a tendencytoward estimating higher values when IDIFs are used(Fig. 5A). The slope was 0.902 for CMR glc (Fig. 5B).This discrepancy between the 2 methods is also reflectedby the Bl<strong>and</strong>–Altman plots in Figures 5C (K FDG ) <strong>and</strong> 5D(CMR glc ).Rate constants K 1 , k 2 , <strong>and</strong> k 3 were higher by trend for theIDIF. Correlations comparing the single process rate constantsapplying IDIF <strong>and</strong> shunt IF were moderate for K 1(K 1,shunt 5 0.31 · K 1,IDIF 1 0.17, R 2 5 0.47, <strong>and</strong> K 1,shunt 50.57 · K 1,IDIF 1 0.08, R 2 5 0.38, for CD1 <strong>and</strong> C57BL/6,respectively) <strong>and</strong> significant only for CD1 mice (P , 0.05),for which n was higher (8 vs. 5). No significant correlationwas found for k 2 in either strain. Correlations significantlydifferent from zero were found for k 3 (k 3,shunt 5 0.38 ·k 3,IDIF 1 0.08, R 2 5 0.65, <strong>and</strong> k 3,shunt 5 1.33 · k 3,IDIF 10.07, R 2 5 0.94, for the 2 strains) <strong>and</strong> k 4 (k 4,shunt 5 0.52 ·k 4,IDIF 1 0.02, R 2 5 0.65, <strong>and</strong> k 4,shunt 5 0.89 · k 4,IDIF 10.003, R 2 5 0.69, respectively), with P , 0.05 for CD1 butnot C57BL/6.Patlak AnalysisGraphical analysis yielded CMR glc values <strong>of</strong> 38 6 10<strong>and</strong> 39 6 17 mmol/min/100 g in C57BL/6 mice with theREAL-TIME INPUT FUNCTION IN MICE • Alf et al. 135
TABLE 1Average Rate Constants <strong>and</strong> Metabolic RatesStrain Method K 1 (mL/min/cm 3 ) k 2 (1/min) k 3 (1/min) k 4 (1/min) K FDG (mL/min/cm 3 )CMR glc(mmol/min/100 g)CD1 (n 5 8) Shunt 0.25 6 0.04 0.48 6 0.16 0.13 6 0.03 0.03 6 0.015 0.057 6 0.019 75 6 24IDIF 0.30 6 0.11 0.55 6 0.25 0.23 6 0.14 0.03 6 0.018 0.063 6 0.03 79 6 30C57BL/6 (n 5 5) Shunt 0.27 6 0.09 0.57 6 0.10 0.08 6 0.02 0.018 6 0.004 0.035 6 0.013 61 6 11IDIF 0.33 6 0.10 0.81 6 0.09 0.11 6 0.02 0.025 6 0.004 0.041 6 0.013 73 6 20Values are mean 6 SD.shunt IF <strong>and</strong> IDIF, respectively, <strong>and</strong> 43 6 20 vs. 42 6 18mmol/min/100 g in CD1 mice. These values were significantly(both P , 0.05) lower than those obtained by the2-tissue-compartment model for both strains. No significantdifferences were found between the fit precision obtainedwith either IF type.Influence <strong>of</strong> the Type <strong>of</strong> IF on the Goodness <strong>of</strong> FitTo evaluate the influence <strong>of</strong> the type <strong>of</strong> IF on thegoodness <strong>of</strong> fit <strong>of</strong> the 2-compartment model, the relativeSDs <strong>of</strong> the single fit parameters as revealed by PMOD withthe Levenberg–Marquardt algorithm were compared viaF tests (Table 2). The use <strong>of</strong> the shunt IF resulted in significantlymore precise (smaller SD) fits <strong>of</strong> K 1 <strong>and</strong> k 2 in allanimals, as well as <strong>of</strong> k 3 in most <strong>and</strong> k 4 in some animals.The alternative hypothesis (s 2 shunt IF . s 2 IDIF) had no significantresults for any rate constant in any dataset. TheFIGURE 5. Correlations <strong>and</strong> Bl<strong>and</strong>–Altmann plots for K FDG <strong>and</strong>CMR glc determined with shunt IF <strong>and</strong> IDIF. (A) K FDG <strong>and</strong> (B) CMR glcestimates achieved with either type <strong>of</strong> IF show almost perfect linearcorrelation. (C) <strong>and</strong> (D) Bl<strong>and</strong>–Altmann plots for K FDG <strong>and</strong> CMR glcindicating higher values when determined with IDIF <strong>and</strong> relativelylarge interval <strong>of</strong> 62 SDs, suggesting that at least 1 method is <strong>of</strong>mediocre reliability.model fit residuals (x2 ) were not markedly different forthe 2 methods. F tests, corrected for multiple comparisons,showed a significantly (P , 0.001) smaller fit SD for K FDG<strong>and</strong> CMR glc when the shunt IF was used in all C57BL/6mice <strong>and</strong> 5 <strong>of</strong> the 8 CD1 mice.DISCUSSIONIn this work, we demonstrated that the measurement <strong>of</strong>the input curve with a coincidence counter in mice is feasiblewith practically real-time resolution <strong>and</strong> no blood loss. Themeasurement <strong>of</strong> the blood time–radioactivity curve with theshunt/coincidence counter system resulted in a high precision<strong>of</strong> the kinetic model fit.The question arises as to the gold st<strong>and</strong>ard with which tocompare our measurements. In general, the gold st<strong>and</strong>ardwould be manual blood sampling. However, it is notpossible to obtain a time-resolved IF by manual samplingin mice because <strong>of</strong> the small overall blood volume. Webelieve that the measurement in the shunt has no disadvantagescompared with manual sampling <strong>and</strong> provides a suitablealternative st<strong>and</strong>ard. This was demonstrated in rats,where manual sampling <strong>and</strong> shunt measurements yieldedpractically identical results (15). The shunt features additionalrelevant benefits such as minimal blood loss, real-time temporalinput curve resolution, <strong>and</strong> a practical means for infusion<strong>of</strong> tracer <strong>and</strong> pharmacologic agents. It provides high signallinearity <strong>and</strong> reliability <strong>and</strong> is independent <strong>of</strong> surroundingelectromagnetic fields, in contrast to b-probe systems (6,21),which constitute the only alternative approach currently availablewith a similar temporal resolution yielding full inputcurves. The b-probe approach depends heavily on the positioning<strong>of</strong> the detector <strong>and</strong> suffers from a lower sensitivity.The model values obtained using the IDIF are higher bya 7% <strong>and</strong> 10% mean difference for K FDG <strong>and</strong> CMR glc , respectively,with a relatively high variability in the me<strong>and</strong>ifferences, as seen in the Bl<strong>and</strong>–Altman plots. The nonsystematicdeviations could result from the differences inheight <strong>and</strong> temporal distribution <strong>of</strong> the residuals comparingthe 2 types <strong>of</strong> IF around the peak period. Another likelyexplanation is the lower temporal resolution <strong>of</strong> the IDIF <strong>and</strong>an associated overfitting. Despite these average differences,the estimations correlated strongly between the 2 methodsused. This is in line with previous publications reportingdecent agreement even for input curves with highly incon-136 THE JOURNAL OF NUCLEAR MEDICINE • Vol. 54 • No. 1 • January 2013
TABLE 2Fitting Precision with 2 Types <strong>of</strong> IFParameterK 1(mL/min/cm 3 ) SD (%) k 2 (1/min) SD (%) k 3 (1/min) SD (%) k 4 (1/min) SD (%)K FDG(mL/min/cm 3 ) SD (%)IDIF 1 0.296 10.383 0.766 17.056 0.125 11.805 0.024 13.232 0.041 5.837IDIF 2 0.269 6.967 0.907 10.766 0.101 9.582 0.029 11.626 0.027 5.749IDIF 3 0.238 7.291 0.731 12.545 0.107 12.106 0.023 17.610 0.031 6.845IDIF 4 0.468 6.746 0.920 10.273 0.101 8.988 0.019 17.181 0.046 5.454IDIF 5 0.402 5.726 0.736 9.<strong>455</strong> 0.131 6.717 0.027 6.876 0.061 3.297Shunt 1 0.294 1.450 0.653 2.013 0.105 3.497 0.022 7.980 0.041 2.449Shunt 2 0.162 1.245 0.430 1.937 0.064 4.854 0.020 11.587 0.021 3.311Shunt 3 0.226 1.016 0.614 1.405 0.080 3.515 0.017 9.384 0.026 2.515Shunt 4 0.284 0.573 0.482 0.799 0.067 1.838 0.012 8.476 0.035 1.379Shunt 5 0.407 1.072 0.656 0.945 0.102 2.397 0.022 4.354 0.055 1.331s 2 IDIF . s 2 shunt df F F F F FMouse 1 26/26 52.041* 98.696* 16.142* 3.517 5.918*Mouse 2 29/29 86.185* 137.309* 9.716* 2.136 4.975*Mouse 3 27/27 57.444* 112.981* 21.159* 6.656* 10.104*Mouse 4 29/29 377.026* 603.740* 53.824* 9.845* 27.648*Mouse 5 30/30 27.875* 125.813* 12.774* 3.767 7.475*Original data from C57BL/6 mice used in this study. F tests revealed significantly (*P , 0.01, corrected for multiple comparisons, with dfdepending on number <strong>of</strong> image frames in respective PET dataset) larger variances in fitted parameters using IDIF than using shunt IF.Pattern was similar in CD1 mice, for which K 1 <strong>and</strong> k 2 could be estimated with significantly (P , 0.01) higher precision in all animals, <strong>and</strong> k 3 ,k 4 , <strong>and</strong> K FDG in 6, 3, <strong>and</strong> 4 <strong>of</strong> 8 animals, respectively.gruous shapes (e.g., 16,22). IDIFs are, therefore, a valid alternativefor the estimation <strong>of</strong> CMR glc , in particular in caseswhere a shunt surgery is not possible, for example, in longitudinalstudies.In general, 2-tissue-compartment modeling <strong>of</strong> K FDG <strong>and</strong>CMR glc based on the shunt IF yielded smaller SDs, mostprobably because <strong>of</strong> the higher sampling rate <strong>and</strong> greaterprecision in the rate constants achieved with the shunt <strong>and</strong>counter. This interpretation is supported by the lack <strong>of</strong> differencein the CMR glc estimated with either IF type byPatlak analysis, which is less sensitive to the shape <strong>of</strong> the IFthan the 2-tissue-compartment model.Several methods exist to compute IDIFs. The EL-ICAalgorithm was chosen because it uses a high amount <strong>of</strong> informationpresent in the image data <strong>and</strong> features a nonnegativityconstraint that prevents physically meaninglessresults <strong>and</strong> makes the method more robust (13). The use <strong>of</strong>EL-ICA allowed us to filter out spillover <strong>of</strong> the myocardium<strong>and</strong> partial-volume effects. We further optimized thedata quality by applying a relatively slow infusion protocolfor 18 F-FDG to avoid the unphysiologic mixing conditionsin the blood <strong>and</strong> the corresponding overshoot in plasma radioactivitythat occur after bolus injection. Furthermore, weincluded the fractional cerebral blood volume into the kineticmodel, a correction that was not done by Yu et al.(16). The combination <strong>of</strong> the above precautions resulted inmodel fits with high R 2 values <strong>and</strong> meaningful estimates <strong>of</strong>the single rate constants.With both IF methods, we found a significant contribution<strong>of</strong> 18 F-FDG-6-phosphate dephosphorylation to the kinetics.This contribution was indicated by k 4 , which is notnegligible in the fits, in good agreement with the observationsby Yu et al. (16). For this reason, we did not furtherdevelop the results obtained by Patlak analysis since itassumes irreversible phosphorylation. Dephosphorylation,which is considered by k 4 in the 2-tissue-compartmentmodel, results in an underestimation <strong>of</strong> CMR glc in the Patlakanalysis, as observed in our study <strong>and</strong> that by Yu et al. (16).The results <strong>of</strong> our Patlak analysis were higher (P , 0.05) bya factor <strong>of</strong> about 2 than those <strong>of</strong> Wong et al. (23). Possibleinfluencing factors that may have differed between the 2 studiesinclude the duration <strong>of</strong> anesthesia, which in our study includedthe time for the surgery; the depth <strong>of</strong> anesthesia; <strong>and</strong>the oxygen content <strong>of</strong> the inhaled gas mix. Is<strong>of</strong>lurane anesthesiaincreases plasma glucose <strong>and</strong> with it CMR glc ,asdemonstratedbySahaetal.(24).The authors showed an increase inblood glucose levels in nonfasted rats during an experimentalperiod <strong>of</strong> 180 min <strong>of</strong> is<strong>of</strong>lurane anesthesia (2.5%). The increasewas highest within the first 60 min. In our experiments,the PET scan started 45–60 min after the induction <strong>of</strong> anesthesia,<strong>and</strong> is<strong>of</strong>lurane doses were lower (;2%). We thereforeassume that the plasma glucose concentrations measured afterthe scan are representative <strong>of</strong> the complete scan duration inour study. Finally, this may explain why our values are higherthan those reported by Yu et al. (16), who measured plasmaglucose before the scan. Intersubject variability in plasma glucoseconcentration <strong>and</strong> hence the shape <strong>of</strong> the IF may hamperthe use <strong>of</strong> population-based st<strong>and</strong>ard IFs in mice, for which itis currently impossible to reliably clamp plasma glucose toa st<strong>and</strong>ard normoglycemic value.A drawback <strong>of</strong> our IDIF <strong>and</strong> most other image-derivedmethods previously proposed is the need for scaling with bloodREAL-TIME INPUT FUNCTION IN MICE • Alf et al. 137
samples. In our case, because <strong>of</strong> the Bayesian nature <strong>of</strong> theIDIF-generating algorithm, at least 2 samples were required forcorrect scaling. Furthermore, to achieve an accurate scaling,the 2 samples have to be temporally separated by at leastseveral minutes <strong>and</strong> ideally have a significantly different activityconcentration. Also, at least at time points before steadystate is reached, arterial samples are clearly preferable.No positive correlation was found between the efflux rateconstants k 2 based on the IDIF <strong>and</strong> the shunt IF model fits.This is not surprising considering the high relative SD <strong>of</strong> k 2in the fits with the IDIFs. Compared with the shunt IF, theIDIF is poorly defined around its maximum where plasma18F-FDG concentration changes most. Although the shuntmethod allows for sufficient temporal resolution in this region,the IDIF suffers from a compromise between duration<strong>of</strong> time frames <strong>and</strong> counting precision. The efflux rate constantk 2 affects the early time points <strong>of</strong> the tissue time–activity curve <strong>and</strong> is, therefore, more sensitive to this earlypart <strong>of</strong> the IF while k 3 <strong>and</strong> k 4 are more dependent on latertime points. This emphasizes the necessity for IFs withadequate time resolution <strong>and</strong> accurate counting precisionfor the determination <strong>of</strong> the single process rate constants.Both conditions are met with the shunt method.CONCLUSIONWe showed that the IF can be measured with high temporalresolution in mice using a femoral arteriovenous shunt.The single process rate constants K 1 –k 4 can be determinedwith higher precision with the shunt/counter IF than withthe IDIF. The shunt method represents a step forward towardmore conclusive, quantitative analysis <strong>of</strong> PET studies inmouse models <strong>of</strong>, for example, glucose transporter deficiencyor mutant <strong>and</strong> knock-out variants <strong>of</strong> other proteinsrelevant for energy metabolism. It also opens new avenuesfor investigations <strong>of</strong> disease models <strong>of</strong> diabetes <strong>and</strong> possiblyischemic stroke. Quantification <strong>of</strong> 18 F-FDG kinetics inmouse brain PET using an IDIF leads to a less preciseestimation <strong>of</strong> individual parameters <strong>and</strong>, therefore, valuesfor glucose consumption than the shunt method. However,keeping its limitations in mind, the use <strong>of</strong> an IDIF-basedmethod on EL-ICA represents an appropriate alternative forlongitudinal or high-throughput studies, when the invasivemeasurement <strong>of</strong> blood activity is not feasible.DISCLOSUREThe costs <strong>of</strong> publication <strong>of</strong> this article were defrayed inpart by the payment <strong>of</strong> page charges. Therefore, <strong>and</strong> solelyto indicate this fact, this article is hereby marked “advertisement”in accordance with 18 USC section 1734. This workwas supported in part by the Swiss National CompetenceCenter for Biomedical Imaging (NCCBI) <strong>and</strong> by the SwissNational Foundation (PP00B-110751/1 <strong>and</strong> 31003A-124739/1). Two <strong>of</strong> the authors developed the blood sampling systemused in this work <strong>and</strong> are c<strong>of</strong>ounders <strong>of</strong> Swisstrace GmbH.No other potential conflict <strong>of</strong> interest relevant to this articlewas reported.ACKNOWLEDGMENTSWe are grateful to Dr. Mika Naganawa, who kindlyprovided MATLAB-code for this study. We thank ClaudiaKeller <strong>and</strong> Petra Wirth for technical assistance <strong>and</strong> StefanWeber for the graphics rendering <strong>of</strong> the shunt setup.REFERENCES1. Bailey DL, Townsend DW, Valk PE, Maisey MN, eds. Positron EmissionTomography: Basic Sciences. London, U.K.: Springer; 2005:1–2.2. Sokol<strong>of</strong>f L, Reivich M, Kennedy C, et al. The [ 14 C]deoxyglucose method for themeasurement <strong>of</strong> local cerebral glucose utilization: theory, procedure, <strong>and</strong> normalvalues in the conscious <strong>and</strong> anesthetized albino rat. J Neurochem. 1977;28:897–916.3. Zanotti-Fregonara P, Chen K, Liow JS, Fujita M, Innis RB. Image-derived inputfunction for brain PET studies: many challenges <strong>and</strong> few opportunities. J CerebBlood Flow Metab. 2011;31:1986–1998.4. Wu HM, Sui G, Lee CC, et al. In vivo quantitation <strong>of</strong> glucose metabolism in miceusing small-animal PET <strong>and</strong> a micr<strong>of</strong>luidic device. JNuclMed.2007;48:837–845.5. Laforest R, Sharp TL, Engelbach JA, et al. Measurement <strong>of</strong> input functions inrodents: challenges <strong>and</strong> solutions. Nucl Med Biol. 2005;32:679–685.6. Convert L, Morin-Brassard G, Cadorette J, Archambault M, Bentourkia M,Lecomte R. A new tool for molecular imaging: the microvolumetric beta bloodcounter. J Nucl Med. 2007;48:1197–1206.7. Wu HM, Hoh CK, Choi Y, et al. Factor analysis for extraction <strong>of</strong> blood timeactivitycurves in dynamic FDG-PET studies. J Nucl Med. 1995;36:1714–1722.8. Kudomi N, Bucci M, Oikonen V, et al. Extraction <strong>of</strong> input function from rat [ 18 F]FDG PET images. Mol Imaging Biol. 2011;13:1241–1249.9. Fu Z, Tantawy MN, Peterson TE. Ensemble learning (EL) independent componentanalysis (ICA) approach to derive blood input function from FDG-PET images insmall animal. IEEE Nucl Sci Symposium Conf Record. 2006;5:2708–2712.10. Shoghi KI, Welch MJ. Hybrid image <strong>and</strong> blood sampling input function for quantification<strong>of</strong> small animal dynamic PET data. Nucl Med Biol. 2007;34:989–994.11. TantawyMN,PetersonTE.Simplified[ 18 F]FDG image-derived input function usingthe left ventricle, liver, <strong>and</strong> one venous blood sample. Mol Imaging. 2010;9:76–86.12. Locke LW, Berr SS, Kundu BK. Image-derived input function from cardiac gatedmaximum a posteriori reconstructed PET images in mice. Mol Imaging Biol.2011;13:342–347.13. Naganawa M, Kimura Y, Ishii K, Oda K, Ishiwata K. Temporal <strong>and</strong> spatial bloodinformation estimation using Bayesian ICA in dynamic cerebral positron emissiontomography. Digit Signal Process. 2007;17:979–993.14. Lei H, Berthet C, Hirt L, Gruetter R. Evolution <strong>of</strong> the neurochemical pr<strong>of</strong>ile aftertransient focal cerebral ischemia in the mouse brain. J Cereb Blood Flow Metab.2009;29:811–819.15. Weber B, Burger C, Biro P, Buck A. A femoral arteriovenous shunt facilitatesarterial whole blood sampling in animals. Eur J Nucl Med Mol Imaging.2002;29:319–323.16. Yu AS, Lin HD, Huang SC, Phelps ME, Wu HM. Quantification <strong>of</strong> cerebralglucose metabolic rate in mice using 18 F-FDG <strong>and</strong> small-animal PET. J NuclMed. 2009;50:966–973.17. Kehl MI. Refinement <strong>and</strong> St<strong>and</strong>ardization <strong>of</strong> Small Animal PET ScanningExperimentation <strong>and</strong> Data Analysis [dissertation]. Zurich, Switzerl<strong>and</strong>: ETH(Eidgenössische Technische Hochschule/Swiss Federal <strong>Institute</strong> <strong>of</strong> Technology); 2010.18. Miskin JW. Ensemble Learning for Independent Component Analysis [dissertation].Cambridge, U.K.: University <strong>of</strong> Cambridge; 2000.19. Chugh BP, Lerch JP, Yu LX, et al. Measurement <strong>of</strong> cerebral blood volume inmouse brain regions using micro-computed tomography. Neuroimage. 2009;47:1312–1318.20. Bl<strong>and</strong> JM, Altman DG. Statistical methods for assessing agreement between twomethods <strong>of</strong> clinical measurement. Lancet. 1986;1:307–310.21. Pain F, Lanièce P, Mastrippolito R, Gervais P, Hantraye P, Besret L. Arterialinput function measurement without blood sampling using a beta-microprobe inrats. J Nucl Med. 2004;45:1577–1582.22. Green LA, Gambhir SS, Srinivasan A, et al. Noninvasive methods for quantitatingblood time-activity curves from mouse PET images obtained with fluorine-18-fluorodeoxyglucose. J Nucl Med. 1998;39:729–734.23. Wong KP, Sha W, Zhang X, Huang SC. Effects <strong>of</strong> administration route, dietarycondition, <strong>and</strong> blood glucose level on kinetics <strong>and</strong> uptake <strong>of</strong> 18 F-FDG in mice.J Nucl Med. 2011;52:800–807.24. Saha JK, Xia J, Grondin JM, Engle SK, Jakubowski JA. Acute hyperglycemiainduced by ketamine/xylazine anesthesia in rats: mechanisms <strong>and</strong> implicationsfor preclinical models. Exp Biol Med (Maywood). 2005;230:777–784.138 THE JOURNAL OF NUCLEAR MEDICINE • Vol. 54 • No. 1 • January 2013