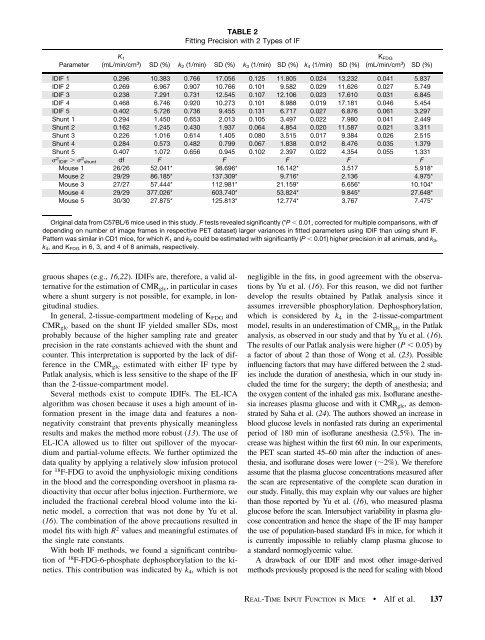
TABLE 2Fitting Precision with 2 Types <strong>of</strong> IFParameterK 1(mL/min/cm 3 ) SD (%) k 2 (1/min) SD (%) k 3 (1/min) SD (%) k 4 (1/min) SD (%)K FDG(mL/min/cm 3 ) SD (%)IDIF 1 0.296 10.383 0.766 17.056 0.125 11.805 0.024 13.232 0.041 5.837IDIF 2 0.269 6.967 0.907 10.766 0.101 9.582 0.029 11.626 0.027 5.749IDIF 3 0.238 7.291 0.731 12.545 0.107 12.106 0.023 17.610 0.031 6.845IDIF 4 0.468 6.746 0.920 10.273 0.101 8.988 0.019 17.181 0.046 5.454IDIF 5 0.402 5.726 0.736 9.<strong>455</strong> 0.131 6.717 0.027 6.876 0.061 3.297Shunt 1 0.294 1.450 0.653 2.013 0.105 3.497 0.022 7.980 0.041 2.449Shunt 2 0.162 1.245 0.430 1.937 0.064 4.854 0.020 11.587 0.021 3.311Shunt 3 0.226 1.016 0.614 1.405 0.080 3.515 0.017 9.384 0.026 2.515Shunt 4 0.284 0.573 0.482 0.799 0.067 1.838 0.012 8.476 0.035 1.379Shunt 5 0.407 1.072 0.656 0.945 0.102 2.397 0.022 4.354 0.055 1.331s 2 IDIF . s 2 shunt df F F F F FMouse 1 26/26 52.041* 98.696* 16.142* 3.517 5.918*Mouse 2 29/29 86.185* 137.309* 9.716* 2.136 4.975*Mouse 3 27/27 57.444* 112.981* 21.159* 6.656* 10.104*Mouse 4 29/29 377.026* 603.740* 53.824* 9.845* 27.648*Mouse 5 30/30 27.875* 125.813* 12.774* 3.767 7.475*Original data from C57BL/6 mice used in this study. F tests revealed significantly (*P , 0.01, corrected for multiple comparisons, with dfdepending on number <strong>of</strong> image frames in respective PET dataset) larger variances in fitted parameters using IDIF than using shunt IF.Pattern was similar in CD1 mice, for which K 1 <strong>and</strong> k 2 could be estimated with significantly (P , 0.01) higher precision in all animals, <strong>and</strong> k 3 ,k 4 , <strong>and</strong> K FDG in 6, 3, <strong>and</strong> 4 <strong>of</strong> 8 animals, respectively.gruous shapes (e.g., 16,22). IDIFs are, therefore, a valid alternativefor the estimation <strong>of</strong> CMR glc , in particular in caseswhere a shunt surgery is not possible, for example, in longitudinalstudies.In general, 2-tissue-compartment modeling <strong>of</strong> K FDG <strong>and</strong>CMR glc based on the shunt IF yielded smaller SDs, mostprobably because <strong>of</strong> the higher sampling rate <strong>and</strong> greaterprecision in the rate constants achieved with the shunt <strong>and</strong>counter. This interpretation is supported by the lack <strong>of</strong> differencein the CMR glc estimated with either IF type byPatlak analysis, which is less sensitive to the shape <strong>of</strong> the IFthan the 2-tissue-compartment model.Several methods exist to compute IDIFs. The EL-ICAalgorithm was chosen because it uses a high amount <strong>of</strong> informationpresent in the image data <strong>and</strong> features a nonnegativityconstraint that prevents physically meaninglessresults <strong>and</strong> makes the method more robust (13). The use <strong>of</strong>EL-ICA allowed us to filter out spillover <strong>of</strong> the myocardium<strong>and</strong> partial-volume effects. We further optimized thedata quality by applying a relatively slow infusion protocolfor 18 F-FDG to avoid the unphysiologic mixing conditionsin the blood <strong>and</strong> the corresponding overshoot in plasma radioactivitythat occur after bolus injection. Furthermore, weincluded the fractional cerebral blood volume into the kineticmodel, a correction that was not done by Yu et al.(16). The combination <strong>of</strong> the above precautions resulted inmodel fits with high R 2 values <strong>and</strong> meaningful estimates <strong>of</strong>the single rate constants.With both IF methods, we found a significant contribution<strong>of</strong> 18 F-FDG-6-phosphate dephosphorylation to the kinetics.This contribution was indicated by k 4 , which is notnegligible in the fits, in good agreement with the observationsby Yu et al. (16). For this reason, we did not furtherdevelop the results obtained by Patlak analysis since itassumes irreversible phosphorylation. Dephosphorylation,which is considered by k 4 in the 2-tissue-compartmentmodel, results in an underestimation <strong>of</strong> CMR glc in the Patlakanalysis, as observed in our study <strong>and</strong> that by Yu et al. (16).The results <strong>of</strong> our Patlak analysis were higher (P , 0.05) bya factor <strong>of</strong> about 2 than those <strong>of</strong> Wong et al. (23). Possibleinfluencing factors that may have differed between the 2 studiesinclude the duration <strong>of</strong> anesthesia, which in our study includedthe time for the surgery; the depth <strong>of</strong> anesthesia; <strong>and</strong>the oxygen content <strong>of</strong> the inhaled gas mix. Is<strong>of</strong>lurane anesthesiaincreases plasma glucose <strong>and</strong> with it CMR glc ,asdemonstratedbySahaetal.(24).The authors showed an increase inblood glucose levels in nonfasted rats during an experimentalperiod <strong>of</strong> 180 min <strong>of</strong> is<strong>of</strong>lurane anesthesia (2.5%). The increasewas highest within the first 60 min. In our experiments,the PET scan started 45–60 min after the induction <strong>of</strong> anesthesia,<strong>and</strong> is<strong>of</strong>lurane doses were lower (;2%). We thereforeassume that the plasma glucose concentrations measured afterthe scan are representative <strong>of</strong> the complete scan duration inour study. Finally, this may explain why our values are higherthan those reported by Yu et al. (16), who measured plasmaglucose before the scan. Intersubject variability in plasma glucoseconcentration <strong>and</strong> hence the shape <strong>of</strong> the IF may hamperthe use <strong>of</strong> population-based st<strong>and</strong>ard IFs in mice, for which itis currently impossible to reliably clamp plasma glucose toa st<strong>and</strong>ard normoglycemic value.A drawback <strong>of</strong> our IDIF <strong>and</strong> most other image-derivedmethods previously proposed is the need for scaling with bloodREAL-TIME INPUT FUNCTION IN MICE • Alf et al. 137
samples. In our case, because <strong>of</strong> the Bayesian nature <strong>of</strong> theIDIF-generating algorithm, at least 2 samples were required forcorrect scaling. Furthermore, to achieve an accurate scaling,the 2 samples have to be temporally separated by at leastseveral minutes <strong>and</strong> ideally have a significantly different activityconcentration. Also, at least at time points before steadystate is reached, arterial samples are clearly preferable.No positive correlation was found between the efflux rateconstants k 2 based on the IDIF <strong>and</strong> the shunt IF model fits.This is not surprising considering the high relative SD <strong>of</strong> k 2in the fits with the IDIFs. Compared with the shunt IF, theIDIF is poorly defined around its maximum where plasma18F-FDG concentration changes most. Although the shuntmethod allows for sufficient temporal resolution in this region,the IDIF suffers from a compromise between duration<strong>of</strong> time frames <strong>and</strong> counting precision. The efflux rate constantk 2 affects the early time points <strong>of</strong> the tissue time–activity curve <strong>and</strong> is, therefore, more sensitive to this earlypart <strong>of</strong> the IF while k 3 <strong>and</strong> k 4 are more dependent on latertime points. This emphasizes the necessity for IFs withadequate time resolution <strong>and</strong> accurate counting precisionfor the determination <strong>of</strong> the single process rate constants.Both conditions are met with the shunt method.CONCLUSIONWe showed that the IF can be measured with high temporalresolution in mice using a femoral arteriovenous shunt.The single process rate constants K 1 –k 4 can be determinedwith higher precision with the shunt/counter IF than withthe IDIF. The shunt method represents a step forward towardmore conclusive, quantitative analysis <strong>of</strong> PET studies inmouse models <strong>of</strong>, for example, glucose transporter deficiencyor mutant <strong>and</strong> knock-out variants <strong>of</strong> other proteinsrelevant for energy metabolism. It also opens new avenuesfor investigations <strong>of</strong> disease models <strong>of</strong> diabetes <strong>and</strong> possiblyischemic stroke. Quantification <strong>of</strong> 18 F-FDG kinetics inmouse brain PET using an IDIF leads to a less preciseestimation <strong>of</strong> individual parameters <strong>and</strong>, therefore, valuesfor glucose consumption than the shunt method. However,keeping its limitations in mind, the use <strong>of</strong> an IDIF-basedmethod on EL-ICA represents an appropriate alternative forlongitudinal or high-throughput studies, when the invasivemeasurement <strong>of</strong> blood activity is not feasible.DISCLOSUREThe costs <strong>of</strong> publication <strong>of</strong> this article were defrayed inpart by the payment <strong>of</strong> page charges. Therefore, <strong>and</strong> solelyto indicate this fact, this article is hereby marked “advertisement”in accordance with 18 USC section 1734. This workwas supported in part by the Swiss National CompetenceCenter for Biomedical Imaging (NCCBI) <strong>and</strong> by the SwissNational Foundation (PP00B-110751/1 <strong>and</strong> 31003A-124739/1). Two <strong>of</strong> the authors developed the blood sampling systemused in this work <strong>and</strong> are c<strong>of</strong>ounders <strong>of</strong> Swisstrace GmbH.No other potential conflict <strong>of</strong> interest relevant to this articlewas reported.ACKNOWLEDGMENTSWe are grateful to Dr. Mika Naganawa, who kindlyprovided MATLAB-code for this study. We thank ClaudiaKeller <strong>and</strong> Petra Wirth for technical assistance <strong>and</strong> StefanWeber for the graphics rendering <strong>of</strong> the shunt setup.REFERENCES1. Bailey DL, Townsend DW, Valk PE, Maisey MN, eds. Positron EmissionTomography: Basic Sciences. London, U.K.: Springer; 2005:1–2.2. Sokol<strong>of</strong>f L, Reivich M, Kennedy C, et al. The [ 14 C]deoxyglucose method for themeasurement <strong>of</strong> local cerebral glucose utilization: theory, procedure, <strong>and</strong> normalvalues in the conscious <strong>and</strong> anesthetized albino rat. J Neurochem. 1977;28:897–916.3. Zanotti-Fregonara P, Chen K, Liow JS, Fujita M, Innis RB. Image-derived inputfunction for brain PET studies: many challenges <strong>and</strong> few opportunities. J CerebBlood Flow Metab. 2011;31:1986–1998.4. Wu HM, Sui G, Lee CC, et al. In vivo quantitation <strong>of</strong> glucose metabolism in miceusing small-animal PET <strong>and</strong> a micr<strong>of</strong>luidic device. JNuclMed.2007;48:837–845.5. Laforest R, Sharp TL, Engelbach JA, et al. Measurement <strong>of</strong> input functions inrodents: challenges <strong>and</strong> solutions. Nucl Med Biol. 2005;32:679–685.6. Convert L, Morin-Brassard G, Cadorette J, Archambault M, Bentourkia M,Lecomte R. A new tool for molecular imaging: the microvolumetric beta bloodcounter. J Nucl Med. 2007;48:1197–1206.7. Wu HM, Hoh CK, Choi Y, et al. Factor analysis for extraction <strong>of</strong> blood timeactivitycurves in dynamic FDG-PET studies. J Nucl Med. 1995;36:1714–1722.8. Kudomi N, Bucci M, Oikonen V, et al. Extraction <strong>of</strong> input function from rat [ 18 F]FDG PET images. Mol Imaging Biol. 2011;13:1241–1249.9. Fu Z, Tantawy MN, Peterson TE. Ensemble learning (EL) independent componentanalysis (ICA) approach to derive blood input function from FDG-PET images insmall animal. IEEE Nucl Sci Symposium Conf Record. 2006;5:2708–2712.10. Shoghi KI, Welch MJ. Hybrid image <strong>and</strong> blood sampling input function for quantification<strong>of</strong> small animal dynamic PET data. Nucl Med Biol. 2007;34:989–994.11. TantawyMN,PetersonTE.Simplified[ 18 F]FDG image-derived input function usingthe left ventricle, liver, <strong>and</strong> one venous blood sample. Mol Imaging. 2010;9:76–86.12. Locke LW, Berr SS, Kundu BK. Image-derived input function from cardiac gatedmaximum a posteriori reconstructed PET images in mice. Mol Imaging Biol.2011;13:342–347.13. Naganawa M, Kimura Y, Ishii K, Oda K, Ishiwata K. Temporal <strong>and</strong> spatial bloodinformation estimation using Bayesian ICA in dynamic cerebral positron emissiontomography. Digit Signal Process. 2007;17:979–993.14. Lei H, Berthet C, Hirt L, Gruetter R. Evolution <strong>of</strong> the neurochemical pr<strong>of</strong>ile aftertransient focal cerebral ischemia in the mouse brain. J Cereb Blood Flow Metab.2009;29:811–819.15. Weber B, Burger C, Biro P, Buck A. A femoral arteriovenous shunt facilitatesarterial whole blood sampling in animals. Eur J Nucl Med Mol Imaging.2002;29:319–323.16. Yu AS, Lin HD, Huang SC, Phelps ME, Wu HM. Quantification <strong>of</strong> cerebralglucose metabolic rate in mice using 18 F-FDG <strong>and</strong> small-animal PET. J NuclMed. 2009;50:966–973.17. Kehl MI. Refinement <strong>and</strong> St<strong>and</strong>ardization <strong>of</strong> Small Animal PET ScanningExperimentation <strong>and</strong> Data Analysis [dissertation]. Zurich, Switzerl<strong>and</strong>: ETH(Eidgenössische Technische Hochschule/Swiss Federal <strong>Institute</strong> <strong>of</strong> Technology); 2010.18. Miskin JW. Ensemble Learning for Independent Component Analysis [dissertation].Cambridge, U.K.: University <strong>of</strong> Cambridge; 2000.19. Chugh BP, Lerch JP, Yu LX, et al. Measurement <strong>of</strong> cerebral blood volume inmouse brain regions using micro-computed tomography. Neuroimage. 2009;47:1312–1318.20. Bl<strong>and</strong> JM, Altman DG. Statistical methods for assessing agreement between twomethods <strong>of</strong> clinical measurement. Lancet. 1986;1:307–310.21. Pain F, Lanièce P, Mastrippolito R, Gervais P, Hantraye P, Besret L. Arterialinput function measurement without blood sampling using a beta-microprobe inrats. J Nucl Med. 2004;45:1577–1582.22. Green LA, Gambhir SS, Srinivasan A, et al. Noninvasive methods for quantitatingblood time-activity curves from mouse PET images obtained with fluorine-18-fluorodeoxyglucose. J Nucl Med. 1998;39:729–734.23. Wong KP, Sha W, Zhang X, Huang SC. Effects <strong>of</strong> administration route, dietarycondition, <strong>and</strong> blood glucose level on kinetics <strong>and</strong> uptake <strong>of</strong> 18 F-FDG in mice.J Nucl Med. 2011;52:800–807.24. Saha JK, Xia J, Grondin JM, Engle SK, Jakubowski JA. Acute hyperglycemiainduced by ketamine/xylazine anesthesia in rats: mechanisms <strong>and</strong> implicationsfor preclinical models. Exp Biol Med (Maywood). 2005;230:777–784.138 THE JOURNAL OF NUCLEAR MEDICINE • Vol. 54 • No. 1 • January 2013