The geography of inequalities in Europe Philippe Martin ... - ENPC
The geography of inequalities in Europe Philippe Martin ... - ENPC
The geography of inequalities in Europe Philippe Martin ... - ENPC

Create successful ePaper yourself
Turn your PDF publications into a flip-book with our unique Google optimized e-Paper software.
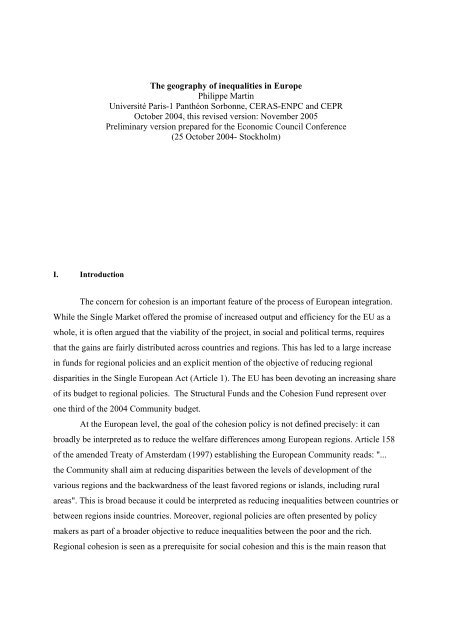
average the regional <strong>in</strong>equality <strong>in</strong> GDP per capita is more than double the <strong>in</strong>equality <strong>in</strong>disposable <strong>in</strong>come. More surpris<strong>in</strong>gly, even though the first measure <strong>in</strong>creased by more than 2percentage po<strong>in</strong>ts, the second measure actually decreased by the 2 percentage po<strong>in</strong>ts. As stressedby Davezies (2002) there is a grow<strong>in</strong>g disconnect between the <strong>geography</strong> <strong>of</strong> production(becom<strong>in</strong>g more unequal) and the <strong>geography</strong> <strong>of</strong> <strong>in</strong>comes (becom<strong>in</strong>g more equal) so that"regional convergence" is not a synonym <strong>of</strong> "regional cohesion". <strong>The</strong> reason for this is that <strong>in</strong>terregional<strong>in</strong>come transfers are important even though noth<strong>in</strong>g much is known about them. Inparticular, it is difficult to quantify the impact <strong>of</strong> public versus private transfers <strong>in</strong> the differencebetween GDP and <strong>in</strong>come at the regional level.0.085Figure 4: Coefficient <strong>of</strong> variation: French NUTS2 regionsDisposable <strong>in</strong>come per capita 1982-1999Source: Insee0.080.0750.070.0650.061980 1985 1990 1995 2000This French disconnect between the <strong>geography</strong> <strong>of</strong> production and the <strong>geography</strong> <strong>of</strong><strong>in</strong>come is not however a general phenomenon. Unfortunately, we do not have data for othercountries to draw general conclusions. <strong>The</strong>re is however evidence (see Monastiriotis, 2003)that <strong>in</strong> the UK both types <strong>of</strong> regional <strong><strong>in</strong>equalities</strong> (<strong>in</strong> terms <strong>of</strong> GDP per capita and <strong>in</strong> terms <strong>of</strong>disposable <strong>in</strong>come) have <strong>in</strong>creased <strong>in</strong> the past twenty years. This suggests that the evolution <strong>of</strong>the welfare state is key. Whereas <strong>in</strong> France, dur<strong>in</strong>g the past twenty years, transfers (due to theprogressivity <strong>of</strong> the <strong>in</strong>come tax, social security, unemployment benefits …) have <strong>in</strong>creased, thishas not been the case <strong>in</strong> the UK. <strong>The</strong> important po<strong>in</strong>t is that regional policies certa<strong>in</strong>ly do notexpla<strong>in</strong> much <strong>of</strong> the difference between UK and France. In France, national regional policies thatattempt to give <strong>in</strong>centives (through tax cuts essentially) for firms to locate <strong>in</strong> the poorest regions(the “politique d’aménagement du territoire”) are very active although it is difficult to evaluate
their real impact, <strong>in</strong> part because the government does not provide much data. In the UK, on theother hand, these policies are much less important. This suggests that <strong>in</strong>terregional transfers arevery large and grow<strong>in</strong>g <strong>in</strong> France. It also suggests that they are mostly due to progressive <strong>in</strong>cometaxes and the welfare state, not to spatially def<strong>in</strong>ed policies such as regional policies.III. A tentative explanation for global convergence and local divergence<strong>The</strong> presence <strong>of</strong> economies <strong>of</strong> scale and <strong>of</strong> trade costs may expla<strong>in</strong> why regions with noobvious comparative advantage <strong>in</strong> certa<strong>in</strong> activities can become centers <strong>of</strong> production <strong>of</strong> thoseactivities. A model <strong>of</strong> the underly<strong>in</strong>g mechanisms was <strong>in</strong>troduced by Krugman (1991), who wasat the orig<strong>in</strong> <strong>of</strong> the so-called “new economic <strong>geography</strong>” (see also the paper by Baldw<strong>in</strong>, 2006, <strong>in</strong>this issue). <strong>The</strong> central f<strong>in</strong>d<strong>in</strong>g <strong>of</strong> this literature is that the reduction <strong>of</strong> trade costs may engendera concentration <strong>of</strong> economic activities <strong>in</strong> certa<strong>in</strong> regions that have better access to the largemarkets even if they do not have the lowest production costs. This spatial concentration isadvantageous because <strong>of</strong> the existence <strong>of</strong> economies <strong>of</strong> scale conducive to limit<strong>in</strong>g productionlocations, and it is made possible by trade <strong>in</strong>tegration which, while reduc<strong>in</strong>g transaction costs,does not oblige enterprises to be located close to all their consumers.We simply here want to analyse very briefly what are some <strong>of</strong> the necessary conditionsfor a process <strong>of</strong> “local divergence” with “global convergence” to follow trade <strong>in</strong>tegration 1 . <strong>The</strong><strong>in</strong>teraction <strong>of</strong> economies <strong>of</strong> scale, comparative advantage and trade costs are essential. <strong>The</strong>purpose <strong>of</strong> the small “model” we provide here is simply to illustrate a mechanism which webelieve may be more general. Suppose there are three regions. <strong>The</strong> first one, which we call forillustrative purposes the Ruhr, is a rich and central region with high wages and hence high laborcosts. <strong>The</strong> second region, which we call Catalonia, is a middle-<strong>in</strong>come region close to the large<strong>Europe</strong>an markets. A third region, Andalusia, is a peripheral region with low wages and hencelow labor costs. Economies <strong>of</strong> scale play a major role <strong>in</strong> the sense that average production costs<strong>in</strong>crease with the number <strong>of</strong> locations due to fixed costs. Let us assume that the firm can produce1 Andres (2004), <strong>in</strong> the context <strong>of</strong> the footloose capital model, shows a similar result <strong>in</strong> a general equilibriumframework.
<strong>in</strong> the three regions, or <strong>in</strong> only one 2 . <strong>The</strong> choice <strong>of</strong> location is simply a m<strong>in</strong>imization <strong>of</strong> the sum<strong>of</strong> production and trade costs.If the firm decides to produce <strong>in</strong> the three regions, its total cost is:TC ( R + C + A)= 3F+ c S + c S + cRRCCwhere F is the fixed cost associated to each plant, c R,, c C, , c A are the marg<strong>in</strong>al costs <strong>of</strong> production(that can be <strong>in</strong>terpreted as the wage costs) respectively <strong>in</strong> the Ruhr, Catalonia and Andalusia. Weassume that c R, > c C, > c A . S R, , S C, , S A are the market sizes respectively <strong>in</strong> the Ruhr, Cataloniaand Andalusia. We assume that S R > S C > S A . Note that <strong>in</strong> this situation, the firm pays no tradeor transport costs as it produces <strong>in</strong> all three locations.If the firm produces <strong>in</strong> the Ruhr only, its total cost is:TC ( R)= F + c ( S + S + S ) + t ( S + S ) + tRRCAIwhere t I, is the <strong>in</strong>ternational trade cost which the firm located <strong>in</strong> Germany has to pay to sell <strong>in</strong>Catalunia and Andalusia. To sell <strong>in</strong> Andalusia, the firm also has to pay the domestic Spanishtrade cost (which can be <strong>in</strong>terpreted as a transport cost) as this region is <strong>in</strong> the periphery.If the firm produces <strong>in</strong> Catalunia only, its total cost is:TC ( C)= F + c ( S + S + S ) + t S + tCRCAIRso that it pays the <strong>in</strong>ternational trade cost to sell <strong>in</strong> Germany and the domestic Spanish cost tosell <strong>in</strong> Andalusia.F<strong>in</strong>ally, if the firm decides to produce <strong>in</strong> Andalusia, its total cost is:ARCACASDAASADS( tI+ tD) SRtDSCTC ( A)= F + c ( S + S + S ) ++Suppose we start from a situation where <strong>in</strong>ternational trade costs t I, are very high. In thissituation, which we <strong>in</strong>terpret as the pattern before the <strong>Europe</strong>an <strong>in</strong>tegration process, the firm willwant to locate some activity <strong>in</strong> the three locations. It is easy to check and it is <strong>in</strong>tuitive <strong>in</strong>deedthat if t I, is high enough (and domestic transport costs are not too low either) then:TC ( R + C + A)< TC ( R),TC ( C), TC ( A)or any other location equilibrium. This just says that iftrade costs are high, firms will want to be close to all their consumers.Suppose now that Spa<strong>in</strong> and Germany lower their trade costs t I, . In a highly stylized way,we <strong>in</strong>terpret the scenario <strong>of</strong> “global convergence with local divergence” as a case when the firmA2 Of course, the firm could produce <strong>in</strong> two regions. This possibility would complicate the presentation withoutadd<strong>in</strong>g much.
chooses to locate <strong>in</strong> Catalonia only. In this case, Spa<strong>in</strong> as a whole ga<strong>in</strong>s some economic activitybut Andalusia looses it.This will be the case under the follow<strong>in</strong>g conditions:1)TC ( R + C + A)> TC ( C); 2) TC ( R)> TC ( C);3)TC ( A)> TC ( C)It can be checked that condition 1) is fulfilled when fixed costs are sufficiently high,<strong>in</strong>ternational and domestic trade costs are sufficiently low, the <strong>in</strong>ternational cost advantage <strong>of</strong>Spa<strong>in</strong> over Germany is sufficiently high but the cost disadvantage <strong>of</strong> Catalonia is relatively smallcompared to Andalusia. Condition 2) applies for some <strong>of</strong> the same characteristics <strong>of</strong> 1) but alsorequires that the overall Spanish market is not too small compared to the German market.F<strong>in</strong>ally, condition 3) requires on top <strong>of</strong> some the characteristics above that the domestic cost <strong>in</strong>Spa<strong>in</strong> is not too small.Figure 5 below shows an example <strong>of</strong> some possible outcomes <strong>of</strong> locations depend<strong>in</strong>g oncomb<strong>in</strong>ations <strong>of</strong> <strong>in</strong>ternational trade costs t I, and national cost differences between the twoSpanish regions, c C, - c A . It illustrates that the scenario <strong>of</strong> global convergence and localdivergence (go<strong>in</strong>g from location pattern R+C+A to the location <strong>in</strong> C only) is possible when<strong>in</strong>ternational trade costs are lowered but the difference <strong>in</strong> production costs between C and A islow enough.tIIIFigure 5 : <strong>The</strong> possibility <strong>of</strong> global convergence and localdivergence follow<strong>in</strong>g <strong>Europe</strong>an trade <strong>in</strong>tegrationR+C+ALower <strong>in</strong>ternational tradecostsCRAc C - c A
Overall, this example suggests that <strong>in</strong>ternational <strong>in</strong>tegration (lower t I, ) can lead to globalconvergence and local divergence, if the <strong>in</strong>ternational cost advantage <strong>of</strong> the poorer country islarger than the national cost advantage <strong>of</strong> the poorer region. One can th<strong>in</strong>k that the <strong>Europe</strong>anpractice <strong>of</strong> nationally uniform m<strong>in</strong>imum wages (and more generally <strong>of</strong> labor <strong>in</strong>stitutions) coupledwith different labor costs between countries can produce exactly such a situation. <strong>The</strong> examplealso suggests that such a scenario will occur <strong>in</strong> countries for which the richest region has both alarge domestic market and good market access to other rich regions. In this case, market access isthe ma<strong>in</strong> driv<strong>in</strong>g force <strong>of</strong> location between regions <strong>in</strong>side countries and cost <strong>of</strong> productiondifferences are the ma<strong>in</strong> driv<strong>in</strong>g force <strong>of</strong> location between countries.Lower domestic transport costs <strong>in</strong> Spa<strong>in</strong>, due for example to <strong>in</strong>frastructure projectsf<strong>in</strong>anced by Structural Funds, may not produce local convergence. This has been shown forexample <strong>in</strong> Mart<strong>in</strong> and Rogers (1995). In this example, it can be checked that when domestictrade costs are high, the firm prefers to locate production <strong>in</strong> both Spanish regions, <strong>in</strong> order toserve the poor region market. At <strong>in</strong>termediate levels, the firm will prefer to concentrate itsproduction <strong>in</strong> the richest <strong>of</strong> the two and save on transport costs. At low levels <strong>of</strong> transport cost,the difference <strong>in</strong> production costs becomes the most important factor determ<strong>in</strong><strong>in</strong>g the firm’schoice <strong>of</strong> location, which presumably favors the poorest region. Note however that if, aga<strong>in</strong> for<strong>in</strong>stitutional reasons, production costs differences between regions <strong>in</strong>side countries areconstra<strong>in</strong>ed to be small, then regional policies that build transport <strong>in</strong>frastructures between richand poor regions will only emphasize the market size differences between those regions.Overall, this analytical framework suggests quite <strong>in</strong>tuitively that the <strong>in</strong>teraction <strong>of</strong>economies <strong>of</strong> scale and trade costs may produce a scenario <strong>of</strong> global convergence with localdivergence follow<strong>in</strong>g trade <strong>in</strong>tegration if poor countries - but not, or to a lesser extent, poorregions - can take advantage <strong>of</strong> their “natural” comparative advantage. Note also that this samemechanism that leads to the global convergence/local divergence phenomenon can also expla<strong>in</strong>why regional policies emphasiz<strong>in</strong>g transport <strong>in</strong>frastructure may not be successful <strong>in</strong> decreas<strong>in</strong>g<strong><strong>in</strong>equalities</strong> between poor and rich regions (see Mart<strong>in</strong> 2003 for a review <strong>of</strong> the evidence on theeffects <strong>of</strong> regional policies <strong>in</strong> <strong>Europe</strong>).
IV. Regional policies and the possibility <strong>of</strong> a trade<strong>of</strong>f between equity and efficiencyA motivation for public <strong>in</strong>tervention at the regional level, put forward by theCommission, is that <strong>of</strong> efficiency. It sees <strong>in</strong> geographic disequilibria “an underutilization <strong>of</strong>economic and social potentials and an <strong>in</strong>ability to take advantage <strong>of</strong> opportunities that could bebeneficial to the Union as a whole”.This motivation is much less clear than the equity based motivation, on which we willcome back. If the phenomenon <strong>of</strong> spatial concentration is expla<strong>in</strong>ed by the existence <strong>of</strong>economies <strong>of</strong> scale, this means that the spatial agglomeration is at the orig<strong>in</strong> <strong>of</strong> economic ga<strong>in</strong>s.This will be the case if firms can benefit from the proximity <strong>of</strong> other enterprises <strong>in</strong> the samesector to dim<strong>in</strong>ish their costs (transport costs or fixed costs). This will also be the case if suchconcentration makes it possible to <strong>in</strong>crease the firms’ productivity through localised spillovereffects, i.e. if the firms can receive transfers <strong>of</strong> knowledge from other neighbour<strong>in</strong>g bus<strong>in</strong>esses.<strong>The</strong>se localised spillovers have been documented <strong>in</strong> numerous studies (see, for example, Jaffe etal. 1993) and the existence <strong>of</strong> agglomeration ga<strong>in</strong>s has been extensively discussed by economistss<strong>in</strong>ce Marshall described them <strong>in</strong> 1890. <strong>The</strong> example <strong>of</strong> Silicon Valley shows the advantage acountry can obta<strong>in</strong> from a very heavy spatial concentration <strong>of</strong> activities with positivetechnological externalities. <strong>The</strong> stronger spatial concentration <strong>of</strong> <strong>in</strong>novation-based activities <strong>in</strong>relation to production activities thus has an economic rationale, and the benefits <strong>of</strong> this spatialconcentration go beyond private ga<strong>in</strong>s. Another ga<strong>in</strong> from agglomeration, both for workers andfor firms, is labour pool<strong>in</strong>g: firms benefit from a large spatial concentration <strong>of</strong> specialisedworkers <strong>in</strong> an area because they can easily hire from this large pool.<strong>The</strong> objective <strong>of</strong> policies promot<strong>in</strong>g a greater dispersal <strong>of</strong> economic activities is based onthe assumption that the economic <strong>geography</strong> produced by market forces alone is tooconcentrated. However, the efficiency argument may demand more or less spatial concentration:on the one hand the economic ga<strong>in</strong>s <strong>of</strong> spatial agglomeration discussed above, and on the otherthe effects <strong>of</strong> congestion (as for example reflected <strong>in</strong> pollution or the high price <strong>of</strong> fixed factorssuch as land). <strong>The</strong> fact that <strong>in</strong> <strong>Europe</strong> the convergence <strong>of</strong> countries is accompanied by nationaldivergence makes one th<strong>in</strong>k that the former type <strong>of</strong> argument, efficiency ga<strong>in</strong>s with spatialconcentration, has pride <strong>of</strong> place. In this case, a trade<strong>of</strong>f between equity and spatial efficiency
appears (see Mart<strong>in</strong> 1999a, b and Baldw<strong>in</strong> et al. 2003). It is difficult to quantitatively assess thistrade<strong>of</strong>f. Figure 6 shows the relation between the levels <strong>of</strong> regional disparities and GDP percapita <strong>in</strong> the larger EU15 countries. Denmark, Ireland and Luxemburg are excluded because <strong>of</strong>lack <strong>of</strong> regional data for those small countries. Two groups appear clearly. <strong>The</strong> three poorestcountries (Greece, Portugal and Spa<strong>in</strong>) have the lowest level <strong>of</strong> regional disparities. <strong>The</strong> secondgroup <strong>of</strong> countries, the relatively rich, have an average level <strong>of</strong> regional disparities which isclearly above the first group. However, <strong>in</strong>side this group no obvious relation appears. <strong>The</strong>positive relation between the overall country growth <strong>of</strong> GDP and the growth <strong>of</strong> regionaldisparities dur<strong>in</strong>g the period 1994-2000 appears more clearly <strong>in</strong> figure 7 3 . Of course, this positivecorrelation should be taken with much caution. It is suggestive <strong>of</strong> the possible existence <strong>of</strong> atrade<strong>of</strong>f between spatial equity and growth but such correlation may not be causal.Other evidence is provided by Ciccone and Hall (1996) for the US and Ciccone (2002)for <strong>Europe</strong>. Both f<strong>in</strong>d that employement density has a positive effect on productivity levels.Recent econometric work by Crozet and Koenig Soubeyran (2005) gives a more precise picture<strong>of</strong> this trade<strong>of</strong>f <strong>in</strong> <strong>Europe</strong>. <strong>The</strong>y f<strong>in</strong>d a positive relation between the GDP per capita growth <strong>of</strong> aregion and the change <strong>in</strong> the level <strong>of</strong> <strong><strong>in</strong>equalities</strong> <strong>in</strong>side the region. <strong>The</strong> effect is alsoeconomically significant: a 10% <strong>in</strong>crease <strong>in</strong> the standard deviation <strong>in</strong>dex <strong>of</strong> GDP per capitawith<strong>in</strong> a NUTS1 region leads to a 1.6% <strong>in</strong>crease <strong>in</strong> regional GDP per capita.3 <strong>The</strong> relation is given <strong>in</strong> log because it does not appear to be l<strong>in</strong>ear.
Figure 6: GDP/head and regional disparities: 2000source: EurostatGDP/cap (EU=100)120110Neth.AustriaSweden Ger.100France UKF<strong>in</strong>landItalyBelgium908070GreeceSpa<strong>in</strong>Portugal605 15 25 35 45Disparities <strong>in</strong> GDP/head <strong>in</strong> PPS by region with<strong>in</strong> member statesFigure 7: Growth and regional disparities: 1995-2000source EurostatGDP growth rate (<strong>in</strong> log)1,61,41,210,80,60,4AustriaItalyGreeceFranceGer.Port.Spa<strong>in</strong>UKNeth.F<strong>in</strong>landBelgiumSweden0 0,5 1 1,5 2 2,5 3annual growth rate <strong>of</strong> disparities <strong>in</strong> GDP/head by region with<strong>in</strong>member stated (<strong>in</strong> log)<strong>The</strong> existence <strong>of</strong> such a trade<strong>of</strong>f has consequences for the def<strong>in</strong>ition and quantification <strong>of</strong>objectives <strong>of</strong> regional policies <strong>in</strong> particular for the case <strong>of</strong> the new entrants. It implies that astrategic choice has to be made between the objective <strong>of</strong> lower<strong>in</strong>g or stabilis<strong>in</strong>g the absolutedifferences <strong>in</strong> GDP per capita between regions <strong>in</strong>side countries and the objective <strong>of</strong> fast
convergence towards the rest <strong>of</strong> the EU. <strong>The</strong> decisions <strong>of</strong> which <strong>in</strong>frastructure projects to f<strong>in</strong>anceand where to locate them are obviously dependent on this strategic choice between external and<strong>in</strong>ternal convergence. In this matter, an <strong>in</strong>terest<strong>in</strong>g choice was made by Ireland which decided tobe def<strong>in</strong>ed as a s<strong>in</strong>gle NUTS II region rather than several small regions and therefore a highdegree <strong>of</strong> spatial <strong><strong>in</strong>equalities</strong>. As emphasized by Davezies (1999), it therefore took the risk <strong>of</strong>be<strong>in</strong>g more rapidly excluded from the benefit <strong>of</strong> the Structural Funds but it could choose todevelop projects <strong>in</strong> those regions which provided the highest national return.To sum up, spatial agglomeration <strong>of</strong> economic activities may (at least up to a certa<strong>in</strong>po<strong>in</strong>t where congestion effects may become too large) have positive efficiency effects and maybe a welcome consequence <strong>of</strong> trade <strong>in</strong>tegration. This implies a trade-<strong>of</strong>f for regional policiesbetween efficiency and equity.V. Inequalities between regions and <strong><strong>in</strong>equalities</strong> between <strong>in</strong>dividuals<strong>The</strong> equity motive beh<strong>in</strong>d regional policiesEquity is after efficiency the other traditional motivation <strong>of</strong> regional policies. Certa<strong>in</strong>economic agents, be they workers or consumers, are not mobile and are therefore condemned tolive <strong>in</strong> poor or decl<strong>in</strong><strong>in</strong>g regions from which the mobile factors (capital and highly skilledworkers) have departed. Because <strong>of</strong> the lower labour demand <strong>in</strong> such regions, real wages willadjust downward, or, if real wages do not adjust because <strong>of</strong> labour market rigidities,unemployment will <strong>in</strong>crease. In both cases, the welfare <strong>of</strong> the <strong>in</strong>habitants will deteriorate. Asconsumers, those agents will also see their welfare deteriorate s<strong>in</strong>ce certa<strong>in</strong> goods and serviceswill no longer be produced locally (the bus<strong>in</strong>esses have left for more wealthy regions). In certa<strong>in</strong>cases, <strong>in</strong> particular for certa<strong>in</strong> services, the transaction costs will become so high that they can nolonger be consumed by those agents. Thus the diversity <strong>of</strong> consumable goods and services <strong>in</strong> thepoor region will decl<strong>in</strong>e. Moreover, the most mobile agents are <strong>in</strong> general those with the highestlevel <strong>of</strong> human capital (education, experience etc.). Such agents, thanks to the possession <strong>of</strong>“positive externalities” <strong>in</strong> the form <strong>of</strong> localized social <strong>in</strong>teractions, have a positive impact on theproductivity and thus on the real wages <strong>of</strong> other workers. By leav<strong>in</strong>g a region <strong>in</strong> decl<strong>in</strong>e, themost productive workers thus also have a negative impact on the productivity <strong>of</strong> the rema<strong>in</strong><strong>in</strong>g
workers, i.e. those who are the most disadvantaged. <strong>The</strong>re is thus an absence <strong>of</strong> marketcoord<strong>in</strong>ation, given that when certa<strong>in</strong> agents decide on their location, they do not take <strong>in</strong>toaccount the effect <strong>of</strong> their choice on the other agents. From that standpo<strong>in</strong>t, the possibility <strong>of</strong> amarket failure, with the consequent <strong>in</strong>crease <strong>in</strong> <strong><strong>in</strong>equalities</strong> that is specific to the spatialdimension <strong>of</strong> the economy exists and may thus serve as motivation for public <strong>in</strong>tervention.<strong>The</strong>re are several ways to analyze the impact <strong>of</strong> the agglomeration phenomenon on theleast mobile agents. <strong>The</strong> first would be to refuse to see it as a problem <strong>of</strong> equity but to <strong>in</strong>terpretit as com<strong>in</strong>g from a specific market failure. In <strong>Europe</strong>, except <strong>in</strong> the UK, promot<strong>in</strong>g the spatialmobility <strong>of</strong> workers is not considered a solution to the problems <strong>of</strong> regional <strong>in</strong>equality. This islegitimate, but only partially, s<strong>in</strong>ce because <strong>of</strong> cultural and social obstacles, there will always bea substantial fr<strong>in</strong>ge <strong>of</strong> workers who will be harmed by geographic <strong><strong>in</strong>equalities</strong>. <strong>The</strong> vision <strong>of</strong>regions empty both <strong>of</strong> <strong>in</strong>habitants and <strong>of</strong> economic activities (such as the Dakotas <strong>in</strong> the UnitedStates) is unacceptable <strong>in</strong> <strong>Europe</strong>.Are spatial <strong><strong>in</strong>equalities</strong> <strong>in</strong> production correlated to social <strong><strong>in</strong>equalities</strong>?Policy makers <strong>of</strong>ten argue that a strong rational for decreas<strong>in</strong>g regional <strong><strong>in</strong>equalities</strong> is thatit is part <strong>of</strong> the wider objective to decrease <strong><strong>in</strong>equalities</strong> between <strong>in</strong>dividuals. Spatial cohesion ispart <strong>of</strong> an overall objective <strong>of</strong> social cohesion. This is based on the belief that there is a strongrelation between spatial <strong><strong>in</strong>equalities</strong> and <strong>in</strong>dividual <strong><strong>in</strong>equalities</strong> so that regional policies thatdecrease spatial <strong><strong>in</strong>equalities</strong> can also decrease <strong>in</strong>dividual <strong><strong>in</strong>equalities</strong>.From a theoretical po<strong>in</strong>t <strong>of</strong> view, it is not obvious that countries which are more unequalspatially are also those which have more unequal <strong>in</strong>come distribution. <strong>The</strong> problem comes fromaggregation which is well known to those who have studied the dynamics <strong>of</strong> <strong><strong>in</strong>equalities</strong> at the<strong>in</strong>ternational level (see Bourguignon and Masson, 2003).Take a simple example <strong>of</strong> two countries, A and B, each <strong>of</strong> them comprised <strong>of</strong> tworegions, 1 and 2, each with the same population <strong>of</strong> 50 <strong>in</strong>dividuals. Both countries have the sameaverage GDP and GDP per capita. Country A has no spatial <strong>in</strong>equality; its two regions have thesame <strong>in</strong>come per capita. However, <strong>in</strong> both regions the distribution <strong>of</strong> <strong>in</strong>come is highly unequal.Say 10% <strong>of</strong> <strong>in</strong>dividuals each earn 10 and 90% <strong>of</strong> the population each earn 1. So the overall<strong>in</strong>equality as measured by the percentage <strong>of</strong> total <strong>in</strong>come that goes to the richest 10%, is100/190= 53%. Hence, this is a very unequal society even though there is no spatial <strong>in</strong>equality.<strong>The</strong> other country has a different distribution <strong>of</strong> total <strong>in</strong>come. In region 1, 20% <strong>of</strong> the population
each earn 5.5 and 80% 1.5 so that the average <strong>in</strong>come per capita <strong>in</strong> the region is 2.3. In the otherregion, all earn 1.5. Hence, spatial <strong>in</strong>equality is quite large <strong>in</strong> this case as the <strong>in</strong>come per capita <strong>in</strong>the rich region is more than 50% more than <strong>in</strong> the poor region. However, the distribution <strong>of</strong><strong>in</strong>come at the country level is much less unequal than for country A: the percentage <strong>of</strong> total<strong>in</strong>come that goes to the richest 10% <strong>of</strong> the population (all <strong>in</strong> the richest region) is 55/190= 29%.This illustrative example shows that higher spatial <strong>in</strong>equality measured by <strong>in</strong>come percapita differences across regions does not automatically generate a more unequal distribution <strong>of</strong><strong>in</strong>come. Moreover, <strong>in</strong> our example, a spatially based redistributive policy would seem unfair tothe “poor” <strong>of</strong> the rich region. An <strong>in</strong>come transfer from region 1 to region 2, even if f<strong>in</strong>anced bythe rich <strong>of</strong> the richest region, would artificially create an <strong>in</strong>equality between the “poor” <strong>of</strong> therich region and those <strong>in</strong> the poor region. Such a transfer from the rich to the poor region would<strong>in</strong>crease certa<strong>in</strong> measures <strong>of</strong> <strong>in</strong>come <strong>in</strong>equality.Hence, an obvious question is whether there is a relation between spatial and social<strong><strong>in</strong>equalities</strong>. One way to check whether such a relation exists is to regress a measure <strong>of</strong><strong>in</strong>terpersonal <strong>in</strong>equality (namely, the log <strong>of</strong> the ratio <strong>of</strong> the mean net <strong>in</strong>come <strong>of</strong> the top decile tothe bottom decile) on likely determ<strong>in</strong>ants <strong>of</strong> <strong>in</strong>terpersonal <strong>in</strong>equality as well a measure <strong>of</strong> spatial<strong>in</strong>equality. <strong>The</strong> table shows the results <strong>of</strong> such regressions for pooled data <strong>of</strong> 12 countries(Belgium, Germany, Greece, Spa<strong>in</strong>, France, Italy, Netherlands, Austria, Portugal, F<strong>in</strong>land,Sweden and UK) and the seven years available (1995 to 2001). Aga<strong>in</strong>, the three countries(Ireland, Luxemburg and Denmark) with no NUTS2 regional data are excluded. <strong>The</strong> measure <strong>of</strong>spatial <strong>in</strong>come <strong>in</strong>equality (SPATIAL) is the log <strong>of</strong> the coefficient <strong>of</strong> variation <strong>of</strong> <strong>in</strong>come percapita at the NUTS2 level.<strong>The</strong> first column shows the regression <strong>of</strong> <strong>in</strong>equality on the coefficient <strong>of</strong> variation(SPATIAL) and the log <strong>of</strong> <strong>in</strong>come per capita (INCPERCAP) as it can be argued that richercountries are less unequal than poorer ones. We add year dummies to control for purely cyclicaleffects and country dummies for any omitted variables which are country specific. Spatial<strong>in</strong>equality is <strong>in</strong>deed positively correlated with <strong>in</strong>dividual <strong>in</strong>equality. Income per capita has anegative impact on <strong>in</strong>terpersonal <strong>in</strong>come per capita only <strong>in</strong> (unreported) regressions whencountry dummies are not <strong>in</strong>cluded. An important question is whether, once national transfers aretaken <strong>in</strong>to account, spatial <strong>in</strong>equality still affects <strong>in</strong>dividual <strong>in</strong>come <strong>in</strong>equality. If, when wecontrol for such transfers, spatial <strong><strong>in</strong>equalities</strong> do not anymore affect <strong>in</strong>dividual <strong><strong>in</strong>equalities</strong>, it can
then be argued that national redistribution tools are sufficient for cohesion. To test this, we addthe log <strong>of</strong> per capita expenditure on social transfers (SOCIAL) which we <strong>in</strong>terpret as measur<strong>in</strong>gthe preference <strong>of</strong> the country for redistribution. Note that these are measures <strong>of</strong> nationalredistribution and not <strong>of</strong> regional policies. <strong>The</strong> <strong>in</strong>terest<strong>in</strong>g result is that <strong>in</strong>troduc<strong>in</strong>g this crudemeasure <strong>of</strong> the national redistributive policy does not reduce the coefficient on spatial <strong>in</strong>come<strong>in</strong>equality (SPATIAL). If anyth<strong>in</strong>g, it <strong>in</strong>creases the correlation between social and spatial<strong><strong>in</strong>equalities</strong>.In columns 3 and 4, we redo the exercise but us<strong>in</strong>g a different measure <strong>of</strong> spatial<strong>in</strong>equality. Spatial <strong>in</strong>equality is now <strong>in</strong> terms <strong>of</strong> unemployment us<strong>in</strong>g the Commission measure“Cohesion” which measures regional dispersion <strong>of</strong> unemployment rates for each country. In thiscase, this measure <strong>of</strong> spatial <strong>in</strong>equality is not significantly correlated to <strong>in</strong>come <strong>in</strong>equality. When,<strong>in</strong> column 5, we put both measures <strong>of</strong> spatial <strong>in</strong>equality <strong>in</strong> the regression only the spatial<strong>in</strong>equality <strong>in</strong> <strong>in</strong>comes is significantly correlated with <strong>in</strong>dividual <strong><strong>in</strong>equalities</strong>. <strong>The</strong> correlation isalso quantitatively quite large. Given that the variables are <strong>in</strong> logs, the estimated coefficients canbe <strong>in</strong>terpreted as elasticities. Hence, a 10% <strong>in</strong>crease <strong>in</strong> spatial <strong><strong>in</strong>equalities</strong> <strong>of</strong> <strong>in</strong>come is correlatedwith a 9.7% <strong>in</strong>crease <strong>in</strong> <strong>in</strong>dividual <strong>in</strong>comes, even after controll<strong>in</strong>g for regional <strong><strong>in</strong>equalities</strong> <strong>in</strong>unemployment, for <strong>in</strong>come per capita, social transfers, year and country fixed effects.This exercise should obviously be <strong>in</strong>terpreted with caution as many other determ<strong>in</strong>antscan affect <strong>in</strong>dividual <strong>in</strong>come <strong><strong>in</strong>equalities</strong>. <strong>The</strong> sense <strong>of</strong> causality is also not obvious. Clearly,spatial <strong><strong>in</strong>equalities</strong> could affect <strong>in</strong>dividual <strong><strong>in</strong>equalities</strong> but <strong>in</strong>dividual <strong><strong>in</strong>equalities</strong> could also leadto spatial <strong><strong>in</strong>equalities</strong> if agents (rich and poor) agglomerate <strong>in</strong> different regions. It suggestshowever that the l<strong>in</strong>k between regional and social <strong><strong>in</strong>equalities</strong> seems <strong>in</strong>deed strong even whenwe control for year and country specific effects and that national redistribution policies seem notfully able to elim<strong>in</strong>ate the impact <strong>of</strong> regional <strong>in</strong>come <strong><strong>in</strong>equalities</strong> on social <strong><strong>in</strong>equalities</strong>.
Table 2: Income <strong>in</strong>equality and spatial <strong>in</strong>equalityDependent variable: log <strong>of</strong> the ratio <strong>of</strong> the mean net <strong>in</strong>come <strong>of</strong> the top decile to the bottom decileat country level(1) (2) (3) (4) (5)SPATIAL .772 **(.238).805**(.234).972***(.205)COHESION .107(.110).093(.139)-.039(.094)INCPERCAP .096(.170)-.020(.176).134(.076).190(.163).036(.203)SOCIAL .143(.176)-.087(.299)-.076(.251)Year fixed yes yes yes yes yeseffectsCountry fixed yes yes yes yes YeseffectsNumber <strong>of</strong> 81 71 81 71 71observationsR squared 0.96 0.96 0.96 0.96 0.97(with<strong>in</strong>)Source: Eurostat/Region; ***, **, * significant at 1%, 5% and 10%; standard errors <strong>in</strong> parenthesis. <strong>The</strong> constant anddummy coefficients are not reported. All variables are <strong>in</strong> log.Is there a spatial component to wage <strong><strong>in</strong>equalities</strong> ?An alternative way to analyze the relation between spatial and social <strong><strong>in</strong>equalities</strong> is tolook at the determ<strong>in</strong>ants <strong>of</strong> wage <strong><strong>in</strong>equalities</strong>. If a large part <strong>of</strong> wage <strong><strong>in</strong>equalities</strong> between<strong>in</strong>dividuals is expla<strong>in</strong>ed by geographical factors then <strong>in</strong>deed regional policies that <strong>in</strong>ducerelocation <strong>of</strong> <strong>in</strong>dustries towards poor regions may help decrease <strong>in</strong>dividual <strong><strong>in</strong>equalities</strong>, even
though it may not be the most efficient way to do this. Work by Duranton and Monastiriotis(2002) and Gobillon (2002) however suggest that this is only partially the case. <strong>The</strong> first paperuses data on average regional earn<strong>in</strong>gs <strong>in</strong> UK dur<strong>in</strong>g the 1982-1997 period. It shows a worsen<strong>in</strong>g<strong>of</strong> UK regional <strong><strong>in</strong>equalities</strong> and a rise <strong>in</strong> the North-South gap. However, differences <strong>in</strong> educationaccount for most <strong>of</strong> the aggregate divergence. London ga<strong>in</strong>ed because its workforce becamerelatively more educated over the period. Second, returns to education <strong>in</strong>creased nation-wide,which favoured the most educated regions (i.e., London). Third, returns to education were<strong>in</strong>itially lower <strong>in</strong> London but they (partially) caught up with the rest <strong>of</strong> the country. Had returnsto education and their distribution across UK regions rema<strong>in</strong>ed stable over the period, the UKNorth-South divide would have decreased.Gobillon (2002) uses <strong>in</strong>dividual French data on wages to quantify the determ<strong>in</strong>ants <strong>of</strong>local disparities <strong>in</strong> wages dur<strong>in</strong>g the 1978-1990 period. He f<strong>in</strong>ds that two thirds <strong>of</strong> regional<strong><strong>in</strong>equalities</strong> <strong>in</strong> wages is expla<strong>in</strong>ed by the <strong>in</strong>dividual characteristics <strong>of</strong> the workers; <strong>in</strong> particularhis or her level <strong>of</strong> education. Of course this leaves one third unexpla<strong>in</strong>ed but this is the maximumthat geographical factors could account for.<strong>The</strong>se two studies suggest that a major reason for the <strong>in</strong>crease <strong>in</strong> regional <strong><strong>in</strong>equalities</strong><strong>in</strong>side <strong>Europe</strong>an countries may not have much to do with <strong>geography</strong> <strong>of</strong> production per se. Ifreturns to education have <strong>in</strong>creased s<strong>in</strong>ce the 1980s, which most labour economists believe, thenthe <strong>in</strong>crease <strong>in</strong> regional <strong>in</strong>equality is at least partially a consequence <strong>of</strong> the <strong>in</strong>crease <strong>in</strong> <strong>in</strong>dividual<strong><strong>in</strong>equalities</strong> itself caused by the <strong>in</strong>crease <strong>in</strong> the return to education. A plausible story is that<strong>in</strong>itially rich regions were well endowed with workers with high levels <strong>of</strong> education so that the<strong>in</strong>crease <strong>in</strong> regional disparities <strong>in</strong> GDP per capita reflected the association <strong>of</strong> a general <strong>in</strong>crease<strong>in</strong> the return to education and the <strong>in</strong>itial geographical disparity <strong>in</strong> education levels. Furthermore,it is well known that better educated workers are more mobile so that they may haveconcentrated <strong>in</strong> the richer regions too.Can regional policies <strong>in</strong>crease social <strong><strong>in</strong>equalities</strong>?<strong>The</strong> type <strong>of</strong> <strong>in</strong>strument used by regional policies also has important implications for thel<strong>in</strong>k between <strong>in</strong>dividual <strong><strong>in</strong>equalities</strong> and regional <strong><strong>in</strong>equalities</strong>. Most countries subsidize<strong>in</strong>vestment rather than employment at the regional level and this translates <strong>in</strong>to subsidies tocapital rather than labor (see Yuill et al, 1997, and Fuest and Huber, 2000). An important
example is the subsidy program provided to Eastern Germany. Accord<strong>in</strong>g to Fuest and Huber(2000), 90% <strong>of</strong> the subsidies to firms locat<strong>in</strong>g <strong>in</strong> Eastern Germany take the form <strong>of</strong> <strong>in</strong>vestmentsubsidies. At the <strong>Europe</strong>an level, more than 400 types <strong>of</strong> subsidies exist that can help firms <strong>in</strong>poor regions. <strong>The</strong>y take so many forms that it seems quite safe to characterize them as acomplicated mix <strong>of</strong> subsidies to capital and labor.Regional policies consist<strong>in</strong>g <strong>of</strong> subsidis<strong>in</strong>g <strong>in</strong>dustries so as to give them an <strong>in</strong>centive torelocate <strong>in</strong> disadvantaged regions may have perverse effects on <strong>in</strong>dividual <strong><strong>in</strong>equalities</strong>. If capitalis mobile, subsidis<strong>in</strong>g the return on that capital <strong>in</strong> one region amounts to <strong>in</strong>creas<strong>in</strong>g its return <strong>in</strong>all regions. <strong>The</strong> reason is that if the return to capital is higher <strong>in</strong> one region than <strong>in</strong> another, <strong>in</strong> thelong term, delocation will take place until the returns are equalised (see Dupont and Mart<strong>in</strong>,2003). Regional policies that subsidise capital <strong>in</strong> poor regions may actually imply transfers fromthe poor to the rich region as the <strong>in</strong>crease <strong>in</strong> the return to capital will benefit the region with thehighest share <strong>of</strong> capital ownership. Hence, even if they succeed <strong>in</strong> reduc<strong>in</strong>g regional <strong><strong>in</strong>equalities</strong>,such subsidies to capital can thus end up <strong>in</strong>creas<strong>in</strong>g <strong><strong>in</strong>equalities</strong> between <strong>in</strong>dividuals. This ismaybe an extreme scenario but it serves as a rem<strong>in</strong>der that the choice <strong>of</strong> <strong>in</strong>struments used byregional subsidies is extremely important.To sum up, a large share <strong>of</strong> regional <strong><strong>in</strong>equalities</strong> come from <strong>in</strong>dividual <strong><strong>in</strong>equalities</strong>themselves produced by <strong>in</strong>dividual characteristics, <strong>in</strong> particular differences <strong>in</strong> the educationlevel. This implies that regional policies that <strong>of</strong>fer subsidies to firms that locate <strong>in</strong> poor regionsor that f<strong>in</strong>ance <strong>in</strong>frastructure projects <strong>in</strong> those regions may only have limited effects on regional<strong><strong>in</strong>equalities</strong> and that policies that concentrate on education may be more efficient.VI. ConclusionsPublic economic <strong>in</strong>tervention must be based either on efficiency or on equity considerations.This paper has argued that the legitimacy <strong>of</strong> regional policies <strong>in</strong> <strong>Europe</strong> is not strong on eitherground. A major reth<strong>in</strong>k is required, based on simple pr<strong>in</strong>ciples <strong>in</strong> economics. On the efficiencymotive, we have argued that <strong>in</strong>creas<strong>in</strong>g returns, which expla<strong>in</strong>s spatial economic concentration,also po<strong>in</strong>t to the efficiency ga<strong>in</strong>s <strong>of</strong> this process. Recent econometric evidence shows, <strong>in</strong> the<strong>Europe</strong>an context, that these ga<strong>in</strong>s should be taken <strong>in</strong>to account when def<strong>in</strong><strong>in</strong>g regional policies.
In the light <strong>of</strong> the recent enlargement, this is a crucial trade<strong>of</strong>f. On the equity motive, theevidence suggests that national redistribution schemes (<strong>in</strong>come taxes, social transfers, etc) thatare not spatially def<strong>in</strong>ed do reduce spatial <strong><strong>in</strong>equalities</strong> (at least <strong>in</strong> the French example) but maynot be sufficient <strong>in</strong>struments to reduce social <strong><strong>in</strong>equalities</strong>.Regional policies <strong>in</strong> <strong>Europe</strong> do not take <strong>in</strong>to account the fact that richer countries canredistribute from rich to poor regions through national redistribution more easily than poorcountries. Corsica, even if it has the same GDP per capita as some regions <strong>in</strong> poorer countries,benefits heavily from transfers from Ile de France but this is not taken <strong>in</strong>to account whendesign<strong>in</strong>g <strong>Europe</strong>an regional policies. Given the existence <strong>of</strong> these transfers at the national level,it is not obvious why <strong>Europe</strong>an regional policies should focus on <strong>in</strong>tranational regional<strong><strong>in</strong>equalities</strong>. From this po<strong>in</strong>t <strong>of</strong> view, the recommendation <strong>of</strong> the Sapir report to renationalizeregional policies to focus the impact <strong>of</strong> Structural Funds on <strong><strong>in</strong>equalities</strong> between countries makessense. <strong>The</strong> priority, especially after the enlargement, should be to speed up convergencebetween countries <strong>in</strong> <strong>Europe</strong>. It might be argued that this is at odds with the f<strong>in</strong>d<strong>in</strong>g that<strong>Europe</strong>an <strong>in</strong>tegration has fostered convergence between countries but not regions <strong>in</strong>sidecountries so that regional policies are not necessary for global convergence but for localconvergence. However, <strong><strong>in</strong>equalities</strong> between countries rema<strong>in</strong> much larger, <strong>in</strong> level, thanbetween regions <strong>in</strong>side countries and national redistribution policies are powerful <strong>in</strong>struments toreduce the latter.References :- Andres, F. 2004, Convergence Between Countries vs Divergence With<strong>in</strong> Countries. Mimeo.- Baldw<strong>in</strong>, R, R. Forslid, P. Mart<strong>in</strong>, G. Ottaviano et F. Robert-Nicoud, 2003, "Public Policies andEconomic Geography," Pr<strong>in</strong>ceton University Press.- Baldw<strong>in</strong> R. and P Mart<strong>in</strong>, 2004, “Agglomeration and Regional Growth”, North HollandHandbook <strong>of</strong> Urban and Regional Economics. Henderson and Thisse editors.- Brülhart, M., 1988, “ Trad<strong>in</strong>g Places : Industry Specialization <strong>in</strong> the EU,” Journal <strong>of</strong> CommonMarket Studies, 319-346, vol. 36, n°3.- Brülhart, M et J. Torstensson, 1996, Regional Integration, Scale Economies and IndustryLocation <strong>in</strong> the EU, London CEPR Discussion paper 1435.- Crozet M. and P. Koenig, 2005, ,”<strong>The</strong> Cohesion vs Growth Trade<strong>of</strong>f: Evidence from EURegions (1980-2000)” , mimeo, http://team.univparis1.fr/teamperso/crozet/trade<strong>of</strong>f_July2005.pdf- Davezies L., 1999, “Un essai de mesure de la contribution des budgets des pays membres à lacohesion européenne”, Economie et Prévision, vol. 138-139.
- Dupont V. and P. Mart<strong>in</strong>, 2003, “Regional Regional Policies and Inequalities: Are SubsidiesGood For You?, mimeo, CERAS-<strong>ENPC</strong>.- Duranton G. and V. Monastiriotis, 2002, M<strong>in</strong>d the Gaps: <strong>The</strong> Evolution <strong>of</strong> RegionalInequalities <strong>in</strong> the U.K. 1982-1997 Journal <strong>of</strong> Regional Science, 2002, 42(2), 219-256- Duro, J.A., 2001, Regional <strong>in</strong>come <strong><strong>in</strong>equalities</strong> <strong>in</strong> <strong>Europe</strong>: an updated measurement and somedecomposition results. Instituto de Análisis Económico CSIC.- Forslid, R., J. Haaland et K.H. Midelfart Knarvik, 2002, "A U-shaped <strong>Europe</strong>? A simulationstudy <strong>of</strong> <strong>in</strong>dustrial location," Journal <strong>of</strong> International Economics, 57, 273-97.- Fuest, C. and B. Huber, 2000, Why do governments subsidise <strong>in</strong>vestment and notemployment?, Journal <strong>of</strong> Public Economics 78, 171-192.- Gobillon L., 2002, “Mobilité résidentielle et marché locaux de l’emploi”, Ph.D dissertation,Ecole des Hautes Etudes en Sciences Sociales.- Jaffe A., M. Trajtenberg and R. Henderson, 1993, Geographic Localization <strong>of</strong> KnowledgeSpillovers as Evidenced by Patent Citations, Quarterly Journal <strong>of</strong> Economics, vol. 108(3), 577-98..- Krugman, Paul, 1991, Geography and Trade, MIT Press, Cambridge MA.- Mart<strong>in</strong>, P., 1998, "Can Regional Policies Affect Growth and Geography <strong>in</strong> <strong>Europe</strong>?" <strong>The</strong> WorldEconomy, 21, pp. 757-74.------------, 1999b, "Public policies, Regional Inequalities and Growth," Journal <strong>of</strong> PublicEconomics, 73, 85-105.--------------, -2003, "Public Policies and Economic Geography", <strong>in</strong> Funk and Pizzati (eds),<strong>Europe</strong>an Integration, Regional Policy and Growth, World Bank.- Mart<strong>in</strong>, P. et C. A. Rogers, 1995, “Industrial Location and Public Infrastructure,” Journal <strong>of</strong>International Economics, 39, 335-351.- Midelfart–Knarvik, K. H. and Henry G. Overman, 2002, ”Delocation and <strong>Europe</strong>an <strong>in</strong>tegration:is structural spend<strong>in</strong>g justified? Economic Policy, October.- Midelfart-Knarvik, K.H., H. Overman, S. Read<strong>in</strong>g et A. Venables, 2000, "<strong>The</strong> location <strong>of</strong><strong>Europe</strong>an <strong>in</strong>dustry," Economic Papers 142, <strong>Europe</strong>an Commission.- Monastiriotis V., 2003, Union Retreat and Regional Economic Performance: the UK <strong>in</strong> the1990s, LSE work<strong>in</strong>g paper.Yuill, D., Bachtler, J. and Wishlade, F. , 1997, <strong>Europe</strong>an Regional Incentives 1997-98, 17thedition, Bowker-Saur, London.