Quarterly Index of
Quarterly Index of
Quarterly Index of

You also want an ePaper? Increase the reach of your titles
YUMPU automatically turns print PDFs into web optimized ePapers that Google loves.
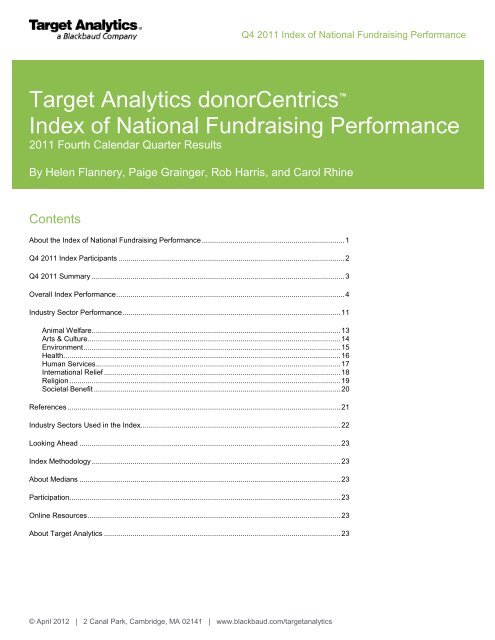
Q4 2011 <strong>Index</strong> <strong>of</strong> National Fundraising PerformanceTarget Analytics donorCentrics <strong>Index</strong> <strong>of</strong> National Fundraising Performance2011 Fourth Calendar Quarter ResultsBy Helen Flannery, Paige Grainger, Rob Harris, and Carol RhineContentsAbout the <strong>Index</strong> <strong>of</strong> National Fundraising Performance ...................................................................... 1Q4 2011 <strong>Index</strong> Participants ............................................................................................................... 2Q4 2011 Summary ............................................................................................................................ 3Overall <strong>Index</strong> Performance ................................................................................................................ 4Industry Sector Performance ........................................................................................................... 11Animal Welfare .......................................................................................................................... 13Arts & Culture ............................................................................................................................ 14Environment .............................................................................................................................. 15Health ........................................................................................................................................ 16Human Services ........................................................................................................................ 17International Relief .................................................................................................................... 18Religion ..................................................................................................................................... 19Societal Benefit ......................................................................................................................... 20References ...................................................................................................................................... 21Industry Sectors Used in the <strong>Index</strong> .................................................................................................. 22Looking Ahead ................................................................................................................................ 23<strong>Index</strong> Methodology .......................................................................................................................... 23About Medians ................................................................................................................................ 23Participation ..................................................................................................................................... 23Online Resources ............................................................................................................................ 23About Target Analytics .................................................................................................................... 23© April 2012 | 2 Canal Park, Cambridge, MA 02141 | www.blackbaud.com/targetanalytics
Q4 2011 <strong>Index</strong> <strong>of</strong> National Fundraising PerformanceAbout the <strong>Index</strong> <strong>of</strong> National Fundraising PerformanceThe Target Analytics donorCentrics <strong>Index</strong> <strong>of</strong> National Fundraising Performance analyzes direct marketing giving for many <strong>of</strong> the largestnon-pr<strong>of</strong>it organizations in the country. For the twelve months ending Q4 2011, Target Analytics evaluated transactions from 80organizations, including over 38 million donors and more than 79 million gifts totaling over $2.5 billion in revenue.The Target <strong>Index</strong> reports on direct marketing giving only. Direct mail is the dominant revenue source for most organizations but web,telemarketing, canvassing, and other gifts considered to be direct marketing are also included. Individual payments greater than$10,000, s<strong>of</strong>t credits, and matching gift payments are excluded.<strong>Quarterly</strong> results are reported on a calendar year basis. This report includes results through December 2011.<strong>Index</strong> findings are based on analysis <strong>of</strong> actual donor transactions, not survey responses from fundraisers. All calculated measures havebeen reviewed by participants for accuracy.© January 2012 | 2 Canal Park, Cambridge, MA 02141 | www.blackbaud.com/targetanalytics 1
Q4 2011 <strong>Index</strong> <strong>of</strong> National Fundraising PerformanceQ4 2011 <strong>Index</strong> ParticipantsAnimal WelfareASPCAHumane Society <strong>of</strong> the United StatesInternational Fund for Animal WelfarePeople for the Ethical Treatment <strong>of</strong> AnimalsArts & CultureColonial Williamsburg FoundationNational Law Enforcement Officers MemorialNational Trust for Historic PreservationNational World War II MuseumThe Smithsonian InstitutionEnvironmentDefenders <strong>of</strong> WildlifeEarthjusticeEnvironmental Defense FundGreenpeace USANational Parks Conservation AssociationNational Wildlife FederationNatural Resources Defense CouncilThe Nature ConservancyThe Ocean ConservancySierra ClubTrout UnlimitedThe Wilderness SocietyWorld Wide Fund for NatureHealthALSAC / St. Jude Children’s Research HospitalAlzheimer’s AssociationAmerican Cancer SocietyAmerican Diabetes AssociationAmerican Health Assistance FoundationAmerican Heart AssociationAmerican Institute for Cancer ResearchAmerican Lung AssociationArthritis FoundationChildren's Cancer Research FundCystic Fibrosis FoundationEaster SealsThe Foundation for AIDS ResearchJuvenile Diabetes Research FoundationLeukemia and Lymphoma SocietyMarch <strong>of</strong> DimesMayo ClinicNational Multiple Sclerosis SocietySpecial OlympicsHuman ServicesAmerican Indian Relief CouncilCal Farley’s Boys RanchCovenant HouseFeeding AmericaParalyzed Veterans <strong>of</strong> AmericaSt. Labre Indian SchoolUnited States Olympic CommitteeInternational ReliefAmeriCaresCARECatholic Relief ServicesChildFund InternationalDoctors Without BordersFINCA InternationalHabitat for Humanity InternationalHeifer Project InternationalInternational Rescue CommitteeMercy CorpsOperation SmileOxfam AmericaPlan USAProject HOPESave the ChildrenU.S. Fund for UNICEFReligionAssociation <strong>of</strong> Marian HelpersMissionary Association <strong>of</strong> Mary ImmaculateSisters <strong>of</strong> St. Francis <strong>of</strong> AssisiSisters <strong>of</strong> St. Francis - PETSociety <strong>of</strong> the Divine SaviorSocietal BenefitAmerican Association <strong>of</strong> University WomenAmerican Civil Liberties UnionAmnesty InternationalAnti-Defamation LeagueHuman Rights CampaignNAACPNARALNational Committee to Preserve Social Security & MedicarePlanned ParenthoodPublic CitizenSouthern Poverty Law Center© January 2012 | 2 Canal Park, Cambridge, MA 02141 | www.blackbaud.com/targetanalytics 2
Q4 2011 <strong>Index</strong> <strong>of</strong> National Fundraising Performance<strong>Index</strong> Revenue and Donors Down Overall in 2011Several Sectors Had Solid Performance, Primarily Due to Increases in Revenue per DonorQ4 2011 SummaryAfter relatively stable post-recessionary performance throughout 2010, overall index revenue declined again in 2011. Revenue in theTarget <strong>Index</strong> <strong>of</strong> National Fundraising Performance declined a median 2.1% from 2010 to 2011.This was in some part due to the fact that the first quarter <strong>of</strong> 2010 was a time <strong>of</strong> extraordinary emergency-related giving for Haitianearthquake relief, and that even typical giving in 2011 might be expected to suffer somewhat by comparison. But prior-year emergencygiving was not the only cause <strong>of</strong> overall index declines, which were widespread throughout the index and were not limited only tointernational relief organizations. Only 39% <strong>of</strong> the organizations in the index had year-over-year revenue increases in 2011.Donor numbers dropped at the same rate as overall index revenue in 2011, declining a median 2.1% from 2010 to 2011. Just over onethird, or 34%, <strong>of</strong> the organizations in the index had year-over-year donor increases 2011.This continues a trend that predates the recession. Donor populations have been shrinking for the past six years, primarily because <strong>of</strong>declines in new donor acquisition. The index has not experienced positive year-to-year overall donor growth or new donor growth sincethe U.S. Gulf Coast hurricanes in the third quarter <strong>of</strong> 2005.In 2011, revenue per donor amounts rose, as they have ever since the end <strong>of</strong> the 2007-2009 recession. This growth was widespreadthroughout the index; 66% <strong>of</strong> the organizations in the index had positive revenue per donor growth over the year. However, decliningoverall revenue shows that, this year, revenue per donor increases are not making up for continuing donor declines.2011 results vary considerably by industry sector.• So far this year, the international relief sector has had the largest declines in the index in every key measure. Relieforganizations experienced extraordinary giving in 2010 following a severe earthquake in Haiti in January. The declines the sectoris seeing now are primarily a return to normal giving patterns from that phenomenal growth which may have been tempered byemergency giving in 2011.• Animal welfare organizations had declines in donors and especially new donor acquisition in the index this year. This is unusualfor this sector, which has been one <strong>of</strong> the strongest in the index for more than five years, experiencing high donor growth whenmost other sectors were experiencing dramatic declines. Revenue increases in 2011 were driven by strong increases in revenueper donor. It remains to be seen whether current trends are just a return to more normal giving patterns as well.• Health organizations in the index continued to see declining performance in most key measures in 2011, as they have for most <strong>of</strong>the past five years. The only increasing metric in 2011 for the health sector was revenue per donor.• The environmental sector continues to have mixed results. Donor numbers declined slightly for the sector in 2011 with revenueremaining essentially flat, but retention and reactivation rate growth were relatively strong.• Two sectors in the index currently appear to be recovering from the recent recession. Arts and culture and religiousorganizations experienced strong performances in most key areas in 2011, as they returned to more normal levels <strong>of</strong> giving fromprevious years <strong>of</strong> decline. It is worth noting, however, that revenue growth for these sectors has been driven by increasedrevenue per donor, rather than increased donor volume.• The human services and societal benefit sectors continued to be the brightest spots in the index this year. Human servicesorganizations had some <strong>of</strong> the greatest increases in revenue, donor, and new donor acquisition while also managing to increaserevenue per donor. Societal benefit organizations had strong growth in many areas – in particular, new donor acquisition – forthe second year in a row.© January 2012 | 2 Canal Park, Cambridge, MA 02141 | www.blackbaud.com/targetanalytics 3
Q4 2011 <strong>Index</strong> <strong>of</strong> National Fundraising PerformanceOverall <strong>Index</strong> PerformanceAll index results are medians unless otherwise specified.Year-to-Year ChangeRevenue for the Target index fell in 2011, declining a median 2.1% from 2010 (see Fig. 1). 34% <strong>of</strong> the organizations in the index hadrevenue increases and 66% had revenue declines over the year.Continuing a trend that predates the recession, index donors declined a median 2.1% from 2010 to 2011. Donor populations have beenshrinking for six years; the index has not experienced positive year-to-year donor growth since the U.S. Gulf Coast hurricanes in thethird quarter <strong>of</strong> 2005. These declines also continue to be widespread; just over one third, or 39%, <strong>of</strong> the organizations in the index hadpositive donor growth in 2011.Fig. 1: Overall <strong>Index</strong> MediansYear-over-Year Changein Key Measures% <strong>of</strong> Organizations withPositive ChangeRevenue-2.1%1.0%39%34%Donors-2.0%-2.1%58%39%Rev / Donor1.6%3.2%71%66%New Donors-4.3%-3.1%45%43%Overall Retention-0.6%0.0%51%44%1st-Year Retention-2.0%-2.5%46%40%Multi-Year Retention-0.3%-1.3%49%41%Reactivation-3.9%1.8%56%40%2009 to 20102010 to 2011Overall donor declines have been primarily due to declines in new donor numbers, which have also been generally shrinking since2005. New donor acquisition fell a median 4.3% from 2010 to 2011, following a Haiti-boosted 3.1% decline the previous year.Under normal circumstances, revenue per donor amounts tend to increase, most likely due to a combination <strong>of</strong> organizational practiceand inflationary adjustments by donors. During the 2007-2009 recession, revenue per donor amounts went into an atypical decline, butreturned to growth again in 2010 after the recession was over. In 2011, revenue per donor amounts continued to rise at typical rates,increasing a median 1.6% from 2010 to 2011 for the index as a whole. 66% <strong>of</strong> the organizations in the index had positive revenue perdonor growth in the year.So far this year, however, increases in revenue per donor have not allowed the index as a whole to maintain revenue levels in the face<strong>of</strong> falling donor populations.© January 2012 | 2 Canal Park, Cambridge, MA 02141 | www.blackbaud.com/targetanalytics 4
Q4 2011 <strong>Index</strong> <strong>of</strong> National Fundraising PerformanceDonor retention rates remained essentially flat from 2010 to 2011, falling a median 0.6% over the period. New donor retention declinedslightly, by 2.1%, while multi-year donor retention was relatively stable.Single Quarter TrendsIn the index, we usually report on year-to-date orrolling twelve-month periods, rather than year-toyearchanges in individual quarters. This is becauseshifts in the timing <strong>of</strong> direct marketing campaignscan, in turn, shift significant revenue from onequarter to another. In addition, smaller donor countsand revenue totals in single quarters canexaggerate the magnitude <strong>of</strong> increases anddecreases in donors and revenue.We have done some analysis on year-to-yeartrends for 2011, however, to evaluate the impact <strong>of</strong>recent current events and economic changes inmore detail.Fig. 2: Median Single-Quarter Year-to-Year ChangeQ1 2010 to Q2 2010 to Q3 2010 to Q4 2010 toQ1 2011 Q2 2011 Q3 2011 Q4 2011Revenue -1.2% 2.6% 3.3% -1.0%Donors -3.4% -2.8% 4.1% -1.1%New Donors -10.2% 3.2% 8.4% -0.8%% <strong>of</strong> Orgs With Positive Revenue Change 41% 60% 59% 48%% <strong>of</strong> Orgs With Positive Donor Change 34% 43% 60% 45%% <strong>of</strong> Orgs With Positive New Donor Change 39% 53% 61% 49%This analysis shows that all giving, particularly new donor acquisition, was down in the first quarter <strong>of</strong> 2011 (see Fig. 2). This is to beexpected, since Q1 2011 giving is being compared to extraordinary disaster-related giving in Q1 2010. The second quarter wascomparatively more stable. In the third quarter there was growth in revenue, donors and new donor acquisition. The fourth quarter wasrelatively flat with small declines in all areas; about half the index organizations had positive change in these metrics.Actual Median Values for Performance MetricsIn our index analyses, we typically focus on the change in metrics over time, such as year-to-year comparisons and long-term trends. Ina fourth-quarter analysis, however, we can examine actual median values <strong>of</strong> key metrics based on a full year <strong>of</strong> data.Median revenue per donor was $70 for the index in 2011 (see Fig. 3). The international relief sector had the highest revenue per donor,with each donor giving $173. The religion sector had the lowest revenue per donor, with each donor giving $22.Fig. 3: 2011 Medians by Industry SectorRevenue Donors Revenue per Donor Average Gift Gifts per DonorOverall <strong>Index</strong> $20,247,318 257,906 $70 $38 1.68Animal Welfare $32,664,484 593,964 $67 $25 2.62Arts & Culture $9,276,050 102,773 $80 $52 1.53Environmental $16,655,967 265,634 $67 $40 1.68Health $18,756,586 568,727 $40 $26 1.50Human Services $27,440,395 511,794 $55 $30 2.01International Relief $30,798,141 216,573 $173 $65 2.15Religion $2,103,035 94,015 $22 $15 1.65Societal Benefit $23,067,671 223,347 $80 $42 2.07% New DonorsOverallRetention RateFirst-YearRetention RateMulti-YearRetention RateReactivation Rate(1-5 Yrs Lapsed)Overall <strong>Index</strong> 27.9% 50.5% 27.3% 58.4% 8.2%Animal Welfare 23.2% 53.7% 32.0% 62.5% 9.0%Arts & Culture 19.7% 65.4% 32.6% 70.8% 9.9%Environmental 25.5% 53.0% 26.9% 61.7% 8.3%Health 27.9% 43.7% 25.7% 53.7% 6.7%Human Services 30.8% 51.2% 33.6% 57.1% 8.4%International Relief 31.4% 42.8% 21.1% 58.4% 7.5%Religion 29.3% 53.3% 30.2% 58.1% 10.8%Societal Benefit 25.7% 56.4% 34.3% 64.4% 10.6%© January 2012 | 2 Canal Park, Cambridge, MA 02141 | www.blackbaud.com/targetanalytics 5
Q4 2011 <strong>Index</strong> <strong>of</strong> National Fundraising Performance<strong>Index</strong> donors gave a median 1.68 gifts each in 2011. Animal welfare organizations had the highest gift frequency <strong>of</strong> any sector,receiving a median 2.62 gifts per donor in 2011. Although sustainer or monthly giving programs are not widespread and typicallyaccount for a small fraction <strong>of</strong> giving, organizations with larger sustainer programs will drive up gifts-per-donor metrics.The index as a whole had a median 50.5% donor retention rate in 2011. The arts and culture sector had the highest retention rate at amedian 65.4%; the international relief sector had the lowest retention rate at a median 42.8%.First-year retention rates were spread slightly differently across the index than were overall retention rates. The index as a whole had amedian 27.3% first-year retention rate in 2011. The societal benefit sector had the highest first-year retention rate at 34.3%; theinternational relief sector had the lowest first-year retention rate at 21.1%.Long-Term Revenue TrendsRolling twelve-month quarterly medians <strong>of</strong>revenue growth can provide longer-term contextfor year-over-year index trends.A rolling analysis compares the twelve months <strong>of</strong>revenue ending in each quarter to the twelvemonths <strong>of</strong> revenue ending in a specified startingquarter. This helps to smooth out seasonaldifferences and allows us to see continuousmovement from one quarter to the next, instead <strong>of</strong>simply comparing one full or partial year to thenext full or partial year.Historically, rolling index revenue has grown atapproximately 4% per year. Revenue grew attypical rates throughout 2006 and 2007 (see Fig.4).Revenue growth then declined substantiallythroughout much <strong>of</strong> 2008 and 2009, parallelingthe weak economy during the recession.8%6%4%2%0%-2%-4%-6%-8%Q4 2006Fig. 4: Five-Year Overall <strong>Index</strong> Revenue and Donor TrendsCumulative Rolling 12-Month Median Change from Q4 2006Start <strong>of</strong>RecessionEnd <strong>of</strong>RecessionHaitiEarthquakeQ1 2007Q2 2007Q3 2007Q4 2007Q1 2008Q2 2008Q3 2008Q4 2008Q1 2009Q2 2009Q3 2009Q4 2009Q1 2010Q2 2010Q3 2010Q4 2010Q1 2011Q2 2011Q3 2011<strong>Index</strong>Revenue1.9%Q4 2011-5.3%<strong>Index</strong>DonorsRevenue began to grow again 2010, spiking particularly dramatically after the Haitian earthquake in January, and then declined again in2011.The result <strong>of</strong> these trends is that cumulatively, over the past five years, overall index revenue has grown quite slowly. From the twelvemonths ending Q4 2006 to the twelve months ending Q4 2011, index revenue grew a cumulative median 1.9%. This is an effectiveannual growth rate <strong>of</strong> 0.4% per year (see Fig. 5).Real index revenue has declined by 8.9% over the past five years when revenue dollar amounts are adjusted for inflation 1 .Long-Term Donor TrendsA rolling twelve-month analysis provides additional context for donor trends as well. It shows that recent donor declines are part <strong>of</strong> along-term pattern that was at its worst during the recent recession.Donor numbers have generally been on a slow decline ever since the U.S. Gulf Coast hurricanes <strong>of</strong> Q3 2005. Declines intensifiedduring the 2007-2009 recession and then continued at a more moderate pace after the recession was over (see Fig. 4). A positive spikein 2010 is likely at least partly due to disaster-related giving following a January earthquake in Haiti.The result <strong>of</strong> these combined trends is that donor numbers have declined significantly over the past five years. Donors declined acumulative median 5.3% from the twelve months ending Q4 2006 to the twelve months ending Q4 2011, for an effective annual rate <strong>of</strong>decline <strong>of</strong> 1.0% per year (see Fig. 5).© January 2012 | 2 Canal Park, Cambridge, MA 02141 | www.blackbaud.com/targetanalytics 6
Q4 2011 <strong>Index</strong> <strong>of</strong> National Fundraising PerformanceFig. 5: Long-Term <strong>Index</strong> Revenue and Donor TrendsFive-Year Change Four-Year Change Three-Year Change Tw o-Year Change One-Year Change2006 to 2011 2007 to 2011 2008 to 2011 2009 to 2011 2010 to 2011RevenueMedian Change 1.9% -2.7% -1.6% 1.8% -2.1%Effective Annual Change 0.4% -0.7% -0.5% 0.9% -2.1%% Orgs w ith Positive Change 53% 44% 45% 56% 39%DonorsMedian Change -5.3% -7.2% -5.8% -4.7% -2.1%Effective Annual Change -1.0% -1.8% -1.9% -2.3% -2.1%% Orgs w ith Positive Change 41% 38% 44% 44% 34%New DonorsMedian Change -14.4% -15.1% -9.9% -4.0% -4.3%Effective Annual Change -2.7% -3.6% -3.2% -2.0% -4.3%% Orgs w ith Positive Change 43.0% 40.0% 33.0% 44.0% 43.0%Show s the cumulative median change from the tw elve-month period ending the first date to the tw elve-month period ending the second datein each column. Effective Annual Change is the average yearly change over the stated time period, adjusted for compounding over that period.As we have said in previous editions <strong>of</strong> the index, falling donor populations in the index may be due to a mix <strong>of</strong> factors. The recessioncertainly had an impact, but so also may have a changing generational pr<strong>of</strong>ile in the United States, changing attitudes <strong>of</strong> donors aboutgiving, and a change in focus by fundraisers toward higher-dollar donors.New DonorsFig. 6: Five-Year Overall <strong>Index</strong> New Donor TrendsCumulative Rolling 12-Month Median Change from Q4 2006Long term overall donor declines have beencaused primarily by declines in new donoracquisition. Over the past five years, from thetwelve months ending Q4 2006 to the twelvemonths ending Q4 2011, new donor numbershave fallen a cumulative median 14.4% (see Fig.6). This is an effective annual rate <strong>of</strong> decline <strong>of</strong>2.7% per year (see Fig. 5).2%0%-2%-4%-6%-8%Start <strong>of</strong>RecessionHaitiEarthquakeAllDonors-5.3%Although these new donor declines predate therecent recession, the recession did acceleratethem. Over the most recent four years, from thetwelve months ending Q4 2007 to the twelvemonths ending Q4 2011, new donor numbers fella median 15.1%, for an effective annual decline <strong>of</strong>3.6% per year.-10%-12%-14%-16%-18%Q4 2006Q1 2007Q2 2007Q3 2007Q4 2007Q1 2008Q2 2008Q3 2008End <strong>of</strong>RecessionQ4 2008Q1 2009Q2 2009Q3 2009Q4 2009Q1 2010Q2 2010Q3 2010Q4 2010Q1 2011Q2 2011Q3 2011NewDonors-14.4%Q4 2011Retention RatesLack <strong>of</strong> new donor growth is the primary cause <strong>of</strong> overall donor declines in the index, but falling first-year donor retention rates are alsopartly responsible.Overall retention remained essentially flat in 2011. Retention rates fell a median 0.6% from 2010 to 2011, after flat 0.0% change theprevious year (see Fig. 7). Just under half (45%) <strong>of</strong> the organizations in the index had positive retention rate growth in 2011.This stability in overall retention masks the fact that first-year donor retention has been declining for the past two years. First-yearretention rates fell 2.5% from 2010 to 2011, on top <strong>of</strong> a 2.0% decline the previous year. 40% <strong>of</strong> the organizations in the index hadpositive first-year retention rate growth in 2011.© January 2012 | 2 Canal Park, Cambridge, MA 02141 | www.blackbaud.com/targetanalytics 7
Q4 2011 <strong>Index</strong> <strong>of</strong> National Fundraising PerformanceFig. 7: Retention Rate ChangeOverall Retention First-Year Donor Retention Multi-Year Donor Retention2009-2010 2010-2011 2009-2010 2010-2011 2009-2010 2010-2011Overall <strong>Index</strong> 0.0% -0.6% -2.0% -2.5% -0.3% -1.3%Animal Welfare -0.6% 0.5% 1.0% -0.9% 1.6% 0.7%Arts & Culture 2.8% 2.8% -6.1% 2.0% 1.5% 1.6%Environmental -0.7% 0.1% 0.2% -2.1% -1.5% -0.8%Health 1.0% -0.3% -2.0% -1.7% 0.4% -3.1%Human Services -2.3% -0.7% -2.9% -5.8% -4.0% 0.9%International Relief 7.7% -19.2% 3.7% -27.5% 6.9% -8.8%Religion -3.2% 1.3% -6.4% 0.8% -2.2% -0.9%Societal Benefit -2.6% 2.3% -2.1% 7.5% -0.2% 2.3%Overall retention rates may not alw ays fall betw een first-year and multi-year donor retention rates for a given sector, since eachrate is a median <strong>of</strong> the rates <strong>of</strong> all organizations in that sector.Multi-year retention has been less volatile. Overall, multi-year retention remained essentially flat, declining a median 1.3% from 2010 to2011. 41% <strong>of</strong> the organizations in the index had positive multi-year retention rate growth in 2011.The Impact <strong>of</strong> the Relief Sector on Overall <strong>Index</strong> PerformanceThe international relief sector had a dramatic spike in giving immediatelyfollowing a severe earthquake in Haiti in January 2010. Now, one year later, therelief sector is experiencing almost equally dramatic declines in all keymeasures as giving returns to more typical levels, although these declines mayhave been tempered somewhat by emergency giving in 2011.The purpose <strong>of</strong> the index is to allow participating organizations to compare theirown performance to that <strong>of</strong> other sectors. Performance metrics based onaggregate index revenue or donors would be dominated by dramatic gains orlosses by a few organizations – such as emergency-related fluctuations in therelief sector – and would not be useful for benchmarking purposes.For this reason, all index results are reported as medians – the middle value <strong>of</strong>the relevant group <strong>of</strong> organizations. This generally mitigates the influence <strong>of</strong>atypical relief sector disaster giving on the index as a whole but it can still bevaluable to look explicitly at the performance <strong>of</strong> non-relief organizations.Relief sector giving does not influence overall year-to-year index results to asignificant degree. Overall index revenue fell a median 2.1% and donors fell2.1% from 2010 to 2011 (see Figs. 8-9). When relief organizations are removedfrom the calculations, index revenue fell a median 1.2% and index donors fell by1.8%.The cumulative effect <strong>of</strong> disaster-related giving to the relief sector is slightlymore noticeable over the longer term, particularly in donor growth.Over the past five years, from the twelve months ending Q4 2006 to the twelvemonths ending Q4 2011, overall index revenue declined a median 1.9%. Whenrelief organizations are removed from the calculations, revenue has declined amedian 2.8% over the same period (see Fig. 10).Overall <strong>Index</strong>Relief SectorNon-Relief SectorsOverall <strong>Index</strong>Relief SectorNon-Relief SectorsFig. 8: Median Revenue ChangeRelief vs. Non-Relief Organizations-9.4%-2.1%-1.2%1.0%0.1%2009 to 2010 2010 to 2011Fig. 9: Median Donor ChangeRelief vs. Non-Relief Organizations-16.1%-2.0%-2.1%-2.7%-1.8%2009 to 2010 2010 to 201134.6%27.2%© January 2012 | 2 Canal Park, Cambridge, MA 02141 | www.blackbaud.com/targetanalytics 8
Q4 2011 <strong>Index</strong> <strong>of</strong> National Fundraising PerformanceFig. 10: Five-Year Revenue TrendsRelief vs. Non-Relief OrganizationsCumulative Rolling 12-Month Median Change from Q4 2006Fig. 11: Five-Year Donor TrendsRelief vs. Non-Relief OrganizationsCumulative Rolling 12-Month Median Change from Q4 200650%40%30%20%10%0%-10%-20%Burma Cyclone &China EarthquakeStart <strong>of</strong>RecessionHaitiEarthquakeEnd <strong>of</strong>RecessionRelief25.8%Overall<strong>Index</strong>1.9%-2.8%Non-Relief50%40%30%20%10%0%-10%-20%ChinaEarthquake& BurmaCycloneStart <strong>of</strong>RecessionHaitiEarthquakeEnd <strong>of</strong>RecessionRelief16.9%Overall<strong>Index</strong>-5.3%-12.4%Non-ReliefQ4 2006Q1 2007Q2 2007Q3 2007Q4 2007Q1 2008Q2 2008Q3 2008Q4 2008Q1 2009Q2 2009Q3 2009Q4 2009Q1 2010Q2 2010Q3 2010Q4 2010Q1 2011Q2 2011Q3 2011Q4 2011Q4 2006Q1 2007Q2 2007Q3 2007Q4 2007Q1 2008Q2 2008Q3 2008Q4 2008Q1 2009Q2 2009Q3 2009Q4 2009Q1 2010Q2 2010Q3 2010Q4 2010Q1 2011Q2 2011Q3 2011Q4 2011Over the same five-year period, overall index donors declined a median 5.3%, but when relief organizations are removed from thecalculations, donors declined by a somewhat greater 12.4% (see Fig. 11).Effects <strong>of</strong> the Economy on GivingResearch by the Giving USA Foundation tells us that charitable giving revenue growth rises during periods <strong>of</strong> strong economicgrowth and slows during periods <strong>of</strong> relative economic weakness. Non-pr<strong>of</strong>it giving trends are not limited to simple parallels with nationaleconomic growth, however. The Foundation has reported in their publication Giving USA that during harder economic times, charitablegiving falls as a percentage <strong>of</strong> the Gross Domestic Product 2 .This means that in a slow economy, not only does giving slow down, but it also declines as a proportion <strong>of</strong> the average American’sspending dollar. In recessionary periods, people shift their spending priorities away from charities, compounding the effects <strong>of</strong> aneconomic decline on fundraising.The Target Analytics index has consistently supported both <strong>of</strong> these findings. Median index revenue growth has generally parallelednational economic performance and tends to grow more slowly than GDP during periods <strong>of</strong> relative economic hardship.According to the National Bureau <strong>of</strong> Economic Research, the United States economy entered a recession in December 2007 andemerged from it in June 2009 3 . Since then, some indicators <strong>of</strong> US economic growth have certainly improved; in particular, positive GDPgrowth for the past two years 4 . However, other indicators – particularly job growth – have not been as consistently encouraging 5 .Non-pr<strong>of</strong>it direct marketing revenue in the Target index declined in 2008 and early 2009 as the economy weakened, and donor declinesintensified during that time as well. We reported overall revenue declines in seven consecutive editions <strong>of</strong> the index (Q2 2008 throughQ4 2009), with some <strong>of</strong> the steepest downturns coming in the first half <strong>of</strong> 2009.Non-pr<strong>of</strong>it revenue in the index leveled <strong>of</strong>f after the declared end <strong>of</strong> the recession but has remained essentially flat since then. Overall,it appears that most participating organizations have not yet regained any significant portion <strong>of</strong> the ground lost over the past four years.This may not be unexpected. Further research by the Giving USA Foundation indicates that once a recession is over, it has taken anaverage <strong>of</strong> three to four years for inflation-adjusted charitable giving to rise back up to pre-recession levels 6 .© January 2012 | 2 Canal Park, Cambridge, MA 02141 | www.blackbaud.com/targetanalytics 9
Q4 2011 <strong>Index</strong> <strong>of</strong> National Fundraising PerformanceThe Growth <strong>of</strong> Internet GivingBy the time <strong>of</strong> publication <strong>of</strong> this edition <strong>of</strong> the index, we were able to identify and verify gift channels for 71 <strong>of</strong> the 80 participatingorganizations, and so are able to include a giving channel analysis in this report.The organizations that participate in the index are large direct marketing organizations that rely primarily on direct mail. Revenue fromother channels, such as telemarketing and the internet, makes up a relatively small portion <strong>of</strong> the overall total, and revenue from largescaleevents is generally not included in the index analysis.In 2011, a median 81% <strong>of</strong> all index revenue came in through the mail, 3% came in through telemarketing, and 6% came in over theinternet (see Fig. 12).Fig. 12: Percent <strong>of</strong> Gifts by ChannelOverall 2011 <strong>Index</strong> MediansFig. 13: Average Gift by ChannelOverall 2011 <strong>Index</strong> MediansMail81%Mail$38Telemarketing3%Telemarketing$39Online6%Online$63All other channels combined made up 10% <strong>of</strong> gifts in 2011.There is a great difference in the relative sizes <strong>of</strong> mail and internet gifts; internet gifts tend to be significantly larger than gifts giventhrough direct mail. For index organizations in 2011, the median mail gift was $38 while the median online gift was $63 (see Fig. 13).For this reason, online giving makes up a larger proportion <strong>of</strong> overall revenue than it does <strong>of</strong> overall gifts.The percentage <strong>of</strong> gifts and revenue coming in online have both been growing steadily over the past five years. In 2007, internet givingaccounted for 2.4% <strong>of</strong> all gifts and 3.6% <strong>of</strong> all revenue. By 2011, internet giving accounted for 6.4% <strong>of</strong> all gifts and 8.8% <strong>of</strong> all revenue(see Fig. 14).Fig. 14: Online Gifts and Revenueas a Percent <strong>of</strong> TotalOverall 2007-2011 <strong>Index</strong> MediansFig. 15: Online Gifts as a Percent <strong>of</strong> Totalby Industry SectorOverall 2011 <strong>Index</strong> MediansGifts8.8%International Relief21%Revenue3.6%2.4%3.2%4.7%4.1%5.7%5.4%7.0%6.4%EnvironmentalSocietal BenefitAnimal WelfareArts & CultureReligion1%3%7%10%12%Human Services1%2007 2008 2009 2010 2011Health0%There is a great deal <strong>of</strong> variation in the prevalence <strong>of</strong> online giving among the different industry sectors in the index (see Fig. 15). Ingeneral, animal welfare, environmental, international relief, and societal benefit organizations receive proportionately more gifts onlinethan do the other sectors in the index. Relief organizations in particular have been able to take good advantage <strong>of</strong> the online givingchannel, using it to enable their donors to respond immediately to emergency fundraising appeals.© January 2012 | 2 Canal Park, Cambridge, MA 02141 | www.blackbaud.com/targetanalytics 10
Q4 2011 <strong>Index</strong> <strong>of</strong> National Fundraising PerformanceIndustry Sector PerformanceIn 2011, fundraising performance varied widely across different industry sectors in the index with six <strong>of</strong> the eight sectors having flat orincreasing revenue with five <strong>of</strong> eight sectors experiencing declining donors (see Figs. 16-17).The international relief sector again experienced the largest declines in the index every key measure. This sector experiencedextraordinary giving in the first quarter <strong>of</strong> 2010 following a severe earthquake in Haiti; the declines the sector is seeing now are primarilya return to normal giving patterns from that phenomenal growth, rather than a concerning decline. Declines in the sector may havebeen tempered somewhat by emergency giving in 2011 related to an earthquake and tsunami in Japan and a drought in the Horn <strong>of</strong>Africa.Fig. 16: Revenue Change by SectorFig. 17: Donor Change by SectorOverall <strong>Index</strong>-2.1%1.0%Overall <strong>Index</strong>-2.0%-2.1%Animal Welfare10.3%1.9%Animal Welfare-1.0%-3.7%Arts & Culture1.3%2.5%Arts & Culture-0.9%0.2%Environmental-0.6%0.6%Environmental-2.6%-1.8%Health-2.3%-4.1%Health-3.2%-7.7%Human Svc0.4%3.0%Human Svc-4.6%4.9%Relief-9.4%34.6%Relief-16.1%27.2%Religion-6.5%1.4%Religion-6.3%-2.1%Soc Benefit4.8%4.0%Soc Benefit3.9%2.0%2009 to 2010 2010 to 20112009 to 2010 2010 to 2011Health organizations in the index continued to see declining performance in most key measures, as they have for most <strong>of</strong> the last fiveyears. Median declines in donors and revenue were larger in 2011 than in 2010.Animal welfare organizations had declines in donors and acquisition but increases in revenue in 2011. As a sector, theseorganizations have seen tremendous donor growth over the past five years and are now seeing a return to more normal giving;however, they have been able to overcome donor downturns with increased donor value.The environmental sector continues to have mixed results. Revenue was flat and donor numbers declined slightly for the sector in2011, closely paralleling the donor declines in the overall index. Reactivation rate growth was relatively strong in 2011 after largedeclines in 2010.Two sectors in the index currently appear to be stabilizing from the recent recession. Arts and culture and religious organizations areexperiencing flat or growing revenue following much instability. Donors did decline slightly in 2011 but increased revenue per donorhelped stabilize overall revenue. Current performance for both <strong>of</strong> these sectors is encouraging after a difficult three years.The human services and societal benefit sectors appear to be the brightest spots in the index this period. Human servicesorganizations had some <strong>of</strong> the greatest increases in revenue, donor, and new donor acquisition while also managing to increaserevenue per donor. Societal benefit organizations had strong growth in many areas – in particular, revenue and new donor acquisition– for the second year in a row.© January 2012 | 2 Canal Park, Cambridge, MA 02141 | www.blackbaud.com/targetanalytics 11
Q4 2011 <strong>Index</strong> <strong>of</strong> National Fundraising PerformanceNew DonorsOverall donor declines in the index were driven primarily by declines innew donor acquisition. As was the case with revenue and overall donorgrowth, new donor growth in 2011 was sharply divided by sector.Arts and culture and societal benefit had significant new donor growthfrom 2010 to 2011 with societal benefit experiencing new donor growth forthe past two years (see Fig. 18). Human services and religiousorganizations also had moderate new donor growth in 2011.International relief and animal welfare had significant new donor declinesfrom 2010 to 2011. Health and environmental had declines in new donoracquisition from 2010 to 2011. For these two sectors, this came on top <strong>of</strong>equally significant new donor declines in the previous year.Fig. 18: New Donor Change by SectorOverall <strong>Index</strong>Animal WelfareArts & CultureEnvironmentalHealthHuman Svc-3.1%-4.3%-4.9%-17.1%-8.3%-8.1%-3.3%-4.5%-10.5%-6.8%8.3%2.5%Retention RatesRelief-33.5%71.9%Donor retention has been an area <strong>of</strong> concern in the index throughout2011. While declining new donor acquisition in primarily responsible forthe overall index donor declines, falling retention rates – particularly firstyearretention rates – also certainly play a part. Now, in the fourthquarter, we can get a complete picture <strong>of</strong> full-year retention rate changes.ReligionSoc Benefit-11.5%1.5%19.9%22.4%Six <strong>of</strong> the eight sectors in the index had flat or declining first year retentionfrom 2010 to 2011 (see Fig 19). Health and human services have nowseen first-year retention rates decline for the second year in a row.2009 to 2010 2010 to 2011For the international relief sector first-year retention rate declines were dramatic, a 27.5% decline from 2010 to 2011. This is to beexpected following the response to the earthquake in Haiti in 2010.Multi-year retention was, as always, more stable than first-year retention. Arts and culture and societal benefit organizations in the indexhad increases in multi-year donor retention in 2011. Animal welfare, environmental, human services and religious organizationsremained essentially flat and health and international relief organizations had large declines (see Fig 20).Individual sector results are explained in more detail on the following pages. All sector results are medians unless otherwise specified.Fig. 19: First-Year Retention Rate Changeby SectorFig. 20: Multi-Year Retention Rate Changeby SectorOverall <strong>Index</strong>-2.0%-2.5%Overall <strong>Index</strong>-0.3%-1.3%Animal Welfare-0.9%1.0%Animal Welfare1.6%0.7%Arts & Culture-6.1%2.0%Arts & Culture1.5%1.6%Environmental-2.1%0.2%Environmental-1.5%-0.8%Health-2.0%-1.7%Health-3.1%0.4%Human Svc-2.9%-5.8%Human Svc-4.0%0.9%Relief-27.5%3.7%Relief-8.8%6.9%Religion-6.4%0.8%Religion-2.2%-0.9%Soc Benefit-2.1%7.5%Soc Benefit-0.2%2.3%2009 to 2010 2010 to 20112009 to 2010 2010 to 2011© January 2012 | 2 Canal Park, Cambridge, MA 02141 | www.blackbaud.com/targetanalytics 12
Q4 2011 <strong>Index</strong> <strong>of</strong> National Fundraising PerformanceAnimal Welfare4 organizationsThe animal welfare sector has been one <strong>of</strong> the strongest sectors in the index for more than five years, with significant donor growthduring a time when most other sectors had donor declines. In 2011, however, this sector has seen declines in donors and particularlynew donor acquisition, all <strong>of</strong> which are among the largest declines in the index. At least some <strong>of</strong> this may be a return to normal givingfollowing extraordinary fundraising in 2010 after the Haitian earthquake and the Gulf Coast oil spill.RevenueDonorsRev / DonorNew DonorsFig. 21: Animal Welfare Sector MediansYear-to-Date Change in Key Measures-17.1%-1.0%-3.7%-4.9%10.3%1.9%4.6%5.9%40%35%30%25%20%15%10%5%0%-5%-10%Fig. 22: Five-Year Animal Welfare Revenue Trends12-Month Quarter-End Median Change from Q4 2006Michael VickIndictmentGulf Oil SpillHaiti EarthquakeQ4 '06Q1 '07Q2 '07Q3 '07Q4 '07Q1 '08Q2 '08Q3 '08Q4 '08Q1 '09Q2 '09Q3 '09Q4 '09Q1 '10Q2 '10Q3 '10Q4 '10Q1 '11Q2 '11Q3 '11Q4 '11AnimalWelfareSector34.1%Entire<strong>Index</strong>1.9%Each data point is the median change in revenue for the 12 months ending in that quarter fromthe 12 months ending in Q4 2006.Overall Retention-0.6%0.5%Fig. 23: Five-Year Animal Welfare Donor Trends12-Month Quarter-End Median Change from Q4 20061st-Year RetentionMulti-Year RetentionReactivation-0.9%-4.0%-5.4%1.0%1.6%0.7%40%35%30%25%20%15%10%5%0%-5%-10%Michael VickIndictmentHaitiEarthquakeGulf OilSpillQ4 '06Q1 '07Q2 '07Q3 '07Q4 '07Q1 '08Q2 '08Q3 '08Q4 '08Q1 '09Q2 '09Q3 '09Q4 '09Q1 '10Q2 '10Q3 '10Q4 '10Q1 '11Q2 '11Q3 '11Q4 '11AnimalWelfareSector8.0%-5.3%Entire<strong>Index</strong>2009 to 2010 2010 to 2011Each data point is the median change in donors for the 12 months ending in that quarter from the12 months ending in Q4 2006.Animal welfare revenue increased a median 1.9% from 2010 to 2011, compared to an overall index median revenue decline <strong>of</strong> 2.1%(see Fig. 21). Two <strong>of</strong> the four organizations in this sector had revenue growth in 2011.Donors to animal welfare organizations declined a median 3.7%, from 2010 to 2011, compared to an overall index median donordecline <strong>of</strong> 2.1%. New donor acquisition declined a median 17.1% from 2010 to 2011, compared to an overall index median new donordecline <strong>of</strong> 4.3%.Rolling twelve-month trends give us more long-term context for recent animal welfare sector performance. The sector received asubstantial amount <strong>of</strong> giving in late 2005 after the U.S. Gulf Coast hurricanes and had an accompanying decline in revenue and donorsone year later, in 2006. Since then, the sector has had two significant event-related spikes in revenue and donors over the past fiveyears; one in 2007 following the conviction <strong>of</strong> pr<strong>of</strong>essional football player Michael Vick on dog fighting charges, and one in the first half<strong>of</strong> 2010 following the Haitian earthquake and the BP oil spill.These spikes have enabled the animal welfare sector to outperform index revenue and donor medians significantly over the past fiveyears. From the twelve months ending Q4 2006 to the twelve months ending Q4 2011, revenue growth for the animal welfare sectorgrew by a cumulative median 34.1%, while the index as a whole had revenue growth <strong>of</strong> 1.9% (see Fig. 22). Over the same period,sector donors grew by a median 8.0% while the overall index saw a median donor decline <strong>of</strong> 5.3% (see Fig. 23).When evaluating results for this sector, it is important to be aware that it includes only four organizations.© January 2012 | 2 Canal Park, Cambridge, MA 02141 | www.blackbaud.com/targetanalytics 13
Q4 2011 <strong>Index</strong> <strong>of</strong> National Fundraising PerformanceArts & Culture5 organizationsDuring the recent recession, arts and culture organizations had flat to negative trends in most key measures that were similar to orslightly more negative than those <strong>of</strong> the index as a whole. The sector particularly struggled with new donor acquisition and first-yeardonor retention. In 2011, however, increases in revenue, revenue per donor, retention, and reactivation and, in particular, new donoracquisition indicates that the sector may be experiencing stabilization.RevenueDonorsRev / DonorNew DonorsFig. 24: Arts & Culture Sector MediansYear-to-Date Change in Key Measures-8.3%-0.9%1.3%2.5%0.2%2.2%1.6%8.3%8%4%0%-4%-8%-12%-16%Fig. 25: Five-Year Arts & Culture Revenue Trends12-Month Quarter-End Median Change from Q4 2006Start <strong>of</strong>RecessionEnd <strong>of</strong>RecessionQ4 '06Q1 '07Q2 '07Q3 '07Q4 '07Q1 '08Q2 '08Q3 '08Q4 '08Q1 '09Q2 '09Q3 '09Q4 '09Q1 '10Q2 '10Q3 '10Q4 '10Q1 '11Q2 '11Q3 '11Q4 '11Entire<strong>Index</strong>1.9%-2.7%Arts &CultureSectorEach data point is the median change in revenue for the 12 months ending in that quarter fromthe 12 months ending in Q4 2006.Overall Retention2.8%2.8%Fig. 26: Five-Year Arts & Culture Donor Trends12-Month Quarter-End Median Change from Q4 20061st-Year RetentionMulti-Year RetentionReactivation-6.1%2.0%1.5%1.6%2.2%7.0%8%4%0%-4%-8%-12%-16%Start <strong>of</strong>RecessionEnd <strong>of</strong>RecessionEntire<strong>Index</strong>-5.3%Arts & CultureSector-13.7%2009 to 2010 2010 to 2011Q4 '06Q1 '07Q2 '07Q3 '07Q4 '07Q1 '08Q2 '08Q3 '08Q4 '08Q1 '09Q2 '09Q3 '09Q4 '09Q1 '10Q2 '10Q3 '10Q4 '10Q1 '11Q2 '11Q3 '11Q4 '11Each data point is the median change in donors for the 12 months ending in that quarter fromthe 12 months ending in Q4 2006.Arts and culture sector revenue increased a median 2.5% from 2010 to 2011 (see Fig. 24), compared to overall index revenue declines<strong>of</strong> 2.1%. This was the third largest increase in revenue in the index over the period. Three <strong>of</strong> the five organizations in the sector hadpositive revenue growth in 2011.Sector donors increased a median 0.2% from 2010 to 2011, compared to overall index donor declines <strong>of</strong> 2.1%. This was one <strong>of</strong> threesectors with flat or increasing donors in the index. Three <strong>of</strong> the five organizations in the sector had positive donor growth in 2011.New arts and culture donors increased by 8.3% from 2010 to 2011. This was one <strong>of</strong> four sectors with increases in new donors in theindex but is likely at least in part a rebound from 8.3% declines over the same period the previous year. Three <strong>of</strong> the five organizationsin the sector had positive new donor growth in 2011.Twelve-month rolling trends can provide longer-term context for recent arts and culture sector results. Revenue and donor growth forthe sector have both been volatile; both generally matched the overall index from 2007 to 2009 but underperformed it in 2010. Thespike in revenue in the first quarter <strong>of</strong> 2011 appears to be driven primarily by two <strong>of</strong> the five organizations in the sector. Over the pastfive years, from the twelve months ending Q4 2006 to the twelve months ending Q4 2011, the arts and culture sector has hadcumulative median revenue decline <strong>of</strong> 2.7%, while the index grew 1.9%% (see Fig. 25). Over the same period, the sector had acumulative median donor decline <strong>of</strong> 13.7%, significantly greater than the overall index decline <strong>of</strong> 5.3% (see Fig. 26).When evaluating results for this sector, it is important to be aware that it includes only five organizations.© January 2012 | 2 Canal Park, Cambridge, MA 02141 | www.blackbaud.com/targetanalytics 14
Q4 2011 <strong>Index</strong> <strong>of</strong> National Fundraising PerformanceEnvironment13 organizationsUnlike many index sectors, the environmental sector does not tend to see a great deal <strong>of</strong> fluctuation in giving from quarter to quarter orfrom year to year. Environmental organizations maintained their revenue levels better than most during and after the recent recession.And while environmental donors have declined over the past five years, these declines have generally not been as severe as they havebeen for other sectors, and are currently tracking close to overall index medians.RevenueDonorsRev / DonorNew DonorsFig. 27: Environmental Sector MediansYear-to-Date Change in Key Measures-8.1%-0.6%-2.6%-1.8%-3.3%0.6%0.2%4.3%15%10%5%0%-5%-10%-15%Fig. 28: Five-Year Environmental Revenue Trends12-Month Quarter-End Median Change from Q4 2006Start <strong>of</strong>RecessionEnd <strong>of</strong>RecessionGulf OilSpillEntire<strong>Index</strong>1.9%-1.8%EnvironmentalSectorQ4 '06Q1 '07Q2 '07Q3 '07Q4 '07Q1 '08Q2 '08Q3 '08Q4 '08Q1 '09Q2 '09Q3 '09Q4 '09Q1 '10Q2 '10Q3 '10Q4 '10Q1 '11Q2 '11Q3 '11Q4 '11Each data point is the median change in revenue for the 12 months ending in that quarter fromthe 12 months ending in Q4 2006.Overall Retention1st-Year RetentionMulti-Year RetentionReactivation-7.8%-0.7%-2.1%-1.5%-0.8%0.1%0.2%8.5%15%10%5%0%-5%-10%-15%Fig. 29: Five-Year Environmental Donor Trends12-Month Quarter-End Median Change from Q4 2006Start <strong>of</strong>RecessionEnd <strong>of</strong>RecessionGulf OilSpillEntire<strong>Index</strong>-5.3%-9.0%EnvironmentalSectorQ4 '06Q1 '07Q2 '07Q3 '07Q4 '07Q1 '08Q2 '08Q3 '08Q4 '08Q1 '09Q2 '09Q3 '09Q4 '09Q1 '10Q2 '10Q3 '10Q4 '10Q1 '11Q2 '11Q3 '11Q4 '112009 to 2010 2010 to 2011Each data point is the median change in donors for the 12 months ending in that quarter fromthe 12 months ending in Q4 2006.Revenue for the environmental sector increased 0.6% from 2010 to 2011, compared to overall index declines <strong>of</strong> 2.1% (see Fig. 27).54% <strong>of</strong> the environmental organizations in the index had positive revenue growth in 2011.Environmental donors decreased a median 1.8% from 2010 to 2011, while the index as a whole declined 2.1%. 31% <strong>of</strong> theenvironmental organizations in the index had positive donor growth in 2011.New donor acquisition declined 3.3% for the sector from 2010 to 2011, while the index as a whole declined 4.3%. 46% <strong>of</strong> theorganizations in the sector had positive new donor growth over the period.Reactivation rates rose significantly for the sector in the 2011, increasing 8.5% from 2010 to 2011, after declines <strong>of</strong> 7.8% in the sameperiod the previous year.Twelve-month rolling trends can provide longer-term context for recent sector trends. This analysis shows that ever since a 2007 prerecessionaryboost in revenue, environmental revenue and donor growth have followed index medians relatively closely. The result isthat the sector has been able to remain close to the index as a whole as compared to other sectors.From the twelve months ending Q4 2006 to the twelve months ending Q4 2011, the environmental sector had median cumulativerevenue decline <strong>of</strong> 1.8% while overall index revenue grew a median 1.9% over the same period. (see Fig. 28). From the twelve monthsending Q4 2006 to the twelve months ending Q4 2011, the sector had cumulative median donor declines <strong>of</strong> 9.0% while the index as awhole had similar donor declines <strong>of</strong> 5.3% (see Fig. 29).© January 2012 | 2 Canal Park, Cambridge, MA 02141 | www.blackbaud.com/targetanalytics 15
Q4 2011 <strong>Index</strong> <strong>of</strong> National Fundraising PerformanceHealth19 organizationsHealth organizations have had some <strong>of</strong> the greatest fundraising challenges in the index for much <strong>of</strong> the past five years. Negative healthsector trends predated the recent recession but were significantly intensified by it. In 2011, sector revenue, donor, and new donoracquisition declines continued to be among the largest in the index, and came on top <strong>of</strong> declines over the same period in the previousyear.RevenueDonorsRev / DonorNew DonorsFig. 30: Health Sector MediansYear-to-Date Change in Key Measures-10.5%-7.7%-2.3%-4.1%-4.5%-3.2%2.6%2.7%10%5%0%-5%-10%-15%-20%-25%-30%-35%Fig. 31: Five-Year Health Revenue Trends12-Month Quarter-End Median Change from Q4 2006Start <strong>of</strong>RecessionEnd <strong>of</strong>RecessionQ4 '06Q1 '07Q2 '07Q3 '07Q4 '07Q1 '08Q2 '08Q3 '08Q4 '08Q1 '09Q2 '09Q3 '09Q4 '09Q1 '10Q2 '10Q3 '10Q4 '10Q1 '11Q2 '11Q3 '11Q4 '11Entire<strong>Index</strong>1.9%-15.3%HealthSectorEach data point is the median change in revenue for the 12 months ending in that quarter fromthe 12 months ending in Q4 2006.Overall Retention-0.3%1.0%Fig. 32: Five-Year Health Donor Trends12-Month Quarter-End Median Change from Q4 20061st-Year RetentionMulti-Year RetentionReactivation-8.3%-2.0%-1.7%-3.1%0.4%2.4%10%5%0%-5%-10%-15%-20%-25%-30%-35%Start <strong>of</strong>RecessionEnd <strong>of</strong>RecessionEntire<strong>Index</strong>-5.3%HealthSector-29.7%2009 to 2010 2010 to 2011Q4 '06Q1 '07Q2 '07Q3 '07Q4 '07Q1 '08Q2 '08Q3 '08Q4 '08Q1 '09Q2 '09Q3 '09Q4 '09Q1 '10Q2 '10Q3 '10Q4 '10Q1 '11Q2 '11Q3 '11Q4 '11Each data point is the median change in donors for the 12 months ending in that quarter fromthe 12 months ending in Q4 2006.Health sector revenue declined a median 4.1% from 2010 to 2011 (see Fig. 30). Only 16% <strong>of</strong> the organizations in the health sector hadpositive revenue growth in 2011.Health sector donors declined a median 7.7% from 2010 to 2011. Only 16% <strong>of</strong> the organizations in this sector had positive donorgrowth in 2011.New donors for the sector declined 10.5% from 2010 to 2011 following a 4.5% decline in the previous year. 26% <strong>of</strong> the organizations inthe health sector had positive new donor growth in 2011.Revenue per donor did increase for the sector in 2011, rising 2.7% from 2010 to 2011. However, these increasing revenue per donoramounts may be a reflection <strong>of</strong> the declining numbers <strong>of</strong> relatively low-dollar new donors.Health sector revenue and donor growth have both lagged overall index median trends significantly over the long term. From the twelvemonths ending Q4 2006 to the twelve months ending Q4 2011, health organizations had cumulative revenue declines <strong>of</strong> 15.3%,compared 1.9% growth for the index as a whole (see Fig. 31). Over the same five-year period, health organizations had a cumulativedonor decline <strong>of</strong> 29.7%, compared to a decline <strong>of</strong> only 5.3% for the index as a whole (see Fig. 32).This study considers direct marketing revenue, not event revenue. Several health charities have large-scale fundraising events that arenot included in this analysis.© January 2012 | 2 Canal Park, Cambridge, MA 02141 | www.blackbaud.com/targetanalytics 16
Q4 2011 <strong>Index</strong> <strong>of</strong> National Fundraising PerformanceHuman Services7 organizationsThe human services sector was one <strong>of</strong> the strongest in the index during the recent recession, well outperforming the index in bothrevenue and donor growth during both 2008 and 2009. During this time <strong>of</strong> greatest need, donors may have deliberately concentratedtheir giving on organizations in this sector, which provide direct aid to the disadvantaged. After the end <strong>of</strong> the recession, humanservices organizations had mixed results, maintaining revenue levels but struggling with acquisition and retention. In 2011, however,the sector appeared to be going through another surge in giving, with the highest rates <strong>of</strong> donor growth and the second highest inrevenue growth in the index.RevenueDonorsRev / DonorNew DonorsFig. 33: Human Services Sector MediansYear-to-Date Change in Key Measures-6.8%-4.6%0.4%1.4%1.7%3.0%2.5%4.9%20%15%10%5%0%-5%-10%-15%Fig. 34: Five-Year Human Services Revenue Trends12-Month Quarter-End Median Change from Q4 2006Start <strong>of</strong>RecessionEnd <strong>of</strong>RecessionQ4 '06Q1 '07Q2 '07Q3 '07Q4 '07Q1 '08Q2 '08Q3 '08Q4 '08Q1 '09Q2 '09Q3 '09Q4 '09Q1 '10Q2 '10Q3 '10Q4 '10Q1 '11Q2 '11Q3 '11Q4 '11HumanServicesSector13.6%1.9%Entire<strong>Index</strong>Each data point is the median change in revenue for the 12 months ending in that quarter fromthe 12 months ending in Q4 2006.Overall Retention-2.3%-0.7%Fig. 35: Five-Year Human Services Donor Trends12-Month Quarter-End Median Change from Q4 20061st-Year RetentionMulti-Year RetentionReactivation-2.9%-5.8%-4.0%-2.0%0.9%5.4%20%15%10%5%0%-5%-10%-15%Start <strong>of</strong>RecessionEnd <strong>of</strong>RecessionHumanServicesSector-4.5%-5.3%Entire<strong>Index</strong>2009 to 2010 2010 to 2011Q4 '06Q1 '07Q2 '07Q3 '07Q4 '07Q1 '08Q2 '08Q3 '08Q4 '08Q1 '09Q2 '09Q3 '09Q4 '09Q1 '10Q2 '10Q3 '10Q4 '10Q1 '11Q2 '11Q3 '11Q4 '11Each data point is the median change in donors for the 12 months ending in that quarter fromthe 12 months ending in Q4 2006.Human services sector revenue grew a median 3.0% from 2010 to 2011 (see Fig. 33), while the index as a whole had revenue declines<strong>of</strong> 2.1%. This was the second largest revenue increase <strong>of</strong> any sector in the index; four <strong>of</strong> the seven organizations in this sector hadpositive revenue growth in 2011.Human services donors grew by a median 4.9% from 2010 to 2011. This was the largest donor growth <strong>of</strong> any sector in the index andcame at a time when the index as a whole had donor declines <strong>of</strong> 2.1%. Five <strong>of</strong> the seven organizations in this sector had positive donorgrowth in 2011.New donor acquisition was similarly strong, up 2.5% from 2010 to 2011. Four <strong>of</strong> the seven organizations in this sector had positive newdonor growth in 2011.Rolling twelve-month trends can give a longer-term perspective to current results and show that the sector has well outperformed theindex in revenue growth over the past five years. From the twelve months ending Q4 2006 to the twelve months ending Q4 2011,human services revenue grew a cumulative median 13.6% while overall index revenue grew by 1.9% (see Fig. 34). Over the same fiveyearperiod, sector donors declined a cumulative median 4.5%, while the index as a whole has declined 5.3% (see Fig. 35).© January 2012 | 2 Canal Park, Cambridge, MA 02141 | www.blackbaud.com/targetanalytics 17
Q4 2011 <strong>Index</strong> <strong>of</strong> National Fundraising PerformanceInternational Relief16 organizationsRecent relief sector performance has been dominated by fundraising following a severe earthquake in Haiti on January 12, 2010. Thesector experienced extraordinary growth in all key areas last year, on a scale almost equal to the period after the Indian Ocean tsunami<strong>of</strong> 2004. In 2011 the sector had the large declines in all key measures that would be expected with giving returning to more typicallevels, although emergencies in Japan and the Horn <strong>of</strong> Africa may have tempered the declines somewhat.RevenueDonorsRev / DonorNew DonorsFig. 36: International Relief Sector MediansYear-to-Date Change in Key Measures-33.5%-9.4%-16.1%-0.1%4.2%34.6%27.2%71.9%50%40%30%20%10%0%-10%Fig. 37: Five-Year Relief Revenue Trends12-Month Quarter-End Median Change from Q4 2006Burma Cyclone& China EarthquakeHaitiEarthquakeQ4 '06Q1 '07Q2 '07Q3 '07Q4 '07Q1 '08Q2 '08Q3 '08Q4 '08Q1 '09Q2 '09Q3 '09Q4 '09Q1 '10Q2 '10Q3 '10Q4 '10Q1 '11Q2 '11Q3 '11Q4 '11ReliefSector25.8%1.9%Entire<strong>Index</strong>Each data point is the median change in revenue for the 12 months ending in that quarter fromthe 12 months ending in Q4 2006.Overall Retention-19.2%7.7%Fig. 38: Five-Year Relief Donor Trends12-Month Quarter-End Median Change from Q4 20061st-Year RetentionMulti-Year RetentionReactivation-27.5%-8.8%-26.0%3.7%6.9%37.5%50%40%30%20%10%0%-10%BurmaCyclone& ChinaEarthquakeHaitiEarthquakeReliefSector16.9%Entire<strong>Index</strong>-5.3%2009 to 2010 2010 to 2011Q4 '06Q1 '07Q2 '07Q3 '07Q4 '07Q1 '08Q2 '08Q3 '08Q4 '08Q1 '09Q2 '09Q3 '09Q4 '09Q1 '10Q2 '10Q3 '10Q4 '10Q1 '11Q2 '11Q3 '11Q4 '11Each data point is the median change in donors for the 12 months ending in that quarter fromthe 12 months ending in Q4 2006.Revenue for the international relief sector declined a median 9.4% from 2010 to 2011 (see Fig. 36). This was by far the largest revenuedecline in the index. Only two relief organizations had revenue increases in 2011.Relief organizations had the largest donor declines in the index as well, with a 16.1% decline in overall donors and a 33.5% decline innew donors from 2010 to 2011. Two <strong>of</strong> the organizations in the sector had positive donor growth and five had positive new donorgrowth in the 2011.Revenue per donor for the sector was flat in 2011, declining a median 0.1% from 2010 to 2011. This may indicate that relieforganizations have been relatively successful in maintaining giving amounts from those donors they were able to retain after the Haitianearthquake. This is particularly notable considering that emergency gifts tend to be significantly larger than non-emergency gifts, andthat relief organizations already receive the largest gifts <strong>of</strong> any sector.Rolling revenue and donor trends can give a longer-term context for recent relief sector performance. Since 2007, sector revenue anddonors have roughly paralleled overall index medians, with the exception <strong>of</strong> a small spike related to emergency-related giving in 2008and the dramatic Haiti-related spike in 2010.This emergency giving has helped the relief sector to outperform the index as a whole over the past five years. Relief sector revenue isup a cumulative 25.8% from the twelve months ending Q4 2006 to the twelve months ending Q4 2011, while the index as a whole hadrevenue growth <strong>of</strong> 1.9% (see Fig. 37). Donor numbers are up 16.9% for the relief sector over the same five-year period, compared to anoverall index median donor decline <strong>of</strong> 5.3% (see Fig. 38).© January 2012 | 2 Canal Park, Cambridge, MA 02141 | www.blackbaud.com/targetanalytics 18
Q4 2011 <strong>Index</strong> <strong>of</strong> National Fundraising PerformanceReligion5 organizationsReligious organizations in the index have experienced a fair amount <strong>of</strong> volatility over the past several years. The sector saw stronggrowth in all key measures in the first half <strong>of</strong> 2011 with a leveling out <strong>of</strong> key measures by the end <strong>of</strong> 2011. This comes after steepdeclines in almost all key measures in the same period the previous year, and is likely more <strong>of</strong> a recovery or a return to normal givingpatterns than a spike in fundraising.RevenueDonorsRev / DonorNew DonorsFig. 39: ReligionSector MediansYear-to-Date Change in Key Measures-11.5%-6.5%-6.3%-2.1%-1.2%1.4%1.8%1.5%10%5%0%-5%-10%-15%-20%Fig. 40: Five-Year Religion Revenue Trends12-Month Quarter-End Median Change from Q4 2006Start <strong>of</strong>RecessionEnd <strong>of</strong>RecessionQ4 '06Q1 '07Q2 '07Q3 '07Q4 '07Q1 '08Q2 '08Q3 '08Q4 '08Q1 '09Q2 '09Q3 '09Q4 '09Q1 '10Q2 '10Q3 '10Q4 '10Q1 '11Q2 '11Q3 '11Q4 '11Entire<strong>Index</strong>1.9%-1.2%ReligionSectorEach data point is the median change in revenue for the 12 months ending in that quarter fromthe 12 months ending in Q4 2006.Overall Retention-3.2%1.3%Fig. 41: Five-Year Religion Donor Trends12-Month Quarter-End Median Change from Q4 20061st-Year RetentionMulti-Year RetentionReactivation-6.4%-2.2%-0.9%-1.3%0.8%1.7%10%5%0%-5%-10%-15%-20%Start <strong>of</strong>RecessionEnd <strong>of</strong>RecessionEntire<strong>Index</strong>-5.3%ReligionSector-16.3%Q4 '06Q1 '07Q2 '07Q3 '07Q4 '07Q1 '08Q2 '08Q3 '08Q4 '08Q1 '09Q2 '09Q3 '09Q4 '09Q1 '10Q2 '10Q3 '10Q4 '10Q1 '11Q2 '11Q3 '11Q4 '112009 to 2010 2010 to 2011Each data point is the median change in revenue for the 12 months ending in that quarter fromthe 12 months ending in Q4 2006.Religion sector revenue rose a median 1.4% from 2010 to 2011 (see Fig. 39). Three <strong>of</strong> the six organizations in this sector had positiverevenue growth in 2011. Sector donors declined 2.1%% from 2010 to 2011, the same level as the index as a whole. Two <strong>of</strong> the fiveorganizations in this sector had positive donor growth in 2011.The religion sector had new donor growth in 2011; new donors to religious organizations rose a median 1.5% from 2010 to 2011, at atime when the index as a whole had new donor declines <strong>of</strong> 4.3%. Four <strong>of</strong> the five organizations in this sector had positive new donorgrowth over the period.Retention was an area <strong>of</strong> particular concern for the religion sector in 2010, when the sector had large retention rate declines. Retentionrates appear to have recovered somewhat in 2011.From the twelve months ending Q4 2006 to the twelve months ending Q4 2011, sector revenue declined a cumulative median 1.2%,compared to overall index median growth <strong>of</strong> 1.9 % (see Fig. 40). Over the same period, sector donor numbers declined a median16.3%%, compared to overall index declines <strong>of</strong> 5.3% (see Fig. 41).All five <strong>of</strong> the organizations in this sector are Catholic faith-based organizations.© January 2012 | 2 Canal Park, Cambridge, MA 02141 | www.blackbaud.com/targetanalytics 19
Q4 2011 <strong>Index</strong> <strong>of</strong> National Fundraising PerformanceSocietal Benefit11 organizationsFrom 2006 to 2009, societal benefit organizations experienced some <strong>of</strong> the greatest fundraising challenges <strong>of</strong> any sector in the index.These negative trends appear to have turned around for the sector in 2010 and 2011. Societal benefit organizations had strong revenueand donor increases and the largest increase in new donor acquisition in the index this period.RevenueDonorsRev / DonorNew DonorsFig. 42: Societal Benefit Sector MediansYear-to-Date Change in Key Measures-0.8%4.8%4.0%3.9%2.0%0.6%19.9%22.4%10%5%0%-5%-10%-15%Fig. 43: Five-Year Societal Benefit Revenue Trends12-Month Quarter-End Median Change from Q4 2006Start <strong>of</strong>RecessionEnd <strong>of</strong>RecessionSocietalBenefit Sector3.1%Q4 '06Q1 '07Q2 '07Q3 '07Q4 '07Q1 '08Q2 '08Q3 '08Q4 '08Q1 '09Q2 '09Q3 '09Q4 '09Q1 '10Q2 '10Q3 '10Q4 '10Q1 '11Q2 '11Q3 '11Q4 '11Each data point is the median change in revenue for the 12 months ending in that quarterfrom the 12 months ending in Q4 2006.1.9%Entire<strong>Index</strong>Overall Retention1st-Year Retention-2.6%-2.1%2.3%7.5%10%5%Fig. 44: Five-Year Societal Benefit Donor Trends12-Month Quarter-End Median Change from Q4 2006SocietalBenefitSector3.9%Multi-Year RetentionReactivation-0.2%-1.4%2.3%0.7%0%-5%-10%-15%Start <strong>of</strong>RecessionEnd <strong>of</strong>Recession-5.3%Entire<strong>Index</strong>Q4 '06Q1 '07Q2 '07Q3 '07Q4 '07Q1 '08Q2 '08Q3 '08Q4 '08Q1 '09Q2 '09Q3 '09Q4 '09Q1 '10Q2 '10Q3 '10Q4 '10Q1 '11Q2 '11Q3 '11Q4 '112009 to 2010 2010 to 2011Each data point is the median change in revenue for the 12 months ending in that quarter fromthe 12 months ending in Q4 2006.Societal benefit sector revenue increased a median 4.0% from 2010 to 2011 (see Fig. 42), compared to overall index median declines<strong>of</strong> 2.1%. Revenue growth was relatively widespread; 64% <strong>of</strong> the organizations in the sector had positive revenue growth in 2011.Societal benefit donor populations grew a median 2.0% from 2010 to 2011, while the index as a whole experienced donor declines <strong>of</strong>2.1%. 55% <strong>of</strong> the organizations in the sector had positive donor growth in 2011.Unlike most index sectors, societal benefit organizations had relatively strong new donor growth throughout 2009 and 2010, and thisgrowth has continued into 2011. New donors for the sector grew by a median 22.4% from 2010 to 2011. This was the largest growth innew donors in the index and came on top <strong>of</strong> 19.9% growth in the same period in the previous year. 55% <strong>of</strong> the organizations in thissector had positive donor growth in 2011.Revenue per donor was down slightly by a median 0.8% in 2011, but this may be due at least in part to the sustained influx <strong>of</strong>comparatively lower-dollar new donors.A rolling twelve-month revenue and donor analysis can provide a longer-term perspective on these recent trends. It shows that thesector generally underperformed the index in revenue and donor growth from 2006 to 2009, but that the sector regained ground in 2010and in 2011.The result is that cumulative revenue and donor growth for the societal benefit sector over the past five years have both been aboveoverall index medians. From the twelve months ending Q4 2006 to the twelve months ending Q4 2011, societal benefit revenue rose acumulative median 3.1%, compared to overall index revenue growth <strong>of</strong> 1.9% (see Fig. 43). Over the same period, societal benefitdonors increased a cumulative median 3.9%, compared to the overall index decline <strong>of</strong> 5.3% (see Fig. 44).© January 2012 | 2 Canal Park, Cambridge, MA 02141 | www.blackbaud.com/targetanalytics 20
Q4 2011 <strong>Index</strong> <strong>of</strong> National Fundraising PerformanceReferences1. U.S. Department <strong>of</strong> Labor Bureau <strong>of</strong> Labor Statistics Analysis, Seasonally adjusted month-end Consumer Price <strong>Index</strong> (U.S. cityaverage, all items), http://www.bls.gov/. Retrieved April 2, 2012.2. Giving USA Foundation, Giving USA 2006, pp. 22 and 29.3. National Bureau <strong>of</strong> Economic Research, NBER Business Cycle Dating Committee Announces Trough Date, September 20, 2010,http://www.nber.org/cycles/sept2010.html. Retrieved March 22, 2012.4. U.S. Department <strong>of</strong> Commerce Bureau <strong>of</strong> Economic Analysis, Gross Domestic Product, 4th Quarter 2011 (third estimate), March29, 2012, http://www.bea.gov/newsreleases/national/gdp/gdpnewsrelease.htm. Retrieved April 5, 2012.5. U.S. Department <strong>of</strong> Labor Bureau <strong>of</strong> Labor Statistics, Employment Situation Summary, March 9, 2012,http://www.bls.gov/news.release/empsit.nr0.htm. Retrieved April 3, 2012.6. Giving USA Foundation, “Giving Recovery after Economic Depression or Recession,” Giving USA Spotlight, Issue 2, 2009, p. 8.Article written by Melanie Miller, Sarah Schaefer, and Corinne Wagner <strong>of</strong> the Center on Philanthropy at Indiana University.© January 2012 | 2 Canal Park, Cambridge, MA 02141 | www.blackbaud.com/targetanalytics 21
Q4 2011 <strong>Index</strong> <strong>of</strong> National Fundraising PerformanceIndustry Sectors Used in the <strong>Index</strong>Animal Welfare OrganizationsOrganizations that focus on the care, protection, or understanding <strong>of</strong> pets or specialty animals, other than livestock. Includes humanesocieties, veterinary services, aquariums, and zoos.Arts & Culture OrganizationsOrganizations that promote enjoyment or understanding <strong>of</strong> the visual, performing, folk, or media arts or the humanities; communicationsorganizations; and organizations that promote the appreciation or understanding <strong>of</strong> historical events, including historical societies andgenealogical or heredity-based organizations.Environmental OrganizationsPrograms that focus on the preservation and protection <strong>of</strong> the environment, including pollution control and abatement programs;conservation and development <strong>of</strong> natural resources (land, plant, water, energy); control or elimination <strong>of</strong> hazardous and toxicsubstances (including pesticides); solid waste management programs; botanical gardens and societies; urban beautification and openspaces programs; and environmental education. Also includes programs that focus primarily on the protection and preservation <strong>of</strong>wildlife or fisheries.Health OrganizationsPrograms which help people achieve and maintain physical well-being through prevention, screening, evaluation and treatment;programs that promote mental health and treatment <strong>of</strong> mental illness; voluntary health organizations that are organized on a national,state or local basis and supported primarily by voluntary contributions from the public at large, which are engaged in a program <strong>of</strong>service, education and some research that is related to a particular disease, condition or disability, or group <strong>of</strong> diseases, conditions ordisabilities; research institutes and other organizations whose primary purpose is to promote the advancement <strong>of</strong> knowledge aboutspecific diseases, disorders, or medical disciplines.Human Services OrganizationsOrganizations that promote or provide a broad range <strong>of</strong> social or human services to individuals or families; organizations that focus onprotecting the public from antisocial elements; organizations that help individuals to find and sustain gainful employment; organizationsthat focus on the development and improvement <strong>of</strong> food resources; organizations that focus on promoting adequate housing forindividuals, families and communities; organizations which aim to prevent, predict or control the effects <strong>of</strong> domestic disasters (e.g.,floods, earthquakes, fires, tornadoes); organizations that work to build character and develop leadership and social skills amongchildren and youth.International Relief OrganizationsOrganizations that provide development and relief services to foreign countries and/or organizations that raise and distribute funds forthe benefit <strong>of</strong> overseas institutions.Religious OrganizationsPrograms operated for the purpose <strong>of</strong> worship, religious training or study, governance or administration <strong>of</strong> organized religions, or thepromotion <strong>of</strong> religious activities.Societal Benefit OrganizationsPrograms that focus on protecting and promoting the broad civil rights and civil liberties <strong>of</strong> individuals, improving relations betweenracial, ethnic, and cultural groups, and promoting voter education and registration; advocacy and citizen action groups that work tochange public policy and opinion in a variety <strong>of</strong> areas; organizations that work to strengthen, unify, and build community spirit andincrease the capacity <strong>of</strong> various community organizations to improve the quality <strong>of</strong> life for all.Sector definitions are based on a modification <strong>of</strong> the Foundation Center’s National Taxonomy <strong>of</strong> Exempt Entities.http://fdncenter.org/ntee/index.html© January 2012 | 2 Canal Park, Cambridge, MA 02141 | www.blackbaud.com/targetanalytics 22
Q4 2011 <strong>Index</strong> <strong>of</strong> National Fundraising PerformanceLooking AheadThe next installment <strong>of</strong> the index, to be released in July 2012, will examine activity for the first quarter <strong>of</strong> 2012. Findings can be found athttp://www.blackbaud.com/targetanalytics.<strong>Index</strong> MethodologyTarget Analytics applied the following rules to standardize data from each <strong>of</strong> the organizations participating in the <strong>Index</strong> <strong>of</strong> NationalFundraising Performance:Individual payments greater than $5,000, s<strong>of</strong>t credits, and matching gift payments are excluded. Direct mail is the dominant or onlyrevenue source for most organizations; however, web, telemarketing, event, and other sources are included. Indicators are calculatedon a cash payment basis, as opposed to a pledge basis. Gifts or donors are defined as new, retained, or reactivated according torelative gift dates rather than organization-specific business rules or source codes. Retention rates for quarterly analysis are calculatedby dividing the number <strong>of</strong> donors giving in the current year-to-date quarter(s) who also gave during the previous calendar year by thetotal number <strong>of</strong> donors who gave in the previous calendar year. Revenue per donor refers to the cumulative giving per donor percurrent period.About MediansUnless otherwise noted, index trends are measured by using the median percent change among a group <strong>of</strong> organizations. The medianis the middle value in a ranked order <strong>of</strong> numbers. Using this statistic to describe historical trending minimizes distortion caused by thewide range <strong>of</strong> organizations’ file sizes or extreme changes at a few organizations.ParticipationParticipation in the index is limited to organizations that meet size and geographic requirements as well as other terms and conditions.For information about index eligibility contact Sue Rock Tully at srocktully@targetanalysis.com. Please direct questions or requests toreproduce these findings to targetindex@blackbaud.com.Online ResourcesParticipating organizations are granted access to an online, interactive graphical system where they can chart their own performanceresults against overall and sector-specific medians. Please contact your account representative for your password and for moreinformation.About Target AnalyticsTarget Analytics, a Blackbaud company, delivers data-driven, collaborative solutions designed to help non-pr<strong>of</strong>it organizationsmaximize their fundraising potential. Founded in 1989, Target Analytics was the first company to bring forward-thinking non-pr<strong>of</strong>itorganizations together to establish industry-standard benchmarking and openly discuss successful strategies and practices.© January 2012 | 2 Canal Park, Cambridge, MA 02141 | www.blackbaud.com/targetanalytics 23