Operational risk capital and insurance in emerging markets
Operational risk capital and insurance in emerging markets
Operational risk capital and insurance in emerging markets

Create successful ePaper yourself
Turn your PDF publications into a flip-book with our unique Google optimized e-Paper software.
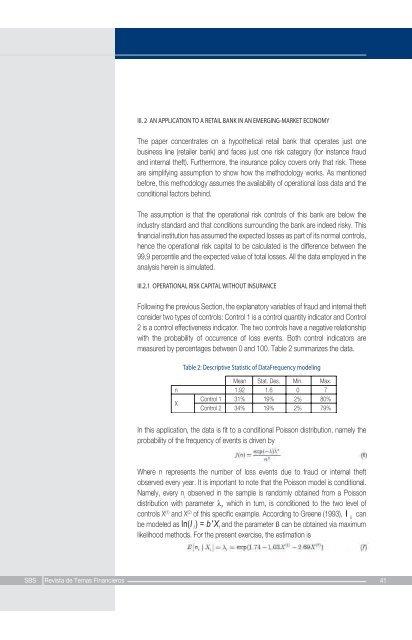
III. 2 AN APPLICATION TO A RETAIL BANK IN AN EMERGING-MARKET ECONOMYThe paper concentrates on a hypothetical retail bank that operates just onebus<strong>in</strong>ess l<strong>in</strong>e (retailer bank) <strong>and</strong> faces just one <strong>risk</strong> category (for <strong>in</strong>stance fraud<strong>and</strong> <strong>in</strong>ternal theft). Furthermore, the <strong><strong>in</strong>surance</strong> policy covers only that <strong>risk</strong>. Theseare simplify<strong>in</strong>g assumption to show how the methodology works. As mentionedbefore, this methodology assumes the availability of operational loss data <strong>and</strong> theconditional factors beh<strong>in</strong>d.The assumption is that the operational <strong>risk</strong> controls of this bank are below the<strong>in</strong>dustry st<strong>and</strong>ard <strong>and</strong> that conditions surround<strong>in</strong>g the bank are <strong>in</strong>deed <strong>risk</strong>y. Thisf<strong>in</strong>ancial <strong>in</strong>stitution has assumed the expected losses as part of its normal controls,hence the operational <strong>risk</strong> <strong>capital</strong> to be calculated is the difference between the99,9 percentile <strong>and</strong> the expected value of total losses. All the data employed <strong>in</strong> theanalysis here<strong>in</strong> is simulated.III.2.1 OPERATIONAL RISK CAPITAL WITHOUT INSURANCEFollow<strong>in</strong>g the previous Section, the explanatory variables of fraud <strong>and</strong> <strong>in</strong>ternal theftconsider two types of controls: Control 1 is a control quantity <strong>in</strong>dicator <strong>and</strong> Control2 is a control effectiveness <strong>in</strong>dicator. The two controls have a negative relationshipwith the probability of occurrence of loss events. Both control <strong>in</strong>dicators aremeasured by percentages between 0 <strong>and</strong> 100. Table 2 summarizes the data.Table 2: Descriptive Statistic of DataFrequency model<strong>in</strong>gIn this application, the data is fit to a conditional Poisson distribution, namely theprobability of the frequency of events is driven byWhere n represents the number of loss events due to fraud or <strong>in</strong>ternal theftobserved every year. It is important to note that the Poisson model is conditional.Namely, every n iobserved <strong>in</strong> the sample is r<strong>and</strong>omly obta<strong>in</strong>ed from a Poissondistribution with parameter λ i, which <strong>in</strong> turn, is conditioned to the two level ofcontrols X (1) <strong>and</strong> X (2) of this specific example. Accord<strong>in</strong>g to Greene (1993), licanbe modeled as In(I i ) = b'X i <strong>and</strong> the parameter ß can be obta<strong>in</strong>ed via maximumlikelihood methods. For the present exercise, the estimation isSBS Revista de Temas F<strong>in</strong>ancieros 41