Operational risk capital and insurance in emerging markets
Operational risk capital and insurance in emerging markets
Operational risk capital and insurance in emerging markets

Create successful ePaper yourself
Turn your PDF publications into a flip-book with our unique Google optimized e-Paper software.
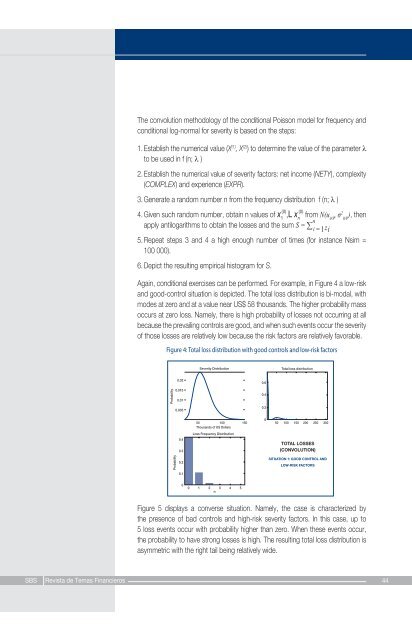
The convolution methodology of the conditional Poisson model for frequency <strong>and</strong>conditional log-normal for severity is based on the steps:1. Establish the numerical value (X (1) , X (2) ) to determ<strong>in</strong>e the value of the parameter λto be used <strong>in</strong> f (n; λ )2. Establish the numerical value of severity factors: net <strong>in</strong>come (NETY), complexity(COMPLEX) <strong>and</strong> experience (EXPR).3. Generate a r<strong>and</strong>om number n from the frequency distribution f (n; λ )4. Given such r<strong>and</strong>om number, obta<strong>in</strong> n values of x (0) 1,L x (0) nfrom N(u 0/P, σ 2 ), then0/Papply antilogarithms to obta<strong>in</strong> the losses <strong>and</strong> the sum S = ∑ n i = 1zi5. Repeat steps 3 <strong>and</strong> 4 a high enough number of times (for <strong>in</strong>stance Nsim =100 000).6. Depict the result<strong>in</strong>g empirical histogram for S.Aga<strong>in</strong>, conditional exercises can be performed. For example, <strong>in</strong> Figure 4 a low-<strong>risk</strong><strong>and</strong> good-control situation is depicted. The total loss distribution is bi-modal, withmodes at zero <strong>and</strong> at a value near US$ 58 thous<strong>and</strong>s. The higher probability massoccurs at zero loss. Namely, there is high probability of losses not occurr<strong>in</strong>g at allbecause the prevail<strong>in</strong>g controls are good, <strong>and</strong> when such events occur the severityof those losses are relatively low because the <strong>risk</strong> factors are relatively favorable.Figure 4: Total loss distribution with good controls <strong>and</strong> low-<strong>risk</strong> factorsFigure 4: Total loss distribution with good controls <strong>and</strong> low-<strong>risk</strong> factorsSeverity DistributionTotal loss distributionProbability0.020.0150.010.0050.60.40.20.40.3050 100 150 50 100 150 200 250 300Thous<strong>and</strong>s of US DollarsLoss Frequency DistributionTOTAL LOSSES(CONVOLUTION)Probability0.20.1SITUATION 1: GOOD CONTROL ANDLOW-RISK FACTORS00 1 2 3 4 5nFigure 5 displays a converse situation. Namely, the case is characterized bythe presence of bad controls <strong>and</strong> high-<strong>risk</strong> severity factors. In this case, up to5 loss events occur with probability higher than zero. When these events occur,the probability to have strong losses is high. The result<strong>in</strong>g total loss distribution isasymmetric with the right tail be<strong>in</strong>g relatively wide.SBS Revista de Temas F<strong>in</strong>ancieros 44