A6 RUSHDEN – HIGHAM FERRERS BYPASS ... - Highways Agency
A6 RUSHDEN – HIGHAM FERRERS BYPASS ... - Highways Agency
A6 RUSHDEN – HIGHAM FERRERS BYPASS ... - Highways Agency

Create successful ePaper yourself
Turn your PDF publications into a flip-book with our unique Google optimized e-Paper software.
Table 6.2 - Allocated Housing Sites 56Table 6.3 - 57Table 6.4 - Responses to the Question: “Has the Bypass has made the Area a Better Place to Live?” 58Table 7.1 - Appraisal Summary Table 64Table 7.2 - Evaluation Summary Table 65Table B.1 <strong>–</strong> Summary of POPE-Environment Consultation Responses 72Table B.2 <strong>–</strong> Summary of predicted effects on the Noise sub-objective 73Table B.3 <strong>–</strong> ES predicted Effects, proposed Mitigation and the Evaluation of the Noise sub-objective 75Table B.4 <strong>–</strong> Summary of predicted effects on the Air Quality sub-objective 76Table B.5 <strong>–</strong> ES predicted Effects, proposed Mitigation and the Evaluation of the Air Quality sub-objective 77Table B.11 <strong>–</strong> Summary of predicted effects on the Heritage sub-objective 88Table B.12 <strong>–</strong> ES predicted Effects, proposed Mitigation and the Evaluation of the Heritage sub-objective 89TableB.13 <strong>–</strong> Summary of predicted effects on the Water sub-objective 91Table B.14 <strong>–</strong> ES predicted Effects, proposed Mitigation and the Evaluation of the Water sub-objective 92List of FiguresFigure 1.1 - Location of <strong>A6</strong> Rushden to Higham Ferrers Bypass 10Figure 1.2 - Layout of <strong>A6</strong> Rushden <strong>–</strong> Higham Ferrers Bypass 12Figure 1.3 <strong>–</strong> Sequence of Post Opening Reporting 14Figure 1.4 - Questionnaire Distribution Zones 16Figure 2.1 - Count Site Locations 18Figure 2.2 - Journey Time Routes 18Figure 2.3 - ‘Before’ and ‘Five Year After’ Traffic Counts (AWT) 20Figure 3.1 - Accident Study Area 30Figure 4.1 - Schematic representation of the stages of the POPE methodology 40
GlossaryThe following table details the acronyms and specialist terms used within the context of this reportTermAADTAAWTAccessibilityAMASTATCAWTCOBACRFDfTDiscountingESTHATRISHGV<strong>Highways</strong><strong>Agency</strong>DefinitionAnnual Average Daily Traffic. Average of 24 hour flows, sevendays a week, for all days within the year.Annual Average Weekday Traffic. As AADT but for five days,(Monday to Friday) only.Accessibility can be defined as ‘ease of reaching’. The accessibilityobjective is concerned with increasing the ability with which peoplein different locations, and with differing availability of transport, canreach different types of facility.denoting the morning peak periodAppraisal Summary Table. This records the impacts of the schemeaccording to the Government’s five key objects for transport, asdefined in DfT guidance contained on its Transport AnalysisGuidance web pages, WebTAGAutomatic Traffic Count, a machine which measures traffic flow at apoint in the road.Average Weekday Traffic. Average of Monday to Friday 24 hourflows.COst Benefit Analysis <strong>–</strong> a computer program which compares thecosts of providing road schemes with the benefits derived by roadusers (in terms of time, vehicle operating costs and accidents), andexpresses the results in terms of a monetary valuation. The COBAmodel uses the fixed trip matrix.Congestion Reference Flow - AADT flow at which a road is likely tobe congested in the peak periods of an average day.Department for TransportDiscounting is a technique used to compare costs and benefits thatoccur in different time periods and is the process of adjusting futurecash flows to their present values to reflect the time value ofmoney, e.g. £1 worth of benefits now is worth more than £1 in thefuture. A standard base year needs to be used which is 2002 forthe appraisal used in this report.Evaluation Summary Table. In POPE studies, this is a summary ofthe evaluations of the TAG objectives using a similar format to theforecasts in the AST.<strong>Highways</strong> <strong>Agency</strong> Traffic Information SystemHeavy Goods Vehicle.An Executive <strong>Agency</strong> of the Department for Transport, responsiblefor operating, maintaining and improving the strategic road networkin England.
IPLight vehicleNATANRTFNMUOGV1, OGV2OPRPARPIAPIA/mvkmPMPOPERoute StressScreenlineSeasonalitySeveranceTPIVehicle hoursInter Peak, the time between the AM and PM peaksNot a HGV. For traffic flow data, it is a vehicle less than 5.2m inlength.New Approach To Appraisal Used for transport scheme appraisalsince 1998.National Road Traffic Forecast. This document defines the latestforecasts produced by the Department of the Environment,Transport and the Regions of the growth in the volume of motortraffic. The most recent one is NRTF97 and the one previous wasNRTF89.Non-Motorised UserOther Goods Vehicle. OGV1 = Goods Vehicles with 2 or 3 axles,OGV2= Goods Vehicles with 4 or more axlesOrder Publication ReportProject Appraisal Report These are undertaken for <strong>Highways</strong><strong>Agency</strong> improvement schemes which are not TPIsPersonal Injury Accident. A road traffic accident in which at leastone person required medical treatment.PIA/mvkm is the number of PIAs per million vehicle kilometreswhere ‘vehicle kilometres’ are the number of vehicles using asection of the road multiplied by the length of the road.evening peak periodPost Opening Project Evaluation, before & after monitoring of allmajor highway schemes in England.This is used as a proxy for journey time reliability. It is described asthe stress level of a road and is calculated as the ratio of flow tocapacity: AADT / CRF.An imaginary line drawn across a transport corridor used todetermine flows between areas on either side. Each road crossedby the screenline is monitored by a traffic count (ATC).Seasonality is the variation in traffic behaviour across the year dueto varying daylight levels, weather conditions, school holidays, etc.Community severance is the separation of adjacent areas by roador heavy traffic, causing negative impact on non-motorised users,particularly pedestrians.Targeted Programme of Improvements. The <strong>Highways</strong> <strong>Agency</strong>’sprogramme of investment in improvements to the Trunk road andMotorway road network comprised of a number of major schemeseach costing more than £5m.Vehicle hours refers to the total time spent by all vehicles using aroad and is expressed normally as a yearly value. For example, if10,000 vehicles a day used a route with a 6 minute journey time,then the route’s vehicle hours for the year would be 365,000.
vpdwebTAGVehicles Per DayDepartment for Transport’s website for guidance on the conduct oftransport studies at http://www.webtag.org.uk/
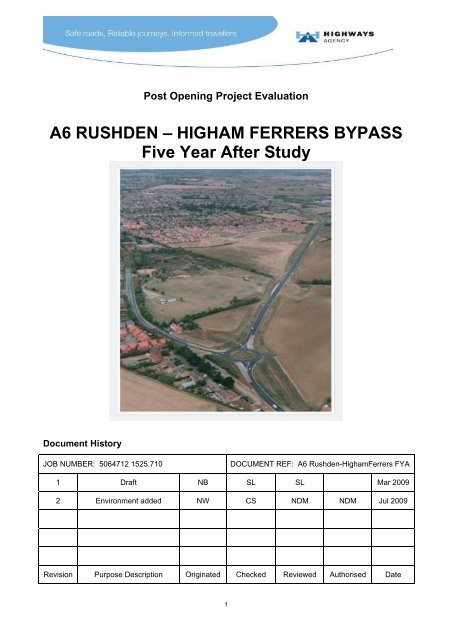
Executive SummaryScheme Title <strong>A6</strong> Rushden <strong>–</strong> Higham Ferrers BypassOpening Date August 2003POPE Stage Five Years AfterScheme DescriptionThe scheme consists of a 5.4km bypass around the towns of Rushden and Higham Ferrers inNorthamptonshire. The new road is single carriageway for 3km and dual carriageway for 2.4kmand runs south from the existing <strong>A6</strong>/A45 roundabout, and rejoins the existing <strong>A6</strong> at a newroundabout south of Rushden. A new link road, the A5001 John Clark Way, was built by the localauthority to connect the bypass with Rushden Town Centre, in order to facilitate newdevelopment.Objectives (Appraisal Summary Table)Objective Achieved?Reduce environmental problems in Rushden and HighamFerrersImprove road safetyRelieve congestionImprove journey time reliabilityYesYes, but less than predictedYesYesKey FindingsThe objectives of the <strong>A6</strong> Rushden and Higham Ferrers Bypass have been met <strong>–</strong> to reducecongestion, and environmental problems, whilst improving safety and journey time reliability.However, the safety benefits are less than predicted.The traffic flows in the southern part of the modelled area were significantly under predicted.No documentation is available to help verify the original appraisal assumptions and therefore itis not clear whether forecasts had made reference to development in this area. It appears thata number of developments have taken place which were not considered in the schemeappraisal.Although the outturn journey time savings per vehicle are a little lower than predicted, there aremore vehicles on the network than predicted, benefiting from the savings and giving higherthan expected benefits.These extra benefits were offset by greater than anticipated scheme costs. The HA has sincechanged its cost estimating method to improve accuracy.Accident savings have been observed. Public consultation indicate a perception that thescheme has improved safety overall, but comments reveal concerns with the A45/<strong>A6</strong> ChownsMill roundabout and speeding on the bypass.Although justified on traffic criteria, some members of the public have questioned the reasonfor the change in road standard from dual to single carriageway on the bypass.The bypass scheme and John Clark Way together has facilitated significant localdevelopments in the area.Lower traffic through the towns of Rushden and Higham Ferrers has reduced severance in thearea and facilitates the movement of pedestrians and cyclists.The environmental mitigation measures appear to have been effective in mitigating the impactsof the scheme.The scheme has contributed to the achievement of objectives set out in local plans andpolicies.Most residents believe that the area is now a better place to live as a result of the bypass.
The scheme has not had a direct impact on public transport provision. No routes use thebypass, but existing services on the old <strong>A6</strong> have experienced a slight improvementresulting from the small decrease in journey times.IntegrationAs forecast, the scheme is broadly consistent with the delivery of key policies within theNorthamptonshire Structure Plan and the East Northamptonshire Local PlanThe scheme was predicted to facilitate the delivery of objectives within the East ofWellingborough Development Area. Given the schemes location in relation toWellingborough, it is unlikely the scheme has had a direct impact on these objectives.When asked whether the area is a better place to live following opening of the bypass,58% of residents agreed whilst only 15% disagreed.Summary of Scheme Economic PerformancePre-schemeforecast(2002 Prices)Post-openingre-forecast(2002 Prices)Journey Time Benefit £21.7m £36.3mSafety Benefit £6.1m £3.4mTotal 30 Year Benefits (PVB) £27.8m £39.7mCosts (PVC) £10.6m £16.2mBenefit Cost Ratio (BCR) 2.6 2.4The journey time benefits arising from the scheme are 67% higher than predicted, but thesafety impacts are almost half that predicted.The outturn scheme cost is approximately £6m greater than predicted, representing anincrease of 52%.The greater than predicted journey time benefits are offset by the lower safety benefitsand higher scheme costs giving rise to BCR similar to that forecast.9
1. IntroductionIntroduction1.1 The <strong>A6</strong> Rushden <strong>–</strong> Higham Ferrers Bypass is a <strong>Highways</strong> <strong>Agency</strong> (HA) MajorScheme to provide 5.4 km of new road bypassing the towns of Rushden andHigham Ferrers in Northamptonshire. The scheme opened to traffic on 14 th August2003 and this report is a Five Year After (FYA) evaluation of the impacts of thescheme.Scheme BackgroundScheme Location1.2 The <strong>A6</strong> was formerly the London to Carlisle trunk road. However its importance asa long-distance route declined with the development of the motorway network, andthe <strong>A6</strong> was detrunked in September 2004. The Rushden <strong>–</strong> Higham Ferrers bypassis one of a series of bypasses built on the <strong>A6</strong>, others being at Rothwell &Desborough in Northamptonshire, Great Glen in Leicestershire, and Clapham inBedfordshire. Although now under local authority control, these schemes were builtby the <strong>Highways</strong> <strong>Agency</strong> as part of the Targeted Programme of Investments (TPI),since renamed Major Schemes.1.3 The location of the scheme and its context in the road network is shown in Figure1.1. The scheme falls within Northamptonshire and is covered by <strong>Highways</strong><strong>Agency</strong> Area 8. However, following de-trunking, the former <strong>A6</strong> route is now theresponsibility of Northamptonshire County Council.Figure 1.1 - Location of <strong>A6</strong> Rushden to Higham Ferrers Bypass10
Scheme History1.4 Key dates associated with the <strong>A6</strong> Higham Ferrers scheme are listed below: Public consultation (April 1985); Public inquiry (March 1992); Decision to Proceed (March 1993); TPI Entry (July 1998); Construction Commenced (April 2002); Opening of Clapham Bypass (December 2002); <strong>A6</strong> Rushden to Higham Ferrers Bypass Opened (August 2003); <strong>A6</strong> Rothwell to Desborough Bypass Opened (August 2003); <strong>A6</strong> Traffic Impact Study (November 2003); and <strong>A6</strong> Rushen to Higham Ferrers One Year After (OYA) Study (June 2005).Scheme Details1.5 The scheme is 5.4 km in length, and was constructed entirely off-line, that is tosay, on a different route from the old <strong>A6</strong>. The Rushden section is 3.0 km long, andis single-carriageway. The Higham Ferrers section is 2.4 km long, and is dualcarriageway.1.6 The northern end of the bypass starts at the existing roundabout junction of the <strong>A6</strong>and the A45 (Chown Mll). The southern end terminates at a new roundabout onthe <strong>A6</strong>. There are three intermediate roundabouts, two of which are at junctionswith existing roads, and one at the junction with a new link road to Rushden(named John Clark Way). This was built by the county council and opened inFebruary 2005, following the completion of the bypass. The bypassed section ofthe old <strong>A6</strong> has been renumbered A5028. The layout of the scheme is shown inFigure 1.2.1.7 Near its northern end, the new dual carriageway has severed Stanwick Road. Theeastern part of Stanwick Road has been provided with a left in/ left out junctionwith the southbound carriageway of the bypass, and an overbridge allows nonmotorisedusers (NMUs) to cross to the western continuation.1.8 Further south, the single carriageway section has severed the access to HighHayden Farm from Rushden. The farm has been provided with a priority junctionwith the bypass, and about 300 metres north of this there is a non-motorised userover bridge.11
Figure 1.2 - Layout of <strong>A6</strong> Rushden <strong>–</strong> Higham Ferrers BypassProblems Prior to Scheme1.9 The problems in Rushden and Higham Ferrers prior to the scheme opening asdetailed in the Appraisal Summary Table (AST) result from the tortuous alignmentof the <strong>A6</strong> and the high volume of traffic. The problems can be summarised asfollows:Poor Safety <strong>–</strong> high numbers of accidents due to a lack of separation ofthrough traffic from pedestrians and local traffic;Poor Journey time reliability <strong>–</strong> due to high traffic volumes and one waysystem through Rushden ; andEnvironmental problems <strong>–</strong> Poor air quality due to congestion and throughtraffic in Rushden and Higham Ferrers. Problems associated with the integrityand residential amenity within the two towns.12
Scheme Objectives1.10 In order to alleviate the problems outlined above the scheme objectives were to:Reduce environmental problems in Rushden and Higham Ferrers;Relieve congestion;Improve journey reliability; andImprove safety.1.11 As part of a Five Year After evaluation (FYA), the success or otherwise of theseobjectives has been evaluated.Previous Post Opening Evaluation StudiesTraffic Impact Study1.12 A Traffic Impact Study (TIS) was produced in November 2003 which utilised‘Before’ and ‘After’ traffic data which was collected immediately prior to and afterscheme opening to monitor the effects of the new scheme on opening. The keyresults and trends emerging from this study are as follows:The new <strong>A6</strong> Rushden & Higham Ferrers Bypass carried about 9,270vpd (onan average weekday) in September 2003. In October the weekday daily trafficvolumes on the bypass were 9,680 vpd;This scheme was shown to be successful in reducing traffic volumes on thebypassed section. South of Rushden the volume reduced from 15,00 vpd to8,000 vpd. In Rushden the volume fell from 22,000 vpd to 18,000 vpd. North ofHigham Ferrers the volume fell from 21,000 vpd to 11,000 vpd. Trafficvolumes had also reduced on county roads around the scheme;The scheme had therefore been successful in removing vehicles fromRushden and Higham Ferrrers; andJourney time savings across the whole day were observed with significantsavings in the AM and PM peaks. Well over 5 minutes are being saved in thesouthbound direction in the peaks.One Year After Study1.13 Following the TIS a One-Year After report, dated June 2005 was produced. Keytrends emerging from this were as follows:The <strong>A6</strong> bypass immediately after opening carried on average 9,270 vpd. In theone year after opening period this traffic figure increased to 11,700 vpd, a 26%increase;The ‘old’ <strong>A6</strong> between Rushden and Higham Ferrers, for the periodimmediately before opening, carried 21,700 vpd. This reduced to 15,900immediately after opening and, one year after opening was carrying onaverage 18,100 vpd. This represents an overall reduction of 16.5%;The ratio of daily traffic to road capacity, known as route stress, on the ‘old’ <strong>A6</strong>through Rushden and Higham Ferrers had decreased from 85% to 63%. Thisreduction in traffic and congestion helps to explain an overall improvement inroute journey times;13
Based on a single year’s accident data, the opening of the bypass showedlittle impact on the overall accident rate along the route. The new road did,however, have a good accident rate, below the national average; andBoth the noise and air-quality ‘sub-criteria’ assessments contained in thescheme AST were shown to have been partially achieved through thereduction in through traffic observed in the towns of Rushden and HighamFerrers.The POPE Report1.14 The <strong>Highways</strong> <strong>Agency</strong> has a requirement to carry out post-opening evaluations ofits Major Schemes, to identify how far the predicted objectives and benefits havebeen achieved. This report represents the Five-Year After report for the <strong>A6</strong>Rushden <strong>–</strong> Higham Ferrers bypass, and is prepared under the Post-OpeningProject Evaluation (POPE) Commission. This follows an earlier Traffic ImpactStudy (Nov 2003) and One-Year After report (June 2005). Figure 1.3 presents thesequence of post opening reporting.Figure 1.3 <strong>–</strong> Sequence of Post Opening Reporting1.15 This FYA study is intended to evaluate whether the original objectives of thescheme have been achieved, and provides a comparison of the predicted schemeimpacts against those actually emerging five years after opening, when it isconsidered that the impacts of the scheme have settled down. The overall impactsof the scheme are assessed, where possible, against the core NATA (NewApproach to Appraisal) objectives of Economy, Safety, Environment, Integrationand Accessibility and are presented in the form of an Evaluation Summary Table(EST).1.16 In addition to measuring the out-turn impacts of the <strong>A6</strong> Rushden - Higham Ferrersimprovements, additional objectives of this report are to:Identify differences between predicted and out-turn impacts and economicforecasts;Where evidence is available provide explanations of these differences; andIdentify wider lessons and action based recommendations that can inform theenhancement and reliability of HA appraisal methods.14
Report Structure1.17 Following this introduction this report is structured as follows:Section 2 <strong>–</strong> Traffic Analysis. Provides a general discussion of outturnchanges in traffic flows on the new <strong>A6</strong>, former <strong>A6</strong> and other affected routesand makes a comparison with those originally forecast;Section 3 <strong>–</strong> Safety Analysis. Discusses changes in accident patterns andpersonal security as a result of the scheme. This analysis builds upon thefindings documented in the OYA study in 2005;Section 4 - Economy. An updated presentation of out-turn costs and benefitsis made and compared to those forecast in the scheme appraisal;Section 5 <strong>–</strong> Environment. Draws upon a detailed evaluation of the schemesenvironmental impacts and performance of mitigation measures described inthe scheme’s environmental statement;Section 6. Accessibility and Integration Impacts. Largely based upon asurvey of residents and desktop review, this section provides a review of howthe scheme has affected accessibility for all route users and complementslocal policies in the area; andSection 7. AST and EST. Presents a comparison of the forecast schemeimpacts (Appraisal Summary Table, AST) and highlights whether the out-turnimpacts have been better or worse than predicted in the form of an EvaluationSummary Table (EST); andSection 8. Conclusions summarises the main conclusions of the report.Summary of Data Sources1.18 The following sources were used in the preparation of this report::Permanent and temporary traffic count and accident data as provided byNorthamptonshire County Council;Temporary traffic surveys commissioned specifically for this study; <strong>Highways</strong> <strong>Agency</strong> traffic count data for the A45; Appraisal Summary Table (1998);COBA 11 input files (2001). It is understood these were converted fromCOBA9 files dating from 1992, which were not supplied for POPE; <strong>A6</strong> Rushden <strong>–</strong> Higham Ferrers Bypass Residents’ Survey (March 2009); The Environmental Statement (1991);Statutory environmental consultees (Natural England, English Heritage andthe Environment <strong>Agency</strong>); andSite visits by Atkins transport planners and environmental specialists.Residents Survey1.19 As part of the Five Year After study, a survey of local residents was undertaken toascertain public perception of the scheme’s impact on a number of issues relatingto quality of life, severance, accessibility, and the environment.15
1.20 A total of 3,000 questionnaire forms were delivered to a random selection ofhouseholds in the eight zones, illustrated in Figure 1.4. Overall, 476 completedforms were returned, giving a response rate of 16%. The return rate varied byzone, as shown in Table 1.1Figure 1.4 - Questionnaire Distribution Zones1.21 The results of the consultation are reported in a separate document: ‘<strong>A6</strong> Rushden<strong>–</strong> Higham Ferrers Residents’ Survey’. Some conclusions from that survey are alsogiven in the following chapters, where appropriate.Table 1.1 - Survey Forms Delivered and Returned per ZoneZone Forms Delivered Forms Returned Return Rate1 400 54 13.5%2 400 87 21.8%3 250 39 15.6%4 250 41 16.4%5 400 37 9.3%6 500 47 9.4%7 400 95 23.8%8 400 76 19.0%Total 3000 476 15.9%16
2. Traffic Data Collection and AnalysisIntroduction2.1 A comprehensive data collection exercise was undertaken for the OYA which hasbeen repeated for the purpose of preparing this FYA report. This section:Provides an overview of the traffic count and journey time informationcollected to inform this study;Summarises the observed impacts of the scheme on traffic flows and journeytimes on the <strong>A6</strong> corridor through Higham Ferrers and Rushden;Identifies and explains the main differences between predicted and out-turntraffic volumes; andTo summarise some of the public views on the scheme impacts as collectedas part of residents survey completed in March 2009.Data CollectionTraffic Count Information2.1 Counts have been obtained at the following stages: June 2003 <strong>–</strong> Prior to Scheme OpeningSeptember 2003 - Immediately after opening;October 2004 <strong>–</strong> 12 months after opening; andOctober 2009 <strong>–</strong> Five Years after opening.2.2 The following sources of data were used: <strong>Highways</strong> <strong>Agency</strong> counts from the TRADS database;A single Northamptonshire County Council permanent count site; andTemporary automatic counts undertaken for the purpose of this study.2.3 The count site locations are shown below in Figure 2.1,which illustrates the sourceand identification number.Journey Time Information2.4 Journey time surveys were carried out on routes that had been surveyed atprevious stages in the study. The routes are shown in different colours in Figure2.2. These are:<strong>A6</strong> Rushden <strong>–</strong> Higham Ferrers bypass (red);A5028 (former <strong>A6</strong>) through Rushden and Higham Ferrers (blue);A45, between A5001 and A14 (orange); andA45/ A5001, between A509 and <strong>A6</strong> (pink).17
Figure 2.1 - Count Site LocationsFigure 2.2 - Journey Time Routes18
2.5 The routes were surveyed in October 2008, with a minimum of six runs in eachdirection in each of the following time periods: AM peak (07:30 <strong>–</strong> 09:00);Inter-peak (10:00 <strong>–</strong> 15:00); and PM peak (16:30 <strong>–</strong> 18:00).Scheme Impact on Traffic Volumes <strong>–</strong> Five Years After Opening2.6 Traffic flows have been adjusted for seasonal variation, but not backgroundgrowth. For the purposes of the Five Years After study, traffic volumes have alsobeen compared on four links of the bypass. Average Weekday Traffic (AWT) flowsfor the period 2003 to 2008 are provided in Table 2.1 below, and are showngraphically in Figure 2.3.Table 2.1 <strong>–</strong> Traffic Volumes (AWT)Ref. No.LocationBeforeJun 0324-Hour AWTAfterSep 031 YrAfterOct 045 YrAfterOct 08% Change5 Yr AfterfromBefore2036/7 A45, SW of <strong>A6</strong> 30,800 31,200 32,200 32,600 6%2038/9 A45, NE of <strong>A6</strong> 20,300 20,100 20,700 21,300 5%1 A5028 (old <strong>A6</strong>), N of Meadowsweet Rd 15,100 9,000 7,900 7,500 -50%2 A5028 (old <strong>A6</strong>), N of John Clark Way 21,700 15,900 18,100 14,700 -32%3 A5028 (old <strong>A6</strong>), S of Stanwick Rd 20,700 12,400 11,300 10,300 -50%4 <strong>A6</strong> Station Rd, N of A45 21,900 21,800 21,300 20,300 -7%5 Stanwick Rd, S of Stanwick 7,500 6,800 6,600 -6 Avenue Rd, SE of Rushden 3,200 1,700 1,500 1,500 -54%7 B663, N of Chelveston 3,300 2,900 3,000 3,500 5%8 B645 Kimbolton Rd, W of <strong>A6</strong> Bypass 8,000 5,400 5,500 5,700 -28%9 Newton Rd, W of <strong>A6</strong> Bypass 3,400 4,500 5,500 4,400 29%10 A5001 Wellingborough Rd, W of Palm Rd 18,600 16,600 18,800 19,800 6%11 A5001 John Clark Way Not built No data No data 5,20012 <strong>A6</strong> Bypass, S of Newton Rd Not built No data No data 8,40013 <strong>A6</strong> Bypass, N of Newton Rd Not built No data No data 11,90014 (old HA2082/3)<strong>A6</strong> Bypass, S of B645 Not built 9,300 11,700 16,40015 <strong>A6</strong> Bypass, N of B645 Not built No data No data 14,20019
Figure 2.3 - ‘Before’ and ‘Five Year After’ Traffic Counts (AWT)2.7 It may be noted that in this interval, local growth in vehicle-kilometres driven inNorthamptonshire 1 has been 2.4%, and in England has been 5.4%. Any higherincreases observed in the Rushden <strong>–</strong> Higham Ferrers area must be due to localfactors. Screenlines can help to understand which increases are due to reassignmentbetween routes, and which are due to other factors. It is to beexpected that re-assignment will occur between routes crossing a screenline, butthe screenline totals will not be influenced by reassignment. Two screenlines areshown in Figures 2.1 and 2.3. Vehicle flows across these screenlines are tabulatedbelow.1 DfT Road Traffic Statistics for Local Authorities 1993-2007 (with extrapolation to 2008). Thesefigures show average annual growth of 2.8% between 1993 and 2002, but from 2003, the growth rateslowed, and between 2003 and 2008, the average annual growth rate was only 0.5%.20
Table 2.2 <strong>–</strong> Traffic Volumes (AWT) across ScreenlinesScreen-lineSiteRef.Location24-Hour AWTBefore 5 Yr AfterJun 03 Oct 08%Change11 A5028 (old <strong>A6</strong>) N of Meadowsweet Rd 15,100 7,500 -50%12 <strong>A6</strong> Bypass, S of Newton Rd - 8,400 -Total 15,100 16,000 +6%2036/7 A45, SW of <strong>A6</strong> 30,800 32,600 +6%2 3 A5028 (old <strong>A6</strong>), S of Stanwick Rd 20,700 10,300 -50%15 <strong>A6</strong> Bypass, N of <strong>A6</strong>45 - 14,200 -Total 51,500 57,100 +11%2.8 It may be noted that the increases are higher than background rates, suggestingthere has been reassignment due to the scheme.2.9 Key points to note from our analysis of traffic flow changes in the vicinity of thescheme are summarised as follows:The Bypass The new single-carriageway <strong>A6</strong> east of Rushden is carrying about 8,400 <strong>–</strong>11,900 vehicles per day (vpd), five years after opening. The new dual-carriageway <strong>A6</strong> east of Higham Ferrers is carrying about 14,200<strong>–</strong> 16,400 vpd, five years after opening;The Old <strong>A6</strong>Traffic on the old <strong>A6</strong> has been cut to 7,500 vpd (-50%) south of Rushden and10,300 vpd (-50%) north of Higham Ferrers. It has fallen 14,700 (-32%) in HighStreet, Rushden, immediately north of the town centre one-way system;The CorridorThe combined flow on the new and old <strong>A6</strong> south of Rushden (screenline 1) isnow 6% higher than the ‘Before’ flow on the old <strong>A6</strong> alone. This is about thesame as national background growth, however growth at the same level as forNorthamptonshire would be expected to have increased the flow from 15,100vpd to only 15,500 vpd. The observed flow is 16,000 vpd, so the extra 500 vpdis likely to have another cause, e.g. new development;The flow crossing screenline 2 has risen by 10%. Background growth at thesame level as for Northamptonshire would be expected to have increased theflow from 54,800 vpd to only 56,200 vpd. The observed flow is actually 60,500vpd, so the extra 4,300 vpd is likely to have another cause, e.g. newdevelopment .Other RoutesJohn Clark Way, the new link road between Rushden and the bypass, wascompleted in early 2005, eighteen months after the bypass opened, andcarries 5,200 vpd;21
Flow has also fallen from 8,000 vpd to 5,700 vpd (28%) on the B645Kimbolton Road (site 8). It is likely that this is an effect of the construction ofthe bypass rather than John Clark Way, because surveys before the openingof the latter also showed a fall;The flow on A5001 Wellingborough Road initially fell by 11%, possibly due toreassignment, but has since risen to 6% above the ‘Before’ level; Flows on the A45, both north and south of the scheme, have risen by 5-6%.This is higher than the Northamptonshire background growth, but is broadly inline with the national average;Flows on the <strong>A6</strong> north of the A45 have declined with each successivemeasurement. The flows were 21,900 in June 2003, 21,800 in September2003, 21,300 in October 2004, and 20,300 in October 2008. The overall dropin flow has been 7%. The reasons are unknown, but could be related to thedecline of the <strong>A6</strong> as a long-distance route, or local road-signing policy;Counts have fallen on minor roads near Stanwick (-12%) and NewtonBromswold (-54%). These falls were apparent immediately after and one yearafter opening, and so are likely to be an effect of the scheme; and For the site near Stanwick, the One-Year After count is given in Figure 2.2.This is because it has been discovered that the location described in previousreports was incorrect, and the count taken in 2008 at this supposed locationcould not be used.Comparison with Predictions2.10 A comparison of predicted and actual link flows is given in Table 2.3 below. Thepredicted flows are AADTs from the COBA files used in the economic assessmentof this scheme. They have been factored up to 2008, using factors within theCOBA files, and the figures shown are combinations of 60% low-growth predictionsand 40% high-growth predictions. The ‘actual’ flow are 7-day average trafficcounts, and in the ‘Before’ case, these have been factored up to 2008 levels basedon the growth in vehicle-kilometres travelled in Northamptonshire. Thus ‘Actual Do-Minimum’ represents the observed traffic before scheme opening, factored to2008.22
Table 2.3 <strong>–</strong> Predicted and Actual FlowsLinkWithoutschemePredicted Actual Actual / PredictedWithschemeWithoutschemeWithschemeWithoutschemeWithscheme1 A5028 (old <strong>A6</strong>), S of Rushden 8,500 7,400 14,400 7,100 68% -4%2 A5028 (old <strong>A6</strong>), N of Rushden 15,800 13,600 20,800 14,000 32% 3%3 A5028 (old <strong>A6</strong>), N of Higham Ferrers 12,600 5,200 19,800 9,900 58% 90%8 B645 Kimbolton Rd 6,000 4,100 7,300 5,100 22% 23%11 A5001 John Clark Way - 7,300 - 4,800 - -34%12 <strong>A6</strong> bypass, N of A5028 Bedford Rd - 1,500 - 7,800 - 418%13 <strong>A6</strong> bypass, S of John Clark Way - 2,400 - 11,000 - 355%14 <strong>A6</strong> bypass, N of John Clark Way - 8,200 - 15,100 - 85%15 <strong>A6</strong> bypass, S of A45 - 9,500 - 13,100 - 38%2036/7 A45, SW of <strong>A6</strong> 27,700 27,400 29,200 29,900 6% 9%2.11 The following may be noted:For all links, the predicted Do-Minimum flow was too low. The discrepancywas only 6% for the A45, but 32% to 69% on the old <strong>A6</strong>, and 23% forKimbolton Road;In the case of the Do-Something, the differences are extremely variable. Thepredicted flows on the old <strong>A6</strong> north and south of Rushden, are virtually thesame as actual flows, yet at the site north of Higham Ferrers, the predictionhas fallen short of actual flow by 90%;For the new bypass, the predictions were too low, especially at the southernend, where only 1,500 vpd were predicted, yet 7,800 vpd were observed, a418% under-prediction; andConversely, the traffic using John Clark Way has proved to be less thanpredicted (-34%).The COBA Forecasting2.12 No documentation to accompany the COBA files has been provided, which mighthave explained how the predicted flows were derived. The network was a detailedrepresentation of Rushden and Higham Ferrers, and has been reconstructed fromthe link and node data in the files, for the purpose of this study.2.13 The traffic base year was 1990. The COBA 11.4 files supplied were evidently reformattedfrom an earlier version, probably COBA 9. These files indicate a trafficgrowth from 1990 to 2008 of 26% in the low-growth case, and 34% high-growth.2.14 In reality, the average national growth in traffic in England has been 30%, virtuallyidentical to a COBA ‘central case‘. However, regional growth in Northamptonshirehas differed from the national average. Before 2003, it was higher than the nationalaverage, but since then it has slowed to below it. The actual Northamptonshire23
growth between 1990 and 2008 was 46%, well in excess of the growth predicted inthis COBA 11.4 forecast.2.15 If the predicted flows are changed to take into account the actual 46% growth forNorthamptonshire, then the figures in Table 2.3 become modified to those shownin Table 2.4 below. These show that considerable problems remain, in particularon the bypass south of John Clark Way. Therefore the low growth built into COBA11.4 is by no means the only reason for the mis-match between prediction andobservation.Table 2.4 <strong>–</strong> Predicted and Actual Flows, assuming Observed Regional GrowthLinkWithoutschemePredicted Actual Actual / PredictedWithschemeWithoutschemeWithschemeWithoutschemeWithschemeA5028 (old <strong>A6</strong>), N of Higham Ferrers 14,200 5,900 19,800 9,900 40% 69%A5028 (old <strong>A6</strong>), N of Rushden 17,800 15,400 20,800 14,000 17% -9%A5028 (old <strong>A6</strong>), S of Rushden 9,600 8,300 14,400 7,100 49% -14%A45, SW of <strong>A6</strong> 31,200 30,800 29,200 29,900 -6% -3%B645 Kimbolton Rd 6,700 4,700 7,300 5,100 9% 10%A5001 John Clark Way - 7,800 - 4,800 - -39%<strong>A6</strong> bypass, S of A45 - 10,700 - 13,100 - 23%<strong>A6</strong> bypass, N of John Clark Way - 9,200 - 15,100 - 64%<strong>A6</strong> bypass, S of John Clark Way - 2,700 - 11,000 - 304%<strong>A6</strong> bypass, N of A5028 Bedford Rd - 1,700 - 7,800 - 360%2.16 From Table 2.3, the predicted flow on the combined new and old <strong>A6</strong> at thenorthern end of the scheme was 14,700 vpd, of which 65% would use the bypass.In reality however, the combined flow is 23,300 vpd, of which 57% uses thebypass. The proportion using the bypass here is a little higher than predicted.2.17 At the southern end of the scheme, the predicted combined flow was 8,900 vpd, ofwhich 17% would use the bypass. In reality, the combined flow is 14,900 vpd, ofwhich 52% uses the bypass. The proportion using the bypass is therefore verymuch higher than predicted (although still only about half the total).2.18 At the middle of the scheme, just north of Rushden, the predicted combined flowwas 21,800 vpd, of which 38% would use the bypass. In reality the combined flowis 29,100, of which 52% uses the bypass. This proportion is substantially higherthan predicted.2.19 Thus in all three cases, the total combined flow has been higher than predicted,and the proportion using the bypass has been higher than predicted. Thediscrepancy is most serious in the south. Evidently the traffic model used toproduce flows for COBA was giving unrealistic results.2.20 It may also be noted that much of the new development has occurred in the south,that is the area where actual flows most exceed the predictions. Possibly this wasnot foreseen in the scheme forecasting. Developments include housing, industry,and retail, including a large ASDA store which opened in November 2006 (see24
Figure 2.4). Most sites gain access from major roads, i.e. from the A45, the <strong>A6</strong>, orJohn Clark Way.Figure 2.4 <strong>–</strong> Sites Developed Since Opening of <strong>A6</strong> BypassJourney Times2.21 The average times between all timing points are tabulated in Annex A, at the endof this report. The tables also show the average recorded delays. See Figure 2.2for route colours. It may be noted that:The <strong>A6</strong> route via the bypass (Red route) takes about 5 to 6 minutes, with verylittle variation between time periods;The route between the same end-points, but using the A5028 (old <strong>A6</strong> <strong>–</strong> BlueRoute), takes about 10 to 11 minutes, again with little variation between timeperiods;On the bypass (Red route), delays were recorded approaching theroundabouts at each end of the bypass, but not at any of the intermediateroundabouts. The average delays were all less than a minute; and25
On the A5028 (Blue route), delays were recorded at these roundabouts, aswell as at some intermediate points. Average delays exceeded 2 minutesapproaching the A45 roundabout at peak times, whereas they were under aminute when approached from the bypass.2.22 The following tables compare the whole route times with those recorded atprevious stages in the POPE study. Note however that times between timing points1 and 2 have been excluded from the totals of the Red and Blue routes, becauseof differences in the definition of timing point 1 in the various surveys.Table 2.5 <strong>–</strong> Comparison of Journey Times on <strong>A6</strong> Bypass, Red Route (min:sec)StageSouthboundNorthboundAM IP PM AM IP PMBefore - - - - - -Immediately After 05:49 05:51 06:05 05:47 06:34 06:051 Year After 04:58 04:25 04:46 05:58 04:31 04:575 Years After 05:06 04:58 05:06 05:24 05:22 05:442.23 Table 2.5 shows that there has been little variation in the 5 to 6 minute bypassjourney time, over the five years since opening.Table 2.6 <strong>–</strong> Comparison of Journey Times on A5028, Blue Route (min:sec)StageSouthboundNorthboundAM IP PM AM IP PMBefore 11:17 09:37 12:03 11:45 10:02 12:00Immediately After 09:39 09:37 09:25 12:34 09:25 09:571 Year After 07:33 07:22 07:51 07:17 06:09 06:595 Years After 09:28 09:33 09:33 10:55 09:41 11:022.24 Table 2.6 shows that on the A5028 (old <strong>A6</strong>), journey times ‘Before’ schemeopening were about 11 to 12 minutes during the peaks, but about 2 minutesshorter in the interpeak. ‘After’ opening, southbound journey times were lower, sothere was very little difference between peak and interpeak. Northbound, this alsohappened in the PM; however the AM peak time increased. One year after, shortertimes were recorded; however they have increased again five years after.Table 2.7 <strong>–</strong> Comparison of Journey Times on A5001/ A45, Pink Route (min:sec)StageSoutheastboundNorthwestboundAM IP PM AM IP PMBefore 15:03 14:13 18:00 12:13 10:50 12:04Immediately After 12:46 12:22 13:09 10:40 13:39 10:281 Year After 13:47 13:57 15:31 10:39 09:57 10:565 Years After 11:48 11:57 11:56 12:19 11:27 12:2826
2.25 Table 2.7 shows that in a south eastbound direction journey times have reduced 5years after scheme opening when compared to before opening. In the northwestbound direction journey times have remained relatively constant in the AM andPM peaks with the Inter Peak demonstrating an increase in Journey Time.Table 2.8 - Comparison of Times on A45, Orange Route (min:sec)StageSouthboundNorthboundAM IP PM AM IP PMBefore 08:02 07:04 07:01 08:15 07:15 07:30Immediately After 09:03 07:25 08:24 07:57 07:19 07:141 Year After 09:34 07:58 08:27 07:48 07:38 07;235 Years After 08:56 08:56 08:57 08:40 08:18 08:292.26 Table 2.8 shows that journey times in both directions have increased by about 1 - 2minutes since before opening. An examination of the changes in link and queuetimes shows that there has actually been a negligible increase in times on thejunction with the <strong>A6</strong>, and nearly all the increases are accounted for by longer timeson the A45 further north, toward the A14. The reasons for this are unclear.2.27 The time savings on both the new and old <strong>A6</strong>, compared with ‘Before’ times on theold <strong>A6</strong>, are shown in Tables 2.9 and 2.10.Table 2.9 - Time Saved using <strong>A6</strong> Bypass Compared with Old <strong>A6</strong> (min:sec)StageSouthboundNorthboundAM IP PM AM IP PMImmediately After 05:28 03:46 05:58 05:58 03:28 05:551 Year After 06:19 05:12 07:17 05:47 05:31 07:035 Years After 06:11 04:39 06:57 06:21 04:40 06:162.28 It is apparent from Table 2.9 that about 4 <strong>–</strong> 7 minutes are saved by using thebypass, compared with the ‘Before’ situation. The saving is larger at peak times,because previously the journey took about 2 minutes longer in the peaks, whereasnow the journey time is much the same in all time periods. There has been noerosion of the time saving over the five years since opening.Table 2.10 <strong>–</strong> Time Saved on Old <strong>A6</strong> After Opening of Bypass (min:sec)StageSouthboundNorthboundAM IP PM AM IP PMImmediately After 01:38 00:00 02:38 -00:49 00:37 02:031 Year After 03:44 02:15 04:12 04:28 03:53 05:015 Years After 01:49 00:04 02:30 00:50 00:21 00:582.29 There have also been small improvements to journey times on the old <strong>A6</strong> (Table2.10). This may be attributed to the removal of through traffic from the centres ofRushden and Higham Ferrers, and the consequent reduction in traffic volumes.27
However, the savings five years after are relatively small, about 1 or 2 minutes inthe peaks, but negligible during the inter-peak.Journey Time Comparison with Predictions2.30 The actual journey time savings may be compared with those predicted by twosources, the AST and COBA output. The origin of the AST figures is unknown. TheCOBA figures are ‘central case’ derived from 60% of the low growth figure and40% of the high growth. The observed values are the average of two directions.Table 2.9 <strong>–</strong> Predicted and Actual Journey Time Savings (Minutes)PredictedASTCOBAActualPeak 7.9 7.2 6.4Interpeak 8.0 5.2 4.72.31 It will be noted that the AST and COBA predictions are different, with the ASTshowing higher savings. The COBA figures are closer to observation. However, theactual time savings are lower than both sets of predictions.Public Perceptions2.32 In the public consultation, residents who had lived in the area for longer than fiveyears were asked how they thought congestion and speeding had changed sincethe opening of the bypass. The responses are shown in the following table.Table 2.10 <strong>–</strong> Public Consultation Responses on Congestion and SpeedingBetterWorseNeither /Don’t knowTraffic congestion on old 64% 10% 26%Speeding on old <strong>A6</strong> 35% 21% 44%2.33 For congestion, a clear majority of respondents (64%) believed there had been animprovement. For speeding, more respondents (35%) believed there had been animprovement than otherwise, but the majority did not give a definite answer eitherway.2.34 Respondents had the opportunity to add written comments. The majority of suchcomments related to the <strong>A6</strong>/ A45 roundabout (Chowns Mill). Some also mentionedthat the bypass was of little benefit to through traffic to or from the A45 west, whichcontinues to use the A5001, and is discouraged from using the bypass because ofconditions at Chowns Mill. A variety of opinions was expressed, a sample of whichis included below:“Overall a fantastic bypass allowing traffic to move around Higham ANDRushden without congestion.”“Significant improvement, ease of congestion has made it easier/quicker to getto both HF and Rushden.”28
“Essentially the bypass was a good idea but it is a pity it is not used more bytraffic not needing Rushden and Higham.”“There seems to be a lot of traffic still using the A5028 through Higham Ferrersat most of the day.”“HGV's still come through Rushden, as some sat-navs take you that way. Alsothey know it’s 2 miles less to Northampton 1 …...”“The use of bypass as a race track needs monitoring, usual times late atnight.”“Young motorists use it as a speedway.”“Why does the bypass go from dual carriageway to single?”“Initially the bypass took all the passing traffic away from the town centres,however the opening of the ASDA store in Rushden has since madecongestion in Rushden worse especially at weekends! The bypass doesappear to have been a waste of time and money.”Main Traffic ConclusionsThe average weekday traffic volume using the bypass ranges from 8,400 vpdsouth of Rushden, to 16,400 vpd east of Highham Ferrers. The actual flows onthe bypass are higher than predicted.The volume using the old <strong>A6</strong> has approximately halved to 7,500 vpd south ofRushden, and 10,300 vpd north of Higham Ferrers. In Rushden, immediatelynorth of the town centre, there has been a 32% reduction, and is now 14,700vpd. The actual flows on the old <strong>A6</strong> are similar to those predicted in Rushden,but higher than predicted north of Higham Ferrers.Average journey times on the bypass are about 5 minutes, in all time periods.This is approximately half the time taken to travel between the same pointsbefore the bypass opened. These actual journey time savings are slightly lessthan predicted.There have been small reductions in journey times on the old <strong>A6</strong>, in line withthe reductions in traffic flow.Public consultation responses were generally favourable with regard to trafficand journey times; however there were concerns over speeding on both thenew and old <strong>A6</strong>.1This refers to the fact that travelling between Northampton and the <strong>A6</strong> south, is shorter in distance via Rushden, than via thebypass.29
3. SafetyIntroduction3.1 This chapter evaluates the safety impacts of the scheme on the affected network,and gives a comparison with the predicted impacts. It also examines changes inthe number and severity of Personal Injury Accidents (PIAs) occurring on the <strong>A6</strong>and the old route through Rushden and Higham Ferrers.3.2 The chapter ends by quoting some of the comments made by respondents to thepublic consultation. These reveal a number of safety concerns, and possiblesolutions.Data Collection3.3 Records of PIAs were obtained from Northamptonshire County Council. Thesewere based on STATS19 records collected by the police attending the scenes ofaccidents, and have not necessarily been derived from the national validatedaccident statistics produced by DfT. As such, the data may subsequently be foundto be incomplete or contain inaccuracies. The requirement for up-to-dateinformation and site specific data was a consideration in the decision to use unvalidateddata and is sufficiently robust for use in this context.3.4 The records covered the period of five complete years before the start ofconstruction (April 1997 <strong>–</strong> March 2002), and five complete years after schemeopening (September 2003 <strong>–</strong> August 2008). The roads which are considered likelyto be affected by the scheme, and which form the study area, are highlighted inFigure 3.1.Figure 3.1 - Accident Study Area30
Impact of the Scheme on Safety3.5 The locations of accidents are shown in Figure 3.2 (Before) and Figure 3.3 (After).Accident points have been colour coded according to accident severity.Figure 3.2 <strong>–</strong> Accidents ‘Before’Figure 3.3 <strong>–</strong> Accidents ‘After’3.6 From Figure 3.2 and 3.3, is apparent that:The ‘Before’ accident sites were distributed along the length of the old <strong>A6</strong>, witha concentration in the centre of Rushden.The ‘After’ pattern is similar, with the great majority of accidents occurring onthe old <strong>A6</strong> and relatively few on the bypass (Figure 3.3); andThere have been no accidents in John Clark Way between Rushden and thebypass (but John Clark Way was only open for 3 1 / 2 years of the 5-year ‘After’period). The numbers and severities of accidents each year are shown in thefollowing Table 3.1.3.7 The numbers and severities of accidents each year are shown in the followingTable 3.1.31
Table 3.1 <strong>–</strong> Accidents Numbers and SeveritiesYearNumbers of AccidentsSlight Serious Fatal TotalBeforeAfter1997/98 30 8 1 391998/99 19 5 0 241999/00 28 7 2 372000/01 24 5 0 292001/02 26 5 2 33Total 127 30 5 1622003/04 22 6 0 282004/05 23 4 1 282005/06 22 5 0 272006/07 22 5 1 282007/08 34 8 0 42Total 123 28 2 1533.8 Table 3.1 shows that:There were 162 accidents in the five years Before, and 153 accidents in thefive years After; Thus 9 fewer accidents occurred in the After period, an average saving of 1.8per year, despite an increase in traffic volumes since bypass opening; andThere is considerable variation in the numbers from year to year <strong>–</strong> in the firstyear of the ‘Before’ period, and the last year of the ‘After’ period, numberswere much higher than in other years.3.9 At each accident there may be more than one casualty. The correspondinginformation for casualties is given in the following Table 3.2.32
Table 3.2 <strong>–</strong> Casualty Numbers and SeveritiesYearNumbers of AccidentsSlight Serious Fatal TotalBeforeAfter1997/98 36 13 1 501998/99 21 5 0 261999/00 35 10 2 472000/01 35 5 0 402001/02 33 6 2 41Total 160 39 5 2042003/04 36 6 0 422004/05 27 5 1 332005/06 29 6 0 352006/07 27 5 1 332007/08 44 8 0 52Total 163 30 2 1953.10 The key points from Table 3.2 are as follows: In the five years ‘Before’, there were 204 casualties, or an average of 1.26casualties per accident. In the five years ‘After’, there were 195 casualties, or an average of 1.27casualties per accident.There were 9 fewer casualties After, or a reduction of 1.8 per year (exactly thesame as the reduction in accidents), despite an increase in traffic volumesafter opening of the bypass.3.11 Information for the new and old <strong>A6</strong> only (excluding the accidents that occurred onother roads) is shown in Table 3.3 below. The column headed ‘Severity Index’shows the proportion of Serious+Fatal accidents to the total. The column headed‘PIA/ mvkm’ is the accident rate in terms of Personal Injury Accidents per MillionVehicle Kilometres. This is more informative than a simple comparison of accidentnumbers, because it takes into account the changing traffic levels. The finalcolumn shows national average rates for these road types.Table 3.3 <strong>–</strong> Accident Severities and RatesRouteAccidents over 5 YearsSlight Serious Fatal TotalSeverityIndexPIA/ mvkmActualNationalAverageBefore <strong>A6</strong> 113 24 4 141 0.199 0.757 0.844AfterOld <strong>A6</strong> 96 21 0 117 0.179 1.085 0.736New <strong>A6</strong> 10 4 1 15 0.333 0.129 0.202New+Old <strong>A6</strong> 106 25 1 132 0.197 0.59033
3.12 The following points may be noted from Table 3.3:Before the bypass opened, the severity index on the old <strong>A6</strong> was 0.199. On thesame road after the bypass opened, the severity index fell to 0.179, but on thebypass itself it had the higher value of 0.333.On the new and old <strong>A6</strong> combined, the ‘After’ severity index was 0.197, virtuallythe same as on the old <strong>A6</strong> ‘Before’.With regard to the accident rate in terms of PIA/mvkm, this was 0.757 on theold <strong>A6</strong> ‘Before’ the bypass.The rate rose to 1.085 PIA/mvkm on the old <strong>A6</strong> ‘After’ bypass opening,reflecting the decrease in traffic flow.The national average is shown to be lower on the old <strong>A6</strong> ‘After’ than ‘Before’,even though it refers to the same road. This is because national rates arefalling with time.The accident rate on the bypass itself was 0.129 PIA/mvkm, and this is lowerthan the national average for modern all-purpose roads of both single- anddual-carriageway standard.Significance of the Change in Accidents3.13 To assess the significance of changes in accident rates following an improvement,it is common practice to use the chi-squared test. This checks whether the changein accident numbers in conjunction with changes in vehicle-kilometres travelled ona network is likely to be a real change due to the improvement, rather than randomfluctuation due to chance.Table 3.4 <strong>–</strong> Accident Rate Significance TestTotal Accidents 'Before' a 162Total Accidents 'After' b 153Total Accidents 'Before'+ 'After' c=a+b 315Total million Vehicle-km 'Before' d 200.7Total million Vehicle-km 'After' e 248.6Total million Vehicle-km 'Before' + 'After' f=d+e 449.4Expected Accidents 'Before' g=c*d/f 140.7Expected Accidents 'After' h=c*e/f 174.3Chi Squared Test'Before' i=(a-g)^2/g 3.22'After' j=(b-h)^2/h 2.60Sum k=i+j 5.82Critical Value for 95% confidence(Number of Degrees of Freedom = 1, p=0.05)3.8434
3.14 As shown in Table 3.4, the result of the chi-squared test is 5.82 which is greaterthan the critical value of 3.84 for the 95% confidence level. Thus it can beconcluded that the change in accident rate may be due to the scheme, rather thanchance alone.Comparison with Predictions3.15 The actual accident saving may be compared with that predicted in the COBAassessment. This is shown in the table below. Note the predicted saving is for thelinks constituting the study area, weighted in the proportion 60% low-growth and40% high growth.Table 3.5 <strong>–</strong> Predicted and Actual Accident SavingCOBAPredictionActualDo Minimum 35.9 32.4Do Something 32.7 30.6Saving 3.2 1.83.16 The actual number of accidents was slightly less than predicted both ‘Before’ and‘After’, and the actual difference is also less than predicted. COBA predicted that3.2 would be saved per year, whereas actually 1.8 were saved. The actual savingis about 44% less than predicted.Accident Causation Analysis3.17 The accidents are broken down into various categories as illustrated in Table 3.2.Unfortunately, the accident records supplied had no descriptions attached untilOctober 2000, therefore it was only possible to analyse accident type for one-anda-halfyears ‘Before’, compared with the full five years ‘After’.35
Table 3.6 <strong>–</strong> Summary of Accidents by CausationCategory of AccidentAccidents PerYearProportion of TotalBefore After Before AfterCollision of unopposing vehicles, betweenjunctions 4.7 5.8 16% 18%Collision of opposing vehicles at junction oraccess4.7 5.6 16% 18%Collision of pedestrian and vehicle 8.7 5.0 30% 16%Collision of unopposing vehicles at junctionor accessCollision of opposing vehicles, betweenjunctions5.3 4.8 18% 15%0.7 3.8 2% 12%Single vehicle loss of control 2.0 3.6 7% 11%Collision on roundabout 2.0 2.2 7% 7%Collision of cyclist and vehicle 0.7 0.8 2% 3%Other 0.7 0.2 2% 1%3.18 In Table 3.6, the ‘opposed vehicle’ categories include head-on collisions (betweenjunctions) and right-turn collisions (at junctions). The ‘unopposed vehicle’categories include shunts and lane-change collisions.3.19 It will be noted that ‘Before’ bypass opening, 30% of accidents involvedpedestrians. This reflects the nature of the old <strong>A6</strong> <strong>–</strong> an urban route passingthrough two town centres. This proportion has fallen to 16% ‘After’ the opening ofthe bypass. Some other kinds of accident have increased in relative frequency,notably opposed (head-on) vehicle collisions.Table 3.7 <strong>–</strong> Accident Types on New <strong>A6</strong> BypassAccident Type Number Fatal / SeriousSingle vehicle loss of control 5 3Collision on roundabout 5 1Shunt approaching roundabout 2 0Collision changing lane 1 0Head-on collision 1 0Collision of pedestrian and vehicle 1 1Total 15 53.20 It was shown earlier (Table 3.3) that 15 accidents had occurred on the bypass inthe five years since opening. While this is not a high figure in itself, it does includea high proportion of serious and fatal accidents. Table 3.7 breaks these down into36
6 categories. It shows that the largest categories were single-vehicle accidents,and collisions at roundabouts, together accounting for two thirds of the total.3.21 In March 2007, a petition to Parliament urged for improvements to be made to theA45/ <strong>A6</strong> (Chowns Mill) roundabout. This was a result of perceived safety problemssince the addition of the <strong>A6</strong> bypass as a new arm to the junction.Table 3.8 <strong>–</strong> Accidents within 150 metres of A45/ <strong>A6</strong> JunctionPeriod Slight Serious Fatal TotalBefore (5 Yrs) 14 2 0 16After (5 Yrs) 20 1 0 213.22 Table 3.8 shows the actual number of accidents occurring in the ‘Before’ and ‘After’periods, within a radius of 150 metres of the centre-point of the A45/ <strong>A6</strong>roundabout. This does indeed confirm that accidents at the junction have becomemore frequent, increasing from 3.2 per year to 4.2 per year.Public Perception of Safety Impact3.23 As part of the public consultation, residents who had lived in the area longer thanfive years were asked: ‘Has safety for road users and pedestrians improved sincethe bypass opened?’3.24 Responses were as follows: Agree 62% Disagree 17% Neither/ Don’t know 21%3.25 The responses to this standard question clearly indicate a perception amongst themajority of respondents that safety in general has improved. Nevertheless, theadditional comments of those respondents who took the trouble to make them,were overwhelmingly unfavourable. The most common safety concerns were thefollowing:Lane markings at the A45/ <strong>A6</strong> Chowns Mill roundabout;The danger to pedestrians and cyclists at the A45/ <strong>A6</strong> Chowns Millroundabout;Speeding traffic on the bypass;The change in road standard from dual to single carriageway; andPoor drainage, with standing water and ice in winter.3.26 It appears that the perceived danger of the A45/ <strong>A6</strong> Chowns Mill roundabout isencouraging drivers to take inappropriate routes in order to avoid it. Remediessuggested by the respondents included the following:37
Changes to lane-marking, and in increase in the number of lanes at theapproach from <strong>A6</strong> north;Traffic signals, or part-time signals, or pedestrian signals;An overpass for the A45; and A pedestrian/ cycle bridge crossing the A45.3.27 The following is a selection of comments concerning safety. Suggestedimprovements are shown in bold.“Overall I think the bypass was a good idea. However…….. the roundabout at theA45/<strong>A6</strong> is now a complete nightmare. At peak times it is horrendous trying to geton to it. Traffic lights at this roundabout would be a much safer option. At presentit feels like you have solved one problem in one area only to create another furtherdown the road.”“The impact on the Chowns Mill roundabout has been serious and not yet resolveddespite frequent requests over the last five years. The junctions are too close toeach other and have markings either wrong or misleading i.e. the <strong>A6</strong> approachfrom the north (Kettering) needs three (not two) marked lanes (Peterboroughbypass/Higham Ferrers/A45 WEST Wellingborough) as it comes to Chowns Millroundabout. The A45 (from east Peterborough) approach to Chowns Millroundabout has three lanes but the left hand one (for the bypass) is barely usedand should be allowed for A5028 traffic.”“I believe the effectiveness of the bypass is reduced by the junction at its northernend with the A45. The roundabout is responsible for many delays and queues, andputs folk off using the bypass to access the A45 towards Northampton. A solutionwould be to put the A45 on a flyover taking the through east-west traffic awayfrom the roundabout ….. ”“The bypass has most had an impact on the Chowns Mill roundabout where itmeets the A45. It is difficult to get out from the old <strong>A6</strong> on both sides with the speedtraffic crosses. It also makes it very dangerous for cyclists and pedestrians to crossfrom Higham Ferrers towards Itlingborough and back. This is where a footbridgeshould be.”“The roundabout at Chowns Mill is shocking to cross for pedestrians and cyclists.Many of whom go that way to the lakes. A nightmare for people with children.”“The bypass is very dangerous with cars who think they are on a race track. Overtaking is really bad. Only a few cars take notice of the speed limits, I would like tosee a solid white line on the single lanes and of course a speed camera.”“Calming measures to stop <strong>A6</strong> bypass being used as race track. Part-time trafficlights at main roundabout.”“The single carriageway section ….. standing water on the carriageway in wetweather ….. This causes a hazard for obvious reasons and is particularlydangerous during icy weather as the amount of ice overwhelms the effect of anygritting operations carried out.”“Drainage problem has still not properly been sorted, every winter, water now runsacross <strong>A6</strong> road and freezes causing a hazard, this needs sorting please.”38
“….. there has been an ongoing subsidence problem on the northerly section, halfway along the approach to the <strong>A6</strong>/A45 roundabout. Can this be resolved pleasebefore someone has an accident. Cars bounce over this dip.”Main Safety ConclusionsIn a study area comprising the roads where a change in accident numberswould be expected, the number of PIAs fell from 162 in a five-year period to153. Casualty numbers fell from 204 to 195;The accident rate on the old <strong>A6</strong> was 0.757 pia/mvkm, and on the same road,has increased to 1.085 after the bypass opened. This is now above thenational average for this type of road. The rate on the new bypass is 0.129pia/mvkm, less than the national averages for modern single- or dualcarriageways;The reduction in accidents is statistically significant, but is less than predictedin the COBA appraisals;In the study area, there has been an increase in the proportion of singlevehicle accidents and in head-on collisions away from junctions. Howeverthere has been a decrease in the proportion of collisions with pedestrians;On the new <strong>A6</strong> bypass, there have been 15 accidents in the first five years,and the severity index has been 0.333. The majority have been opposedvehicle collisions, away from junctions, and single vehicle accidents; andPublic consultation indicates a perception that the scheme has improvedsafety overall, but comments reveal concerns with the A45/ <strong>A6</strong> Chowns Millroundabout, speeding on the bypass, and dangers from subsidence and poordrainage.39
4. EconomyIntroduction4.1 This chapter first reports the actual cost of the scheme, and compares this with theforecast cost. In addition an evaluation of the actual monetary benefit isundertaken as follows:A comparison is made of the actual time and accident savings on key linkswith COBA forecasts of savings on these same links;The COBA predicted 30-year benefit is then adjusted by the same proportionto give the actual monetary benefit;This benefit is compared to actual costs to determine the scheme value formoney, presented as the Benefit/Cost Ratio (BCR).4.2 A schematic representation of the stages of the POPE methodology is included inFigure 4.1.The chapter concludes by evaluating journey time reliability andregeneration.Adjustment FactorActual / PredictedFigure 4.1 - Schematic representation of the stages of the POPEmethodologyOutturn Cost4.3 The cost of the scheme was £16.2 million, as notified by the <strong>Highways</strong> <strong>Agency</strong> inAugust 2008. This figure includes works, land, preparation, and supervision. Mostof this was spent between the years 2000 and 2003, with small items ofexpenditure continuing until 2008.40
4.4 The figures supplied by the <strong>Highways</strong> <strong>Agency</strong> have been converted to 2002 prices,and discounted to 2002. However, there is virtually no difference between thisresulting discounted cost, and the sum of the costs as spent, because the 2002present value year is within the construction period.4.5 POPE is required to compare this outturn cost with the predicted cost. The COBAfiles supplied by the <strong>Highways</strong> <strong>Agency</strong> do not include construction costs, and theeconomic forecasting report is not available to POPE. Therefore the predicted costhas been obtained from the Appraisal Summary Table (AST), converted to 2002prices and discounted to 2002, giving a figure of £10.6 million.Table 4.1 <strong>–</strong> Scheme Cost (2002 Prices & Values)Cost (£million)Predicted 10.6Outturn 16.24.6 The predicted and actual costs are presented in Table 4.1. They are discountedvalues, although in this case there is negligible difference between these and theundiscounted values. The outturn has exceeded the predicted cost by 53%.Monetary Benefit4.7 The monetary benefit of the scheme has been evaluated as follows. Fromobserved data, it is possible to re-evaluate the two most important components ofeconomic benefit, namely:Vehicle-time savings; andAccident Savings4.8 Annual vehicle-hours have been measured from traffic count and journey timesurveys on key links in the network, in both the ‘Before’ and ‘After’ situations. Theactual ‘Before’ traffic flows have been factored to October 2008, the same date asthe ‘Five Year After’ counts. The vehicle-time is calculated from the product ofvolume multiplied by journey time. The value for the ‘After’ case is subtracted fromthe ‘Before’ value to derive the saving.4.9 The COBA 11.4 files used by the <strong>Highways</strong> <strong>Agency</strong> have been run for 2008 inorder calculate the predicted vehicle-hour savings on the same links as for thoseobserved. From this, it is possible to derive the observed:predicted ratio of vehiclehoursavings. This ratio is applied to the predicted 30-year 1 monetary benefit oftime savings, to give a new re-forecast of the time benefit, based on observed data(this may be referred to as the ‘actual’ benefit for brevity).4.10 At the time the forecasts were made, it was customary to run COBA separately forlow-growth and high-growth scenarios. A central-case prediction was based on60% of the low-growth results and 40% of the high growth results. In this report,where COBA results are quoted, they are central-case values derived in this way.1 Note that there was a 30-year evaluation period for this scheme, in accordance with normal practice at the timeof appraisal, and not a 60-year period as is customary for schemes evaluated now.41
4.11 This re-forecast benefit is relative to the same 1998 base year as used in COBA.However, it is necessary to convert it to 2002 values, to permit comparison withresults from other schemes evaluated under POPE.4.12 To achieve this conversion, the predicted benefits from COBA are ‘undiscounted’,separately for each year. The undiscounted benefits are converted to 2002 pricesusing the RPI, and then re-discounted to 2002 at 3.5% p.a.. The separate annualbenefits are then summed. The resulting predicted benefit at 2002 base is found tobe 23% higher than at 1998 base. Therefore the ‘observed’ 1998 benefit isincreased by this amount to derive a corresponding 2002 value.4.13 Monetised accident benefits are treated in exactly the same way, with the ratio ofobserved: predicted accident savings being used to adjust the predicted 30-yearaccident benefit.Predicted BenefitsRe-evaluated Time Benefit4.14 The COBA prediction was that 79,981 vehicle-hours would be saved in 2008, onthe key links where observed information is available, whereas the actual saving is133,287 vehicle-hours. This is 66% higher than the predicted value. The reason forthis is that although the actual time savings per vehicle are a little lower thanpredicted, there are many more vehicles on the network than predicted, which arebenefiting from the savings. In particular, traffic flows were under-predicted in thesouthern part of the network.4.15 The 30-year monetary benefit corresponding to the predicted time saving was£17.6 million. Scaling this up by 66% gives an ‘actual’ monetary benefit of £29.3million.Table 4.2 <strong>–</strong> Time Saving and Monetary BenefitVehicle Hourssaved in 2008Benefit over 30 yrs (£m)1998 Base 2002 BaseCOBA 79,981 17.6 21.7Actual 133,287 29.3 36.34.16 Converting this benefit from a 1998 present-value year to 2002, using theprocedure described above, results in a value of £36.3 million. The time benefit isshown in Table 4.2.Re-evaluated Accident Benefit4.17 The COBA prediction was that 3.2 accidents would be saved per year, whereasthe actual saving is 1.8 accidents, which is 56% of the predicted value. The 30-year monetary benefit corresponding to the predicted time saving was £4.9 million.Scaling this down by 56% gives an ‘actual’ monetary benefit of £2.8 million.42
Table 4.3 <strong>–</strong> Accidents Saving and Monetary BenefitAccidentsSaved 2008Benefit over 30 yrs (£m)1998 Base 2002 BaseCOBA 3.2 4.9 6.1Actual 1.8 2.8 3.44.18 Converting this benefit from a 1998 present-value year to 2002, using theprocedure described above, results in a value of £3.4 million. The accident benefitis shown in Table 4.3.Value for Money4.19 The following table summarises the results described in this chapter. Note that thebenefits are those from COBA, not the AST. It shows that the outturn cost hasexceeded predicted cost by £5.7 million. The combined time and accident benefitsexceed predictions by £11.0 million.Table 4.5 <strong>–</strong> Scheme Costs and Benefits (2002 Prices & Values)Benefit-Time- Accident- TotalPredicted Actual Difference£21.7m £36.3m £14.5m£6.1m £3.4m -£2.6m£27.8m £39.7 £11.9mCost £10.6m £16.2m £5.7mBenefit/ Cost Ratio 2.6 2.44.20 The re-evaluated benefit/ cost ratio (BCR) is 2.4, compared with 2.6 based onpredicted values. Although both costs and benefits have exceeded predictions, thecost increase has been proportionally greater. Nevertheless, the scheme stillproduces a good economic return.Reliability4.21 Reliability cannot be measured directly, but the quantifiable Route Stress may beused as an indication. This is essentially a measure of the ratio of volume:capacity,and values between 75% and 125% are considered to be related to Reliability. TheAST gave predicted values of 85% ‘Before’ and 23% ‘After’.Table 4.6 <strong>–</strong> Route Stress ValuesPredictedActualBefore 85 75After (Bypass N)2321After (Bypass S)484.22 A calculation based on observed traffic data gives values of 75% ‘Before’, and 21%‘After’ on the northern section of the bypass, and 48% ‘After’ on the southern43
section. These values are shown in Table 4.6. There has been a substantial fall, aspredicted, although the actual figures are not identical to those in the AST.4.23 The northern and southern parts of the bypass have been treated separately in theevaluation, because they are built to different standards. The northern section isdual carriageway, and has the low stress value of 21% (similar to the predictedvalue). The southern section is single carriageway, and has the higher value of48%. However, this is still below the 75% level at which it would have an effect onReliability.Regeneration4.24 The AST stated that the scheme does not serve a regeneration priority area, andgave no indication that promoting regeneration was a scheme objective.4.25 Despite not being in a designated regeneration priority area, considerabledevelopment has taken place in Rushden and Highham Ferrers concurrently withthe provision of the <strong>A6</strong> bypass and A5001 John Clark Way. This has mainly beennew housing. It may be argued that with the increase in the capacity of thetransport system, the populations of these towns have been enabled to grow.4.26 The fact that only about half the traffic has transferred from the old <strong>A6</strong> to the newbypass, suggests that businesses in the town centres would not suffer from loss ofpassing trade. Indeed the opening of an ASDA store in Rushden has attracted newtraffic .Public Perceptions on Economy4.27 The questionnaire did not aim to discover the public’s views on most economicmatters. However one question partly relating to Regeneration was: ‘Do you thinkthe new development completed since the bypass opened has been good for thearea?’4.28 Responses were as follows: Agree 48% Disagree 29% Neither/ Don’t know 23%4.29 Thus, of those with a definite opinion, more people took a positive view of postbypassdevelopment than otherwise. Nevertheless, many of the additionalcomments revealed contradictory views. The following is a selection.“I live in a new house just off John Clark Way and this development is adding avery desirable residential area to Rushden.”“My family now live in the new housing development. It has a good school and thedoctors surgery has improved due to the increase of population.”“It has brought some work and living accommodation to the area. Very good.”44
“Too many houses, not enough school places/doctors/dentists etc. Too many largestorage/warehouse developments bringing more traffic/noise and pollution to area.”“More people and more houses. Less community spirit. New neighbours don't talkto locals.”“20 years ago we had a thriving shoe industry, now it’s gone. I see little evidence ofnew industry since the bypass opened. Most of the new housing was bought bypeople who work elsewhere.”“Rushden doesn't need any new housing developments, we haven't got thefacilities to accommodate a higher population i.e. dentists, doctors, schools,parking, police. Rushden has far more youth incidents than in previous years.”4.30 Clearly there are differing views on the new developments in the area, and thesewill be disseminated to the relevant organisations, where appropriate.Main Economy ConclusionsThe outturn scheme cost is £16.2 million, about 53% higher than predicted;The vehicle-time benefit is £36.3 million, about 60% higher than predicted;The accident saving is £3.4 million, about 44% lower than predicted;The BCR is 2.4, showing that the scheme gives a good economic return, albeitlower than predicted in relation to cost;Reliability, as measured by Route Stress, has improved; andRegeneration was not a stated scheme objective, however it is clear thatsignificant new development has occurred since the scheme has opened.Public perception of the new development following the bypass has beenvaried, with concerns about absence of integration with the existingcommunity, and lack of facilities.45
5. Environmental Impacts5.1 This chapter summarises the environmental evaluation, which is given in full inAnnex B at the end of this report. It sets out for each environmental sub-objective,the predicted impacts, what has been implemented, and our evaluation. Thepredicted impacts have been derived from the Environmental Statement (ES) andthe Appraisal Summary Table (AST).Noise5.2 The ES and AST both predicted the scheme to have an adverse impact on theNoise sub-objective. The evaluation of the Noise sub-objective is related to thepredicted traffic flow rate compared to the observed traffic flow rate. As discussedin chapter 3, the <strong>A6</strong> is experiencing traffic flows that are much higher thanpredicted in the original ES on the southern section and comparable on thenorthern section. No new noise monitoring or modelling was conducted as part ofthis assessment.5.3 The mitigation in form of noise barriers and noise mounds has been constructed asproposed in the ES. In addition to these the scheme also included a low noisesurface that was not included in the ES calculations. The effect of the scheme onnoise levels and noise nuisance overall is likely to be as expected in the ES basedon the higher traffic flows than predicted on the southern section being offset byreductions in noise due to the low noise surface.5.4 The ES noted that insulating windows against the effects of noise from traffic onthe bypass was an option but indicated that earth mounding would be moreeffective to a wider range of properties. Subsequent to the ES the position onmitigation was amended and 15 properties were insulated against noise.5.5 There have been 2028 Part I claims submitted for the scheme so far. Of these1223 have resulted in nil compensation being paid with 712 claimants receivingcompensation and 93 claims have been rejected as invalid. It is possible that morewill be submitted before the period for claims expires.5.6 The predicted effects and evaluation of the noise sub-objective is summarised inTable 5.1.Table 5.1 - Predicted Effects and Evaluation of the Noise sub-objectiveOrigin ofAssessmentASTESTSummary of Predicted EffectRemoval of traffic to new route benefits propertieson existing road but has adverse effects on others(about 70 properties experience smaller increasesor decrease in noise level and 50 propertiesexperience increase in noise.Effect of higher than predicted traffic flows is offsetby the use of low noise surfacingAssessmentAdverseOverall asexpected46
Air Quality5.7 The AST predicted that the scheme would have a beneficial effect on air qualitywhilst the ES predicted that the scheme would also have a positive effect on airquality.5.8 The scheme is likely to have had a positive effect on air quality due to a reductionin traffic congestion and an increase in average vehicle speed. Despite the trafficflows being higher than predicted in the ES for some parts of the network the effectis considered to be likely to be as expected in the ES. This is due to improvementsin vehicle technology since the ES was published. To verify this it would benecessary to carry out air quality monitoring which is outside the scope of thisevaluation.5.9 The predicted effects and evaluation of the air quality objective are summarised inTable 5.2.Table 5.2 - Predicted Effects and Evaluation of the Air Quality sub-objectiveOrigin ofAssessmentASTESSummary of Predicted EffectConsiderable improvement due to traffic being removed fromcentre of towns. 520 properties experiencing improved airquality and 25 experiencing worse air quality. PM 10 reduced by239 and NO 2 reduced by 1471Effect of higher than predicted traffic flows is offset by theimprovements in vehicle technologyAssessmentBeneficialOverall asexpectedGreenhouse Gases5.10 The greenhouse gas emission is measured in terms of tonnes of carbon, and iscalculated using COBA 11.7. This is done firstly with the original data, andsecondly with actual traffic flows. The changes in carbon emission in 2008, givenby this method, are shown in the following table.Table 5.3 <strong>–</strong> Annual Carbon EmissionTonnes of Carbon in 2008PredictedActualDo Minimum 5959 6965Do Something 6007 6887Difference +48 -785.11 The changes in both cases are very small, but with predicted data show anincrease of 48 tonnes, and with actual data show a decrease of 78 tonnes, despitethere being more traffic. This is believed to be due to the reduction in congestion,and an increase in speeds within the range where emissions decrease withincreasing speed.47
Landscape5.12 The AST predicted the scheme to have a neutral effect on the Landscape sub-objectivebut the ES did not give an overall assessment of effect. The AST would appear to haveunderestimated the effect of the bypass, as the effect of such a scheme on the landscapeis considered to be adverse.5.13 In general the proposed improvements and mitigation have been carried out as proposedin the ES. The very outline nature of the description of the mitigation in the ES makes ameaningful comparison difficult. In some areas, notably the inclusion of further screenmounding towards the southern end of the scheme the mitigation is more extensive thanproposed in the ES. There is a continuing problem with noxious weed infestation whichhasn’t been eradicated during the maintenance period. Overall the landscape proposalshave been successful with only limited areas of plant failures notably at the footpathcrossing to Rushden which has been subject to ongoing vandalism and plant theft.5.14 The predicted effects and the evaluation of the landscape sub-objective is summarised inTable 5.4.Table 5. 4 <strong>–</strong> Predicted Effects and Evaluation of the Landscape Sub-objectiveOrigin ofAssessmentSummary of Predicted EffectAssessmentAST No significant impact NeutralESTIn general the improvements and mitigation have been carriedout as proposed in the ESWorse thanexpectedBiodiversity5.15 The AST predicted the scheme to have a neutral effect on the Biodiversity sub-objectivewhilst the ES made no prediction.5.16 In general the effect of the scheme on the biodiversity has been as expected in the ESwith the mitigation measures described having been implemented. A number of ecologicalsurveys were carried out after the ES was published which lead to additional mitigationmeasures being proposed5.17 Additional mitigation in the form of an artificial badger sett and tunnel under the bypasshave been created, in a response to finding a badger sett close to the line of the routeafter the ES was published. No formal evaluation has been carried out but discussionswith the badger sub consultant suggest that the sett is used but the tunnel is subject toperiodic flooding. Badger netting is also included in the northern section of the route wherebadger activity was recorded.5.18 The effect of the scheme on bat, otters, water voles and great crested newts was notconsidered in the ES as these species were not present.5.19 Table B. contains the effects predicted in the ES on the Biodiversity sub-objective, theproposed mitigation measures and an evaluation of the effect one year after the schemeopened.48
Table 5.5 - Predicted Effects and the Evaluation of the Biodiversity Sub-objectiveOrigin ofAssessmentSummary of Predicted EffectAssessmentAST No significant direct effect NeutralESTIn general the effect of the scheme on the Biodiversity subobjectivehas been as expected in the ES. Mitigation forbadgers that was not included in the ES was implemented aspart of the schemeAs expectedHeritage5.20 The AST predicted that the scheme would have a large positive effect on the Heritagesub objective whilst the ES made no predictions for heritage overall but did comment thatthere would be significant relief for the Higham Ferrers Conservation AreaFigure 5.1 <strong>–</strong> Higham Ferrers Conservation Area5.21 Overall the effects of the scheme on the Heritage sub-objective are considered to be asexpected in the ES.5.22 After the ES was published further archaeological information was discovered and twosites were investigated. These revealed interesting information on the heritage of thearea which was not known at the time of the ES. These two sites appear to have beeninvestigated satisfactorily.49
5.23 Table 5.5 contains the effects predicted in the ES on the Heritage sub-objective, theproposed mitigation measures and an evaluation of the effect five years after the schemeopened.Table 5.6 - Predicted Effects and the Evaluation of the Heritage Sub-objectiveOrigin ofAssessmentASTESTSummary of Predicted EffectSubstantial benefits for integrity and context of two townsConservation Area, including numerous listed buildingsOverall the effects of the scheme on the Heritage subobjectiveare considered to be as expected in the ES.Archaeological assets that were identified after the ES waspublished have been investigated satisfactorilyAssessmentLargePositiveEffectAs expectedWater5.24 The AST predicted the scheme to have moderate negative effect on the Water subobjective.The ES made no reference to drainage proposals except as part of theecological mitigation.5.25 The drainage features were visited during the site visit and a visual appraisal indicatedthat they were performing satisfactorily.5.26 Table 5.7 contains the effects predicted in the ES on the Water sub-objective, theproposed mitigation measures and an evaluation of the effect five years after the schemeopened.TableB.13 <strong>–</strong> Summary of predicted effects on the Water sub-objectiveOrigin ofAssessmentASTESTSummary of Predicted EffectEven with mitigation, there may still be a significant risk ofpolluting very sensitive ground water during both constructionand operation and an impact on local drainageWater quality has been dealt with in accordance with the ESand the affect on water quality is as expected in the ESAssessmentModeratenegativeAs expectedPhysical Fitness and Journey Ambience5.27 Neither the AST or ES made reference to Physical Fitness or Journey Ambience, andthey are not defined as scheme objectives.5.28 It was noted that two footbridges were built as part of the scheme which were notdescribed in the ES and these would have improved the conditions for non motorisedusers crossing the bypass. There are two other at grade crossings on the route.50
5.29 In the next chapter, there is a summary of consultation responses to questions relating toAccessibility, and some of these are also relevant to Physical Fitness. More respondentsagreed than disagreed that crossing roads and cycling had improved. However, only aminority said they used footpaths or bridleways near the bypass.5.30 Journey ambience will be better for drivers using the bypass than those on the old <strong>A6</strong>,due to the reduction in congestion. A layby has been provided in each direction on thenorthern section of the bypass.Main Environment ConclusionsThe effect of the scheme on the Noise sub-objective is considered to beas expected in the ES as a result of higher traffic flows being offset by theuse of a low noise surface;The effect of the scheme on the Air Quality sub-objective is considered tobe as expected in the ES as a result of higher traffic flows being off set byimprovements in vehicle technology;In general the proposed improvements and mitigation have been carriedout as proposed in the ES and the effect of the scheme on the Landscapesub-objective is considered to be as expected in the ES. However theimpact is worse than expected in the AST;In general the effect of the scheme on the Biodiversity sub-objective hasbeen as expected in the ES. Mitigation for badgers that was not includedin the ES was implemented as part of the scheme;Overall the effects of the scheme on the Heritage sub-objective areconsidered to be highly positive as expected in the ES. Archaeologicalassets that were identified after the ES was published have beeninvestigated satisfactorily;Water quality has been dealt with in accordance with the ES and theaffect on water quality is as expected in the ES; andPhysical Fitness and Journey Ambience: Measures to maintain NMU linksacross the bypass have been implemented and proposals for journeyambience have been implemented.51
6. Accessibility and IntegrationIntroduction6.1 Accessibility and Integration are the remaining objectives of the five Governmentobjectives for transport. As part of the scheme’s appraisal these objectives were coveredin the AST (see Figure 7.1) and formed part of the scheme’s pre-opening assessment.6.2 Quality of Life and Social Exclusion were not scheme objectives and are not currentNATA objectives. They are recent additions to the POPE process as a result of externalreviews, and are considered in this chapter.AccessibilityPublic Transport6.3 The AST predicted that the scheme would have no significant impact on public transport,and that the effect would be neutral.6.4 The bypass itself is not used by buses. Rushden and Higham Ferrers are served by anumber of local bus services, which connect housing, shopping, and employment areaswith the towns. A longer-distance route is Stagecoach M50, which runs between Bedfordand Kettering. This follows the old <strong>A6</strong> through Rushden and Higham Ferrers. Accordingto the timetable, this takes 30 minutes to travel between Sharnbrook and Irtlingborough.As reported in Chapter 2, the reduction in journey times on the old <strong>A6</strong> are relativelysmall, up to about two minutes, and it is not expected these will have made a significantimpact on bus timetables.6.5 As part of the public consultation, residents who had lived in the area longer than fiveyears were asked whether public transport had improved since the bypass opened. Asshown in Table 6.1, 16% of all respondents agreed, and 7% disagreed.6.6 Thus more respondents thought public transport had improved, than otherwise. But lessthan a quarter of the respondents had a view either way. However, of those who actuallyused public transport, 32% agreed and 14% disagreed.Severance6.7 The AST predicted that the scheme would remove 78% of traffic from Higham Ferrersand 20% from Rushden, and that this would have a large positive effect on severance.6.8 Traffic surveys show that about half the traffic has transferred to the bypass. This is lessthan was predicted for Highham Ferrers, but more than predicted for Rushden. Onaverage, the effect on severance is likely to be beneficial, as predicted.6.9 The public consultation asked a number of questions relating to Severance. Thequestions and responses are shown in Table 6.1. As the results show, more respondentsagreed than disagreed, that crossing the road had become easier, and that the towncentre environments had improved. These were not overwhelming majorities, however,and in some cases there were more “don’t know’s” than definite answers. It is notable52
that most people said they did not use local facilities more frequently. But there appearsto be general satidfaction with facilities for crossing the bypass.Pedestrians and Others6.10 The AST predicted that the reduction in town centre traffic would improve accessibility forpedestrians and cyclists.6.11 Traffic surveys show that approximately half the traffic has transferred from the old <strong>A6</strong> tothe new bypass. Therefore it is judged that accessibility for pedestrians and cyclists hasimproved, as predicted.6.12 The public consultation asked a number of questions relating to pedestrians and others.As may be seen from Table 6.1, more respondents agreed than disagreed that cyclinghad improved, and that there were satisfactory provisions for pedestrians to cross thebypass.Table 6.1 - Public Consultation Responses Relating to AccessibilitySince the Bypass Opened ….. Agree DisagreeNeither/Don’t knowHas crossing the road improved? 53% 10% 37%Has cycling improved? 32% 10% 58%Has public transport improved? 16% 7% 77%Has Rushden town centre environment improved? 39% 14% 47%Has Higham Ferrers town centre environment improved? 45% 9% 46%Do you use local facilities more frequently? 21% 74% 5%Is the area a better place to live? 58% 15% 27%Do you use footpaths/ bridleways near the bypass? 23% 69% 8%Are you satisfied with provisions for pedestrians to cross the bypass? 60% 30% 10%Public Perceptions about Accessibility6.13 Table 6.1 shows that questions relating to accessibility attracted more favourable thanunfavourable responses. The question attracting the highest proportion of favourableresponses was that concerning pedestrian crossing facilities at the bypass (60%), but thequestion was only put to the 23% who said they used footpaths or bridleways in thevicinity of the bypass. Only a minority (21%) said they used local facilities more frequentlysince the bypass opened.6.14 The following is a selection of comments relating to Accessibility.“Getting out of side roads in the car and crossing the road on foot is now much better.”“I used to have to cross the <strong>A6</strong> as a 13 year old and found it very dangerous. I believenow it is much safer.”“Crossing road in Higham is easier. Bus gets held up longer on roundabout.”53
“Please look at improving public transport e.g. frequency/cost of bus. If railway link willever re-open to Wellingborough.”“ I do not think enough thought was given to how pedestrians would get from HighamFerrers to Stanwick Lake, Rushden FC etc. It is very difficult and dangerous at ChownsMill roundabout, especially for young and old.”“Lorries still travel through the town and it is still too busy with through traffic, the bypassis under used and very quiet.”“More paths, cycle paths should have been added.”“If the bypass would have been more friendly to cyclists and walkers, the bridleway andfootpaths would have been used more.”6.15 Clearly there are differing views on accessibility issues, and these will be disseminated tothe relevant organisations, where appropriateIntegration6.16 The AST gave a positive assessment for Integration, based on the following;The scheme was identified in the Transport Policy section of the NorthamptonshireStructure Plan;The East of Wellingborough Development Area would be assisted by the scheme;andDevelopment of 1780 homes and 59ha of employment land was dependent on thescheme.Structure Plan and Regional Spatial Strategy6.17 The Northamptonshire Structure Plan 1996-2016 set out the land use strategy for thecounty, and remained in force until September 2007. It has been superseded by theRegional Spatial Strategy (RSS), prepared by the East Midlands Regional Assembly. Anumber of policies from the Structure Plan have been ‘saved’, i.e. maintained and carriedthrough to the RSS.6.18 The transport objectives of the Structure Plan were to:Reduce the total amount of travel by private car;Reduce the delay suffered by road users in order to safeguard the prosperity ofNorthamptonshire;Improve access to workplaces and other facilities for all the population includingpeople with disabilities, the very young, the elderly, and people on low incomes;Increase bus and rail patronage amongst former road users and people whocurrently experience low levels of access to facilities;Increase the number of trips made by cycling and walking; and54
Minimise the impact of transport on the environment; and reduce the number andseverity of road accidents.6.19 Policy T2 dealt with integrated transport strategies for five sub-areas of the county.Amongst the strategies for the eastern sub-area was the construction of the <strong>A6</strong> Rushdenand Higham Ferrers Bypass.6.20 Policy T2 was not saved in the RSS. The <strong>A6</strong> Rushden and Higham Ferrers Bypass doesnot feature in the RSS, because the scheme was already part of the road network by thetime the RSS was published.6.21 The scheme did form a part of county transport policy at the time it was planned, ascorrectly stated in the AST.Local Development Area Policies6.22 The AST states that the Structure Plan identifies the East of WellingboroughDevelopment Area which would be facilitated by the scheme.6.23 Structure Plan Policy SDA1 (which has been saved 1 ) lists a number of strategicdevelopment areas. One of these is ‘East of Wellingborough (in the Borough ofWellingborough)’. In fact, Rushden and Higham Ferrers do not fall within the Borough ofWellingborough, but are instead part of East Northamptonshire District. It is thereforedoubtful whether the scheme would promote the aims of the East of Wellingborough (inthe Borough of Wellingborough) Strategic Development Area. The significance ofwhether Rushden and Higham Ferrers are part of a strategic development area lies inthe priority given to development there.6.24 According to Structure Plan Policy GS4 (which is not saved 1 ), the hierarchy ofdevelopment sites is as follows:1. Re-used urban land;2. Urban extensions in strategic development areas;3. Other urban extensions; and4. New development around nodes in good public transport corridors.6.25 Thus urban extensions in strategic development areas would be ranked second, whereasother urban extensions would be ranked third, in terms of development priority. That wasthe situation at the time the <strong>A6</strong> Rushden and Higham Ferrers Bypass was beingproposed.6.26 Structure Plan Policy GS4 has been replaced by RSS Policy 2, in which the developmenthierarchy is now as follows:1. Previously developed sites;2. Other sites in urban areas not protected for amenity purposes;3. Suitable sites adjoining urban areas, well served by public transport; and4. Suitable sites not adjoining urban areas, well served by public transport.1 In the sense given in paragraph 6.1755
6.27 Following completion of the <strong>A6</strong> Rushden and Higham Ferrers bypass, therefore, theinclusion of a town in a strategic development area has lost its relevance in determiningthe priority of directing development there.6.28 The East Northamptonshire District Local Plan 1996 contains separate StrategyStatements for Rushden and Higham Ferrers.6.29 The Rushden Strategy Statement, Development Strategy section, states that theproposed <strong>A6</strong> bypass would form a barrier to development in the east. The Transportationsection lists the <strong>A6</strong> bypass, and the Rushden town centre link road, as being roadproposals for the area. It states that the bypass would reduce congestion in the town andimprove road safety.6.30 The Higham Ferrers Strategy Statement, Development Strategy section, states that theA45 bypass and the proposed <strong>A6</strong> bypass constrain the extent of development which isenvironmentally acceptable. The Transportation section lists the <strong>A6</strong> bypass, and theRushden town centre link road, amongst road proposals for the area. It states thatHigham Ferrers suffers from through traffic, that potential for development is hamperedby the existing road system, and that the proposed schemes will help alleviate this andassist in the implementation of environmental improvement and the promotion ofdevelopment opportunities.6.31 Thus the <strong>A6</strong> bypass, together with the link road (i.e. John Clark Way), are seen as vitalfor the development of Higham Ferrers. Policy HF2 allocates land for commercialdevelopment adjoining bypass, but only after completion of the link road.6.32 It may be noted that the Local Development Plan has been replaced by a Core SpatialStrategy (CSS) with effect from June 2008. The CSS does not cite the <strong>A6</strong> bypass aspromoting development, doubtless because the scheme is no longer a proposal but anestablished part of the road network.6.33 In conclusion, the scheme has contributed to East Northamptonshire District Local Planobjectives, but not to the East of Wellingborough Development Area, as stated in theAST.Development Dependent on the Scheme6.34 The AST stated that development of 1780 homes and 59 hectares of employment landwould be dependent on the bypass being provided.6.35 It has not been possible to identify these figures in planning documents, although boththe Rushden and Higham Ferrers Strategy Statements allocated sites for development.These are listed in the following tables.Table 6.2 - Allocated Housing SitesPolicy Site Size Location Dependent UponNewton Road 100 homes Between old <strong>A6</strong> and bypass Link RoadRU1Barrington Road 330 homes Between old <strong>A6</strong> and bypass -Balmoral Avenue 280 homes Between old <strong>A6</strong> and bypass -Bedford Road 320 homes Between old <strong>A6</strong> and bypass -HF1 Wharf Road 100 homes West of Old <strong>A6</strong> -56
Table 6.3 - Allocated Industrial and Commercial SitesPolicy Site Size Location Dependent UponRU1 Prospect Avenue 13.00 ha Between old <strong>A6</strong> and bypass Link RoadShirley Road 3.64 ha Between old <strong>A6</strong> and bypass Link RoadHF2 Unspecified 11.75 ha Between old <strong>A6</strong> and bypass Link Road6.36 In addition to the specific sites listed, the Strategy Statements expect further housingdevelopment opportunities on ‘windfall’ and ‘infill’ sites 1 .6.37 It may be noted that all but one of the specified sites lie between the old <strong>A6</strong> and the newbypass. For some of the sites, completion of the Link Road (i.e. John Clark Way) wasrequired as a pre-condition. To the extent that the bypass had to be in place before itcould be linked to Rushden with a Link Road, this also implies those sites would bedependent upon the bypass.6.38 Policies RU1, HF1, and HF2 have been saved, and form part of the CSS. Policy RU3 hasnot been saved. As part of the CSS, Rushden and Higham Ferrers are now covered bythe Three Towns Plan (the other town being Irthlingborough).6.39 In summary, no specific cases can be found where development required the presenceof the <strong>A6</strong> bypass, although there are numerous statements that it would facilitatedevelopment generally. However, there are several cases where the Link Road wasrequired to be in place before development could start, which by the very nature of thescheme would have required the bypass to be constructed.Public Perceptions about Integration6.40 As stated in the Economy chapter, one of the questions in the public consultation askedwhether the new development, since the bypass opened, was thought to be a good thing.Of those responding, 48% agreed, 29% disagreed, and 23% did not know.6.41 A number of the written comments have relevance to Integration, and some of thesehighlight differences between transport planners and local development planners. Thefollowing is a selection:“A chance to open up the town to new business.”“Bypass very good idea but useless because planning office at Thrapston passed plansfor ASDA supermarket which then changed traffic flow with more traffic lights which nowblocks roads up with cars …...”“It seems more small shops have closed.”1 In residential planning, windfall sites are usually taken to be small plots for less than 10 dwellings, which unexpectedlybecome available for development. Infill sites are small hitherto undeveloped sites within existing residential areas.57
“ASDA's presence has created more traffic congestion. Both town centres are dying dueto economic downturn.”“By bringing ASDA to Higham Rd. has caused huge congestion in this area, making thebypass pointless in the main.”“I think that a lot of the industry in the area at the time that the bypass was conceived hasnow closed due to the length of time before it was built.”“Building bypasses automatically makes towns bigger by opening new land fordevelopments. Care must be taken that those towns have their own Borough Councils toensure all developments are situated in the right places and are what the towns want,and are not picked and passed by planning offices in other towns who do not use suchdevelopments or live by them or are affected by them.”6.42 The comments show that the link between road schemes and development is generallyunderstood. Yet the respondents perhaps do not necessarily appreciate that planning iscarried out by different agencies and at different levels. If it was widely believed that theagencies had different objectives, this would suggest that integration had not beensuccessful; but this is not a conclusion to be drawn from just a few comments.Quality of Life6.43 Most of the public consultation questions reported in Table 6.1 under Accessibility alsorelate to Quality of Life. Particularly relevant is the question “Is the area a better place tolive?” As shown in Table 6.1, a majority of respondents agreed this to be the case. Thegeographical variation in responses is given in the table below. In this table, the entries inthe ‘Location’ column refer to zones illustrated in Figure 1.3.Table 6.4 - Responses to the Question: “Has the Bypass has made the Area aBetter Place to Live?”Location(Zone)AgreeNeither Agreeor DisagreeDisagree1 67% 19% 14%2 41% 35% 24%3 65% 32% 3%4 52% 20% 28%5 45% 44% 11%6 50% 31% 19%7 78% 15% 7%8 58% 28% 14%Total 58% 27% 15%6.44 This suggests that the more positive responses are from zones 1, 3, and 7, which all liewest of the old <strong>A6</strong>, and are distant from the bypass. The least positive responses arefrom zone 2, lying between the old <strong>A6</strong> and the bypass in the north, (although 41% still58
think the area is a better place to live), and from zone 5, which includes Rushden towncentre. Further details may be found in the full consultation report. 11 <strong>A6</strong> Rushden <strong>–</strong> Higham Ferrers Bypass Residents’ Survey (March 2009)59
6.45 Some comments illustrating the varying experiences of quality of life are given below.“Best thing that ever happened in Rushden.”“The bypass is a benefit but the area is not a better place to live because it has expandedtoo much.”“Noise, pollution, proximity to our property. Loss of enjoyment of garden.”“Dangerous pedestrian crossing at rear of rugby club on bypass. Should have been afootbridge.”“Because we live within 30 metres of the bypass it has a negative effect on our family asit has shifted the problems which were in the town centre onto our doorstop. We used tolive in a quiet cul-de-sac where all you hear when sitting in the garden was sounds of thebirds. We can no longer have our windows open on warm nights as we are awoken bythe sound of traffic from about 4.30am …..”“The impact of the <strong>A6</strong> bypass has been negative, whilst it may have taken through trafficfrom the centre of these two towns, it has been responsible for drawing the lifeblood andreducing the community spirit. These two industrious and historic towns are low shadowsof their former selves. They are dormitory towns with little hope of re-establishing theirformer identity.”6.46 The questionnaire result shows that a majority of respondents believe the quality of lifehas improved. But some comments show that improvements to the quality of life for thecommunity are sometimes achieved at the cost of a worsening for individuals.Social Exclusion6.47 Many of the public consultation questions reported in Table 6.1 under Accessibility alsorelate to Social Exclusion. Particularly relevant is the question “Do you use local facilitiesmore frequently?” As shown in Table 6.1, 74% of respondents did not. The geographicalvariation in responses is given in the Table 6.5 below. In this table, the entries in the‘Location’ column refer to zones illustrated in Figure 1.3.60
Table 6.5 <strong>–</strong> Responses to the Question: “Do You Use the Local Facilities MoreFrequently Since the Opening of the Bypass?”Location(Zone)Yes No Don’t Know1 36% 53% 83%2 12% 84% 4%3 15% 82% 3%4 20% 77% 3%5 14% 83% 3%6 25% 70% 5%7 28% 66% 6%8 17% 75% 7%Total 21% 74% 5%6.48 The low number of respondents agreeing with this question suggests the opening of thebypass has not had a great effect on the use of local facilities. Comments with somerelevance to the local facilities and ease of reaching them are given below.“Excellent bridges from Higham - Irthlingborough and lakes.”“Very difficult to get to Stanwick lakes by bicycle.”“A cycle track would be extremely useful. I do cycle from Higham to Harborough Fieldssurgery, Overall traffic is considerate although I keep as far to the left as possible.Chowns Mill roundabout is so dangerous. Too many roads feeding onto the roundaboutand too closely. Also,there is room to make three lanes from Higham ( one for left only,one for straight on and the other for right turning traffic) this would save a lot of cutting upwith potential accidents. Overall the new <strong>A6</strong> is of benefit to people of Rushden and H.F.for relieving town centres and to reducing journey time.”“Think more should be done for pedestrians especially paving and lighting”.“…. As OAP's we are apprehensive of using the roundabout because of the speed of thetraffic and seeing as we both need visits to Kettering Hospital it is getting to be anightmare trying to cross It …..”61
Main Accessibility and Integration ConclusionsThe scheme has not had a significant effect on public transport.The transfer of about 50% of the traffic from the old <strong>A6</strong> to the bypass, has improvedseverance, and improved conditions for pedestrians and others.The scheme is integrated with the Northamptonshire Structure Plan.The scheme is integrated with the East Northamptonshire Local Plan, but not theEast of Wellingborough Development Area.Several housing and commercial developments were dependent on completion ofJohn Clark Way, the link road between the <strong>A6</strong> bypass and Rushden town centre.Public consultation questions on Accessibility gained more favourable responsesthan unfavourable responses. However, few people said they made more frequentuse of local facilities or footpaths/ bridleways near the bypass.When asked whether new development following opening of the bypass was a goodthing, more people agreed than disagreed. When given the opportunity to comment,some said that congestion due to the new ASDA store counteracted the reliefprovided by the bypass. Some regretted the loss of small shops and otherbusinesses.When asked whether quality of life had improved following the bypass opening,more people agreed than disagreed. Support for the idea was strongest in residentialareas west of the old <strong>A6</strong> (distant from the bypass).62
7. Appraisal Summary Table7.1 An appraisal Summary Table (AST) is a one-page summary of the predicted economic,environmental, and social impacts of a major road scheme. The ‘Evaluation SummaryTable’ (EST) has been devised for the POPE process to record a summary of the actualscheme impacts. Where possible the EST mirrors the appearance and process of theAST, to permit comparison between the two.7.2 The original AST is reproduced as Table 7.1, and the new EST is given as Table 7.2.63
<strong>A6</strong> Rushden Higham Ferrers Bypass - Five Years After StudyTable 7.1 - Appraisal Summary Table<strong>A6</strong> Rushden <strong>–</strong> Higham Ferrers (GO-EM) Option: 1996 Scheme <strong>–</strong> 5.5km part D2/ pert SC bypass Cost: £9.4mPROBLEMSSevere safety, journey reliability and environmental problems through the towns of Rushden (pop: 24,000) and Higham Ferrers (pop: 5,400) Northants,due to tortuous alignment of <strong>A6</strong> and the high volume of traffic (19,7000 vpd <strong>–</strong> 6% HGV)OTHER OPTIONS Alternative bypass routes were rejected. Rail improvements unlikely to remove sufficient traffic to solve problem.CRITERIA SUB-CRITERIA QUALITATIVE IMPACTS QUANTITATIVE MEASURE ASSESSMENTENVIRONMENTALRemoval of traffic to new route benefits properties on existing road, but has adverse No. properties experiencing:Net 80 propertiesNoiseeffects on others (about 700 properties experience smaller increases or decreases in - increase in noise 150IMPACTlose with schemenoise level)- decrease in noise 70CO2tonnes added0-2000Local air qualityConsiderable improvement due to traffic being removed from centre of townsNo. properties experiencing:- improved air quality 520- worse air quality 25-239 PM 10-1471 NO 2Landscape No significant impact NeutralBiodiversity No significant impact NeutralHeritageSubstantial benefits for integrity and context of two towns Conservation Areas, includingnumerous listed buildingsLarge +veWaterEven with mitigation, there may be: a significant risk of polluting very sensitivegroundwater during both construction and operation; and an impact on local drainageModerate -veSAFETY - Safety benefits due to separation of through traffic from pedestrians and local traffic and Accidents Deaths Serious Slight PVB £3.9mimproved standard of new road. 426 4 93 386 72% of PVCECONOMY Journey times & High journey time improvements due to removal of traffic from one way system inPeak interpeak PVB £47.7mVOCsRushden. 7.9 mins 8.0 mins 878% of PVCCost - - PVC £5.4mReliability Route stress:-Before: 85% After: 23%SlightLow rel to PVCRegeneration - Serves regeneration priority area? NoACCESSIBILITY Public Transport No significant impact - NeutralSeveranceRemoval of through traffic in Higham Ferrers (78%) and Rushden (20%) will greatlyremove severance- Large +vePedestrian/ others Reduction in traffic will increase accessibility for pedestrians and cyclists in the town Large +veINTEGRATION -Scheme identified in Transport Policy in Approved Northants Structure Plan and in newdraft. Development of 1780 new homes and 59ha employment land dependent onbypass being provided. Northants CC Structure Plan identifies East of WellingboroughDevelopment Area which would be facilitated by scheme- PositiveCOBA PVB £51.6m PVC £5.4m NPV £46.2m BCR 9.49POPE _ <strong>A6</strong> Rushden & Higham Ferrers FYA report _ final 64
<strong>A6</strong> Rushden and Higham Ferrers Bypass - Five Years After StudyTable 7.2 - Evaluation Summary Table<strong>A6</strong> Rushden <strong>–</strong> Higham Ferrers (GO-EM) New bypass <strong>–</strong> 2.4 km dual carriageway and 3.0 km single carriageway Cost: £16.2mPROBLEMS Approx 15,000 vpd on old <strong>A6</strong> through town centres, comprising through traffic and local trafficCRITERIA SUB-CRITERIA QUALITATIVE IMPACTS QUANTITATIVE MEASURE ASSESSMENTENVIRONMENTALIMPACTGreenhouse carbon:103 tonnes added in2008Noise Effect of higher than predicted traffic flows is offset by the use of low noise surfacing - As expectedLocal air quality Effect of higher than predicted traffic flows offset by improvements in vehicle technology - As expectedLandscapeBiodiversityHeritageIn general the proposed improvements and mitigation have been carried out as proposedin the ES. Impact underestimated in AST.In general the effect of the scheme on the Biodiversity sub-objective has been asexpected in the ES. Mitigation for badgers that was not included in the ES wasimplemented as part of the schemeOverall the effects of the scheme on the Heritage sub-objective are considered to be asexpected in the ES. Archaeological assets that were identified after the ES waspublished have been investigated satisfactorily-Worse thanexpected- As expected- As expectedWaterWater quality has been dealt with in accordance with the ES and the affect on water- As expectedquality is as expected in the ESSAFETY - There has been a reduction in accidents, but less than predicted (The figures shown are Accidents Deaths Serious Slight PVB £2.5mobserved:predicted proportion of COBA forecasts). 77 0 6 93 15% of PVCECONOMY Journey times & Peak interpeak PVB £36.3mThere have been reductions in journey timesVOCs6.4 mins 4.7 mins 224% of PVCCost - - PVC £16.2mACCESSIBILITYReliability Route stress:Reduction in route stressBefore: 75% After: 21% - 48%Regeneration-Serves regeneration priority area?Public Transport-No- NeutralINTEGRATION -Severance Removal of through traffic (approx 50%) has reduced severance - +vePedestrian/ others Reduction in traffic has increased accessibility for pedestrians and cyclists in the towns +veScheme identified in Northamptonshire Structure Plan.Scheme promotes policies in East Northamptonshire Local PlanCertain schemes were dependent on the link road between <strong>A6</strong> bypass and Rushdentown centre.- +vePOPEMETHODOLOGYPVB £38.7m PVC £16.2m NPV £22.5m BCR 2.4POPE _ <strong>A6</strong> Rushden & Higham Ferrers FYA report _ final 65
8. Conclusions8.1 The <strong>A6</strong> Rushden <strong>–</strong> Higham Ferrers bypass officially opened on 14 th August 2003.The scheme provided 2.4 km of new dual carriage road, and 3.0 km of singlecarriageway, bypassing the towns of Rushden and Higham Ferrers inNorthamptonshire. This section of the <strong>A6</strong> was subsequently detrunked.8.2 Before the bypass opened, the average weekday volume on the old <strong>A6</strong> was about15,100 <strong>–</strong> 21,700 vpd. Five years after opening, the bypass carried about 8,400 <strong>–</strong>16,400 vpd, and the remaining flow on the old <strong>A6</strong> was about 7,500 <strong>–</strong> 14,700 vpd.The proportion of the combined flow carried by the bypass is 53% in the south and58% in the north.8.3 The actual traffic on the bypass is greater than predicted, by 39% in the north, and420% in the south, where the forecast flows were unrealistically low. This may bethe result of modelling assignment issues on this part of the bypass. It is not knownwhether the traffic generated by new developments was taken into account.8.4 The time savings for through traffic are 6.4 minutes in the peak, and 4.7 minutesinterpeak. Although substantial, these savings are lower than predicted.8.5 The average accident saving is 1.8 per year, which is less than predicted. Theaccident rate on the <strong>A6</strong> bypass is 0.129 pia/mvkm, below the national average forthis type of road.8.6 The outturn construction cost was £16.2 million; the combined benefit from timesavings and accidents was £38.7m, and the BCR was 2.4. This was a little lowerthan the predicted BCR, due to the cost overrun.8.7 The environmental impacts have been generally as predicted. Mitigation forbadgers that was not included in the ES was implemented as part of the scheme.Archaeological assets that were identified after the ES was published have beeninvestigated satisfactorily.8.8 Most public consultation feedback was largely favourable, when considering theresponses to set questions. However, additional written comments revealed manyconcerns, e.g. that insufficient through traffic was diverting to the bypass, and thatnew developments were creating more traffic problems in Rushden and HighamFerrers. A large number of comments referred to the perceived danger of the A45/<strong>A6</strong> (Chowns Mill) roundabout.66
Annex A: Journey TimesSee Figure 2.2 in the main report for route colours. Delay refers to time spent queuing.Table A.1 <strong>–</strong> Average Journey Times on <strong>A6</strong> Bypass (Red Route)SouthboundLinkAM IP PMTotal Time Delay Total Time Delay Total Time Delay1-2 00:32 00:16 00:23 00:08 00:41 00:242-3 01:07 01:07 01:073-3a 00:48 00:48 00:493a-4 01:19 01:18 01:214-5 01:25 00:16 01:17 00:01 01:21 00:145-6 00:27 00:28 00:28Total 05:38 05:22 05:47NorthboundLinkAM IP PMTotal Time Delay Total Time Delay Total Time Delay6-5 00:33 00:32 00:315-4 01:06 01:04 01:014-3a 01:20 01:19 01:193a-3 00:57 00:55 00:553-2 01:28 00:21 01:33 00:17 01:57 00:542-1 00:26 00:23 00:26Total 05:50 05:46 06:1067
Table A.2 <strong>–</strong> Average Journey Times on Old <strong>A6</strong> (Blue Route)SouthboundLinkAM IP PMTotal Time Delay Total Time Delay Total Time Delay1-2 00:33 00:15 00:35 00:16 00:31 00:112-3 03:57 03:59 03:573-4 00:55 00:09 00:54 00:05 00:58 00:104-5 01:34 00:09 01:35 00:13 01:36 00:165-5a 02:34 02:37 02:345a-6 00:28 00:28 00:28Total 10:01 10:08 10:04NorthboundLinkAM IP PMTotal Time Delay Total Time Delay Total Time Delay6-5a 00:33 00:33 00:325a-5 02:32 00:16 02:31 00:14 02:34 00:185-4 01:29 00:15 01:46 00:31 01:27 00:124-3 00:34 00:10 00:33 00:12 00:30 00:083-2 05:47 02:12 04:17 00:40 05:58 02:202-1 00:27 00:25 00:26Total 10:50 09:32 10:5668
Table A.3 <strong>–</strong> Average Journey Times on A5001/ A45 (Pink Route)SoutheastboundLinkAM IP PMTotal Time Delay Total Time Delay Total Time Delay1-2 03:40 03:43 03:442-3 03:03 00:11 03:09 00:14 03:06 00:053-4 01:18 00:13 01:16 00:09 01:17 00:104-5 00:36 00:04 00:38 00:45 00:39 00:095-5a 02:43 02:44 02:425a-6 00:28 00:28 00:28Total 11:48 11:57 11:56NorthwestboundLinkAM IP PMTotal Time Delay Total Time Delay Total Time Delay6-5a 00:32 00:34 00:325a-5 02:35 00:04 02:39 00:09 02:34 00:005-4 00:22 00:01 00:19 00:03 00:23 00:054-3 01:36 00:11 01:32 06:00 02:10 00:443-2 02:33 02:42 02:432-1 04:41 03:41 04:06Total 12:19 11:27 12:2869
Table A.4 <strong>–</strong> Average Journey Times on A45 (Orange Route)SouthboundLinkAM IP PMTotal Time Delay Total Time Delay Total Time Delay1-2 04:29 00:02 04:27 00:03 03:582-3 03:16 00:02 03:20 00:03 03:09 00:053-4 01:12 00:07 01:09 00:03 01:50 00:214-5 01:51 00:10 01:45 00:05 02:02 00:205-6 00:56 00;51 00:53Total 11:43 11:32 11:52NorthboundLinkAM IP PMTotal Time Delay Total Time Delay Total Time Delay6-5 00:59 00:01 00:57 00:00 01:00 00:025-4 01:55 00:05 01:47 00:02 02:13 00:204-3 01:14 00:02 01:11 00:02 01:04 00:003-2 02:54 00:06 02:48 00:03 02:48 00:022-1 04:32 04:18 04:37Total 11:34 11:01 11:4370
Annex B: Environmental EvaluationThis annex sets out for each environmental sub-objective, the predicted impacts, what hasbeen implemented, and our evaluation. The predicted impacts have been derived from theEnvironmental Statement (ES) and the Appraisal Summary Table (AST).Background information has been provided by relevant parties including environmental andlandscape planting plans. The following list includes all of the documents used in thepreparation of the assessment of the Environment Objective of the POPE report.Site Visit <strong>A6</strong> Trunk Road Rushden and Higham Ferrers Appraisal Summary Table 1998;<strong>A6</strong> Trunk Road Rushden and Higham Ferrers Environmental Statement andNon Technical Summary 1991, Faulks, Perry, Culley, Rech/ NorthamptonshireCounty Council; and <strong>A6</strong> Rushden to Higham Ferrers, Suggested Landscape Improvements <strong>–</strong>Landscape and Environmental, Sheets 1 to 8. As Built Record.A site visit was undertaken in May 2009 which allowed the scheme to be viewed from thehighway, adjacent local roads and from other publicly accessible areas, for example,footpaths and embankments.ConsultationAs part of the POPE evaluation process as well as Northamptonshire County Council andKettering Borough Council/East Northamptonshire Council we have consulted with thefollowing Statutory Bodies:Natural England;English Heritage; andThe Environment <strong>Agency</strong>.They were consulted regarding their views on the local impacts of the scheme on theenvironmental resources in the area surrounding the route. The consultees were also askedto comment on whether, in their opinion, the mitigation measures implemented have beeneffective.Table B.1 shows which organisations were contacted during the compilation of this report,their field of interest, and the responses received. A summary of their comments is includedwithin each relevant topic in this environment section of the POPE report.71
Table B.1 <strong>–</strong> Summary of POPE-Environment Consultation ResponsesOrganisationNatural EnglandField ofInterestLandscapeandBiodiversityAnsweredrequested list ofquestionsResponse ReceivedComments- Comments awaitedNorthamptonshireArchaeology (on behalfof English Heritage)HeritageYesTwo out of six sites excavated inaccordance with IFA guidelinesand agreed with CountyArchaeological Officer. Resultsrecorded and published. Awatching brief was carried outsatisfactorily but no further findswere identified.Environment <strong>Agency</strong> Water - Comments awaitedNorthampton-shireCounty CouncilGeneral - Comments awaitedEnvironmentTraffic growthThree of the environmental parameters noise, local air quality and greenhouse gases aredirectly related to traffic flows and their assumed growth until the Design Year. No newmodelling has been undertaken as part of this study. An assumption has been made that thelevel of traffic and the level of traffic noise or local air quality associated with that traffic aredirectly related. Therefore, if the observed level of traffic is as forecast it could be assumedthat the traffic noise and local air quality impacts are as expected.Based on the figures in Table 2.2 in Chapter 2 the traffic flow on the scheme has generallybeen greater than predicted in the economic assessment for the scheme. This is particularlythe case for the southern section of the bypass where traffic is almost 420% greater thanpredicted. This is considered to be as a result of errors in the modelling and traffic growthfrom new developments.When compared with the traffic figures in the ES which predicted flows for an opening yearof 1994 the actual traffic figures in 2008 are also higher. Again the variation is most markedin the southern section of the scheme. The AST did not indicate predicted traffic flows.Since the traffic flows are greater than expected on nearly all sections of the scheme, it isassumed that effects directly related to traffic flow will be worse than expected. Thereforethe effects on air quality and noise should be worse than predicted in the ES.72
NoiseSummary of Predicted ImpactsTable B.2 contains a summary of the impacts predicted in the AST and the ES of thescheme on the Noise sub-objective.Table B.2 <strong>–</strong> Summary of predicted effects on the Noise sub-objectiveOrigin ofAssessmentASTESSummary of Predicted EffectRemoval of traffic to new route benefits propertieson existing road but has adverse effects on others(about 70 properties experience smaller increasesor decrease in noise level and 50 propertiesexperience increase in noise.A number of properties lying adjacent to the route ofthe bypass will be affected by increased noiselevels. The majority of properties affected byincreased noise suffer only relatively smallincreases in noise levels either 3-5 dBA or 5-10dBA. The effects of increased noise will bemitigated by the earth mounding and screen fencingprovided by the scheme.A number of properties lying adjacent to the existing<strong>A6</strong> in Rushden and Higham Ferrers will benefit fromreduced noise levels because of reduced traffic.Assessment80 propertieslose with thescheme370propertieswouldexperience atleast anoticeableincrease innoise and atleast 180 anoticeabledecrease.ConsultationComments from Northamptonshire County Council are awaited.Predicted effects, their mitigation, and the five-year-after evaluationTable B.3 contains the effects predicted in the ES on the Noise sub-objective, the proposedmitigation measures and an evaluation of the effect one year after the scheme opened.No new noise monitoring or modelling has been undertaken for this evaluation.Key FindingsThe ES and AST both predicted the scheme to have an adverse impact on the Noise subobjective.The evaluation of the noise sub-objective is related to the predicted traffic flow ratecompared to the observed traffic flow rate. As discussed above the <strong>A6</strong> is experiencing trafficflows that are much higher than predicted in the original ES on the southern section andcomparable on the northern section.The mitigation in form of noise barriers and noise mounds has been constructed asproposed in the ES. In addition to these the scheme also included a low noise surface thatwas not included in the ES calculations.The effect of the scheme on noise levels and noise nuisance overall is likely to be asexpected in the ES based on the higher traffic flows than predicted on the southern sectionbeing offset by reductions in noise due to the low noise surface.The ES noted that insulating windows against the effects of noise from traffic on the bypasswas an option but indicated that earth mounding would be more effective to a wider range of73
properties. Subsequent to the ES the position on mitigation was amended and 15 propertieswere insulated against noise.There have been 1940 Part I claims submitted for the scheme so far. Of these 1340haveresulted in nil compensation being paid with 600 claimants receiving compensation and 93claims have been rejected as invalid. There is still just over a year left for people to submit aPart I claim for the scheme so it is possible that more will be submitted before that periodexpires.74
Table B.3 <strong>–</strong> ES predicted Effects, proposed Mitigation and the Evaluation of the Noise sub-objectiveEffect predicted in ES Mitigation Evaluation of the Noise subobjectiveNoise levelsA number of properties lying adjacent tothe route of the bypass will be affectedby increased noise levels. The majorityof properties affected by increasednoise suffer only relatively smallincreases in noise levels either 3-5 dBAor 5-10dBA. The effects of increasednoise will be mitigated by the earthmounding and screen fencing providedby the scheme.A number of properties lying adjacent tothe the existing <strong>A6</strong> in Rushden andHigham Ferrers will benefit fromreduced noise levels because ofreduced trafficEnvironmental barriers would be constructed on the scheme to decrease noise levelsexperienced at properties which were identified as likely to experience a significantincrease in noise levels. This included the following new noise barriers or mounds: A earth mound on the west side of the bypass between Stanwick Road and the A45; a new 4 m earth mound between the proposed Rushden Link Road and footpath UK 3on the west of the bypass;a combined earth mound and environmental barrier to 4m above carriageway levelfrom Footpath Uk 3 to Knights Farm on the west of the bypass; a combined earth mound and environmental barrier to 4m above carriageway levelfrom Knights Farm to Chainage 4000 on the west of the bypass.Surfacing the <strong>A6</strong> with a low noise surface and it was assumed that all surrounding roadswould retain hot rolled asphalt surfaces (to a texture depth of 2.0 mm).The site visit and as-builtdrawings confirmed the presenceof the noise barriers and noisemounds proposed as mitigation.Currently traffic flow on the <strong>A6</strong> ishigher than forecast. It isconsidered that since the noisemitigation has been constructedas proposed in the ES and trafficflow is greater than predicted inthe ES the effect of the schemeon noise levels is as expected orworse than expected.NoisenuisanceA number of the residential propertiesin the study area would experience anincrease in noise nuisance with fewerproperties experiencing a decrease.The net change in the number ofproperties affected by road noise wouldincrease as a result of the scheme. Inthe year 1994 the estimated number ofproperties affected would increase by80 as a result of the scheme.Noise barriers/mounds would be erected as above.The noise nuisance is related tothe noise level created by thescheme; therefore it isconsidered to be as expected orworse than expected, due tohigher than anticipated traffic flowrates. However a low noisesurface was not included in theES and this will have served toreduce noise levelsNoiseInsulationRegulationsAlthough the scheme includes anumber of new mounds/environmentalbarriers, there are a number of areaswith significant noise increases. Thecalculated noise levels indicate that anumber of properties may qualify fornoise insulation.Noise insulation was not originally included in the mitigation noted in the ESThe ES did not propose noiseinsulation but 15 properties wereeligible for noise insulation underthe Noise Insulation Regulationsand have actually had noiseinsulation installed.75
Air QualitySummary of Predicted ImpactsTable B.4 contains a summary of the impacts predicted in the AST and the ES of thescheme on the Air Quality sub-objective.Table B.4 <strong>–</strong> Summary of predicted effects on the Air Quality sub-objectiveOrigin ofAssessmentASTESSummary of Predicted EffectConsiderable improvement due to traffic being removed fromcentre of towns. 520 properties experiencing improved airquality and 25 experiencing worse air quality. PM 10 reduced by239 and NO 2 reduced by 1471The construction of a new road has two separate effects on airpollution in the locality. On the new route increased pollution islikely but as the total amount of pollution is unchanged, therewill be a reduction of air pollution in areas from which trafficdiverts to the new road.AssessmentBeneficialNeutral EffectConsultationComments on air quality are awaited.Predicted effects, their mitigation, and the one-year-after evaluationThe evaluation of the Air Quality sub-objective is related to the predicted traffic flow ratecompared to the observed traffic flow rate. As discussed above the <strong>A6</strong> is experiencing trafficflows that are higher than predicted in the original ES on the southern section andcomparable on the northern section. No new air quality monitoring or modelling wasconducted as part of this evaluation.The original ES dealt very briefly with air quality issues noting that overall amounts ofpollution would be unchanged with an increase along the bypass and a decrease on roadsthat traffic diverted from. The changes in air quality were not quantified. The AST didquantify changes in level of key pollutants and predicted a decrease in PM 10 and NO 2 and asubstantial net increase in the number of properties having better air quality as a result ofthe schemeTable B.5 contains the effects predicted in the ES on the Air Quality sub-objective, theproposed mitigation measures and an evaluation of the effect five year after the schemeopened.Key FindingsThe AST predicted that the scheme would have a beneficial effect on air quality whilst theES predicted that the scheme would also have a positive effect on air quality.The scheme is likely to have had a positive effect on air quality due to a reduction in trafficcongestion and an increase in average vehicle speed. Despite the traffic flows being higherthan predicted in the ES for some parts of the network the effect is considered to be likely tobe as expected in the ES. This is due to improvements in vehicle technology since the ESwas published. To verify this it would be necessary to carry out air quality monitoring whichis outside the scope of this evaluation.76
Table B.5 <strong>–</strong> ES predicted Effects, proposed Mitigation and the Evaluation of the Air Quality sub-objectiveEffect predicted in ES Mitigation Evaluation of the Air Quality sub-objectiveTrafficcongestionThe new alignment will enable throughtrafficon the <strong>A6</strong> to bypass Rushden andHigham Ferrers thereby maintaining freeflowingtraffic that would minimise vehicleemissions.No mitigation proposedThe alignment does enable through-traffic on the <strong>A6</strong> to bypass Rushden andHigham Ferrers, without stopping and so vehicle emissions should be minimised.There are improvements to congestion in peak periods on the old <strong>A6</strong> butbetween the peak periods that improvements are negligible It is considered thatdue to traffic flow on the <strong>A6</strong> being greater than predicted, the effect of thescheme on air quality due to traffic congestion has been worse than expected.This needs to be offset by improvements to vehicle technology.TrafficspeedsThe scheme would result inimprovements to average vehicle speedsand the removal of traffic congestion andtherefore the scheme would result inreductions to total emissions from traffic.No mitigation proposedIt was predicted that the scheme would result in improvements to averagevehicle speeds. Average vehicle speed data was assessed and improvementshave been recorded It is considered that due to traffic flow on the <strong>A6</strong> beinggreater than predicted, the effect of the scheme on air quality due to traffic speedhas been worse than expected. Further study would be required to verify this.AnnualaveragetrafficnumbersThe scheme would increase the capacityof the road and overall there would be anoverall marginal increase in pollutantlevels within and adjacent to the roadcorridor than there would have beenwithout them.No mitigation proposedThe scheme has increased the capacity of the road and it was predicted that thiswould result in an overall marginal increase in pollutant levels. However thetraffic flow is currently more than predicted therefore it is considered that theeffect of the scheme on air quality due to annual average traffic numbers hasbeen worse than expected.77
Greenhouse GasesFor transport, the most significant greenhouse gas is carbon dioxide and under currentguidelines this is reported in terms of tonnes of carbon. The AST predicted that the schemewould result in the emission of an additional 0 <strong>–</strong> 2000 tonnes of carbon dioxide. This isequivalent to 0 <strong>–</strong> 545 tonnes of carbon. The period over which this would be emitted was notstated.The greenhouse gas emission is measured in terms of tonnes of carbon, and is calculatedusing COBA 11.7. This is done firstly with the original data, and secondly with actual trafficflows. The changes in carbon emission in 2008, given by this method, are shown in thefollowing table.Table B.6 <strong>–</strong> Annual Carbon EmissionTonnes of Carbon in 2008PredictedActualDo Minimum 5959 6965Do Something 6007 6887Difference +48 -78The changes in both cases are very small, but with predicted data show an increase of 48tonnes, and with actual data show a decrease of 78 tonnes, despite there being more traffic.This is believed to be due to the reduction in congestion, and an increase in speeds withinthe range where emissions decrease with increasing speed.LandscapeSummary of Predicted ImpactsTable B.7 contains a summary of the impacts predicted in the AST and the ES of thescheme on the Landscape sub-objective.Table B.7 <strong>–</strong> Summary of predicted effects on the Landscape sub-objectiveOrigin ofAssessmentSummary of Predicted EffectAssessmentAST No significant impact NeutralESThe design of the route has sought to reduce the impact onproperty and and landscape by a number of measures, forexample, avoiding property demolition, providing sufficientspace for adequate and effective mitigation areas, avoidingloss of trees between Chalveston Road and Newton Road.Whilst a number of properties will suffer visual intrusion due tothe bypass this intrusion will be softened by the substantiallandscaping proposlas to be carried out with the constructionof the bypass349 residential properties were considered to be subject tonew or increased visual intrusion and 697 residentialproperties were considered to be subject to new or increasedvisual obstruction with the scheme.Noassessmentmade in ES78
ConsultationComments are awaited from Natural England.Predicted effects their mitigation and the five-year-after evaluationTable B.8 contains the effects predicted in the ES on the landscape sub-objective, theproposed mitigation measures and an evaluation of the effect one year after the schemeopened.79
Table B.8 <strong>–</strong> Proposed Mitigation and the Evaluation of the Landscape sub-objectiveA45/<strong>A6</strong>/<strong>A6</strong>05RoundaboutStanwickRoad to A45ChelvesonRoadChelvestonRoad toProposedRushdenLink RoadProposedRushdenLink Roadroundaboutto PublicFootpath RefUK 3PublicFootpath RefUK 3 toKnightsFarmProposed MitigationAn area of dense planting was proposed between the existing <strong>A6</strong> andthe new bypass. This was to be linked to a 5m wide belt of denseplanting, widening to 10m south of the public footpath VC5 whichcrossed the bypass near Glebe FarmExtensive use of contoured landscape mounding was to be made.Adjacent to the housing estate the mounding was to be maintained at4m above the carriageway to screen lorries and the mound was to bedensely planted. Off-site landscaping was to be offered to the owners ofGlebe farm and a new balancing pond was proposed adjacent toStanwick RoadThe land registered as Common Land to the north of Stanwick Roadnear Glebe farm which the bypass passed through was to be replacedby an equivalent area of land allocated to the south of Chelveston Roadbetween the bypass and the realigned Newton Road.Cutting slopes were to be densely planted and dense planting wasproposed to screen and enclose the Rushden Link roundabout. Plantingin the field corners created by the old alignment of Newton Road wereto be planted to reduce headlight glare. Planting of other field cornerswas also proposed.Contoured screen mounds with dense planting were to be constructedon the western side of the bypass with varying side slopes to integrate itwith adjacent amenity land. Existing mature hedgerows were to beretained and protected where possible.Densely planted contoured mounding was proposed on the west side ofthe bypass. Where space was restricted an environmental barrier wasto be placed on top of the mound to maintain a 4m high screen. On theeast of the bypass land between the bypass and a new access trackwas also to be planted. Off site planting was to be offered to owners ofproperties on the west of the bypass.Evaluation of the Landscape sub-objectiveProposed mitigation has been carried out as planned but thewidening to 10m has been achieved with off-site planting Theeffect of the scheme is considered to be as expected in theES.Mounding with planting has been carried out adjacent to thehousing area west of the bypass and is establishingsatisfactorily. The as built drawings do not show off-siteplanting here and it is assumed that the offer was not takenup. The new balancing pond has been put in place and hasbeen colonised by vegetation. On the east side of the bypassthe slopes are sown with species rich grassland.The common land has been acquired as proposed and issupporting a sward of grass with some weed species.The dense planting on the cutting slopes is establishing welland the planting at the roundabout is starting to screen thetraffic effectively. There is mounding as well as the plantingproposed in the ES at the point where Newton Road hasbeen diverted and this effectively creates a separationbetween the bypass and Newton Road as intended. Hedgesalong the highway boundary are establishing well here.The mounds and planting have been implemented and thetress are establishing well apart from the area near thefoorbridge which has been subject to ongoing vandalism andtheft. The existing hedges appear to have been retainedsatisfactorily.The mounding has been implemented as planned with anenvironmental barrier making up the height to 4m wherenecessary. Planting is establishing well on the mounds butthe as built drawings do not indicate any off site planting inthe adjacent housing. There is planting between the bypassand the access track to the east of the bypass as proposed.80
KnightsFarm toChainage4000Chainage4000 toRoundaboutwith the <strong>A6</strong>BedfordRoadProposed MitigationBetween Knights farm and the roundabout the mounding and screenfencing would continue. Severed land and other areas round theroundabout would be densely planted and this would extend on thewest side of the bypass south of the roundabout to screen view fromRushden.At the north of this length there was to be dense roadside planting in a10m wide belt to screen adjacent housing. The severed field corner atch 4450 on the east side was to be planted to aid landscape integration.Where the road was to rise on embankment substantial wedges ofdense planting would tie in with the existing hedgerow patterns. One ofthese wedges was to incorporate a balancing pond designed withcreative conservation in mind. At he southern end the roundabout wasto surrounded by dense planting and some screen mounding wherepossible to mitigate longer views across this area.Evaluation of the Landscape sub-objectiveThe mounding continues to the roundabout and then wrapsround to the west in an area of severed land effectivelyscreening the roundabout from views from the north west. .To the south of the roundabout as well as planting moundinghas also been implemented on the western side of thebypass and this helps to screen views of the roundaboutfrom the south west.At the northern end the planting has been supplemented withmounding to enhance the screening. The severed fieldcorner has not been planted but the wedges of denseplanting do include a series of attenuation ditches that havebecome well vegetated. The southern roundabout issurrounded by dense planting and in some areas integratedwith mounding and the roundabout is effectively screened.81
PhotographsPhotograph B.1 <strong>–</strong> Exchange Common Land adjacent to Stanwick RoadPhotograph B.2 <strong>–</strong> View along the bypass showing earthmounding and plantingto left and new boundary hedgerow planting to the right.82
Photograph B.3 <strong>–</strong> Area of planting on embankment near footbridge to Rushdenwhich has been subject to theft and vandalism.Photograph B.4 <strong>–</strong> Individual trees establishing well on cutting slopes onsouthern section of scheme83
Photograph B.5 <strong>–</strong> High chain link fencing on boundary adjacent to Rugby ClubKey FindingsThe AST predicted the scheme to have a neutral effect on the Landscape sub-objective butthe ES did not give an overall assessment of effect. The AST would appear to haveunderestimated the effect of the bypass as the impact of such a scheme on the landscape isconsidered to be adverse.In general the proposed improvements and mitigation have been carried out as proposed inthe ES. The very outline nature of the description of the mitigation in the ES makes ameaningful comparison difficult. In some areas, notably the inclusion of further screenmounding towards the southern end of the scheme the mitigation is more extensive thanproposed in the ES. There is a continuing problem with noxious weed infestation whichhasn’t been eradicated during the maintenance period. Overall the landscape proposalshave been successful with only limited areas of plant failures notably at the footpath crossingto Rushden which has been subject to ongoing vandalism and plant theft.BiodiversitySummary of Predicted ImpactsTable B.9 contains a summary of the impacts predicted in the AST and the ES of thescheme on the Biodiversity sub-objective.84
Table B.9 <strong>–</strong> Summary of predicted effects on the Biodiversity sub-objectiveOrigin ofAssessmentSummary of Predicted EffectAssessmentAST No significant direct effect NeutralESNo statutory sites or sites specifically identified for their natureconservation interest will be lost. There will of course be someimpact, loss of hedgerows, mature trees etc but the plantingproposed when mature will more than offset such losses. Atotal of some 2.2 kilometres of hedge will be lost, together with45 hedgerow trees.NoassessmentgivenConsultationComments are awaited from Natural England.Predicted effects their mitigation and the one-year-after evaluationTable B.10 contains the effects predicted in the ES on the Biodiversity sub-objective, theproposed mitigation measures and an evaluation of the effect one year after the schemeopened.85
Table B.10 <strong>–</strong> ES proposed Mitigation and the Evaluation of the Biodiversity sub-objectiveMitigationEvaluation of the Biodiversity sub-objectiveField cornersNew hedgesFloriferousgrass swardBalancingpondsField corners isolated by construction will beplanted up with appropriate woodland andshrub species to help integrate the road withthe landscape. Dense thorny scrub of valueto nesting birds will be recreated over arelatively short periodNew hedges bordering the road asaccommodation works were proposed whereagreed by the landowners. The planting mixwas to include mostly hawthorn andblackthorn reinforced with locally occurringspeciesThe intention was to provide a floriferoussward which would be achieved by reducingtopsoil depths to reduce fertility. At certainlocations an appropriate grass and wildflowerseed mix would be sown.The volume of ponds was to be increased toallow the incorporation of a variety ofmarginal and aquatic plants. The ponds wereto be over deepened and compacted to allowthe bottom to be permanently wet formingpond or wetland communities. A diverse floraand fauna would be promoted possibly withplants taken from the River Nene. A bufferzone around each pond would protect it fromagricultural run off.Four field corners were shown planted up on the ESdrawings but only three of these were actuallyplanted up as proposed. Planting is establishingsatisfactorily but is in need of maintenance. Theeffect of the scheme is considered slightly less thanexpected in the ES.Hedges have been planted along the length of thebypass on the highway boundary and areestablishing well. It is considered that the effect ofthe scheme is as expected in the ES.The areas of wildflower grassland are considerablymore extensive than indicated in the ES. Thesuccess of these areas is patchy but overall It isconsidered that the effect of the scheme is betterthan expected in the ES.Two balancing ponds were created in line withproposals in the ES. A detailed ecological survey ofthe ponds was not undertaken but it appears thatthe ponds support a variety of marginal and aquaticspecies. Therefore the effect of the scheme isconsidered to be as expected.Badgers No specific mitigation was proposed. An artificial sett and badger tunnel have beencreated at the southern end of the scheme so theeffect is considered to be better than expected inthe ES. Badger fencing has also been included atthe northern end because badgers were noted tocross the line of the bypass here. Consultation withthe badger sub consultant suggest that the tunnel isnot located well and is subject to occasional flooding86
PhotographsPhotograph B.12 <strong>–</strong> Entrance to artificial badger sett at the southern end of the schemePhotograph B.13 <strong>–</strong> Badger tunnel at the southern end of the scheme87
Key FindingsThe AST predicted the scheme to have a neutral effect on the Biodiversity sub-objectivewhilst the ES made no prediction.In general the effect of the scheme on the biodiversity has been as expected in the ES withthe mitigation measures described having been implemented. A number of ecologicalsurveys were carried out after the ES was published which lead to additional mitigationmeasures being proposedAdditional mitigation in the form of an artificial badger sett and tunnel under the bypass havebeen created, in a response to finding a badger sett close to the line of the route after the ESwas published. No formal evaluation has been carried out but discussions with the badgersub consultant suggest that the sett is used but the tunnel is subject to periodic flooding.Badger netting is also included in the northern section of the route where badger activity wasrecorded.The effect of the scheme on bat, otters, water voles and great crested newts was notconsidered in the ES as these species were not present.HeritageSummary of Predicted ImpactsTable B.11 contains a summary of the impacts predicted in the AST and the ES of thescheme on the Heritage sub-objective.Table B.11 <strong>–</strong> Summary of predicted effects on the Heritage sub-objectiveOrigin ofAssessmentASTESSummary of Predicted EffectSubstantial benefits for integrity and context of two townsConservation Area, including numerous listed buildingsThe study area contains a Conservation Area and severalListed Buildings. The scheme would result in ‘significant relieffrom traffic vibration and impact damage to buildings in theHigham Ferrers Conservation Area’AssessmentLargePositiveEffectSignificantreliefConsultationComments from English Heritage are awaited.Predicted effects their mitigation and the one-year-after evaluationTable B.12 contains the effects predicted in the ES on the Heritage sub-objective, theproposed mitigation measures and an evaluation of the effect five years after the schemeopened.88
Table B.12 <strong>–</strong> ES predicted Effects, proposed Mitigation and the Evaluation of the Heritage sub-objectiveArea Effect predicted in ES Proposed Mitigation Evaluation of the Heritage sub-objectiveHighamFerrersConservationAreaThe scheme would result in significant relief tothe Higham Ferrers Conservation Area.No specific mitigation was proposedThe effect is considered to be as expected in the ES.ArchaeologyTwo sites with archaeological value which wouldbe affected by the scheme were identified afterthe ES. One was a small group of enclosureslying in a field behind the Ferrers School and theother was a single ditch on the south-east sideof RushdenNo specific mitigation was proposed in theES but the enclosure site was to beexcavated ahead of construction and theditch site subject to a watching brief duringconstructionThe enclosure site was fully investigated and revealedinteresting finds and information about settlement in thisarea. The ditch site was less interesting and informative.89
PhotographsPhotograph B.15 <strong>–</strong> The Conservation Area showing the old <strong>A6</strong> in HighamFerrersKey FindingsThe AST predicted that the scheme would have a large positive effect on the Heritage subobjective whilst the ES made no predictions for heritage overall but did comment that therewould be significant relief for the Higham Ferrers Conservation AreaOverall the effects of the scheme on the Heritage sub-objective are considered to be asexpected in the ES.After the ES was published further archaeological information was discovered and two siteswere investigated. These revealed interesting information on the heritage of the area whichwas not known at the time of the ES. These two sites appear to have been investigatedsatisfactorily.WaterSummary of Predicted Impacts8.98.10TableB.13 contains a summary of the impacts predicted in the AST and the ES of thescheme on the Water sub-objective.90
TableB.13 <strong>–</strong> Summary of predicted effects on the Water sub-objectiveOrigin ofAssessmentASTESSummary of Predicted EffectEven with mitigation, there may still be a significant risk ofpolluting very sensitive ground water during both constructionand operation and an impact on local drainageThe ES didn’t refer to drainage proposals specifically but theywere included as part of the ecological mitigationAssessmentModeratenegativeConsultationComments were sought from the Environment <strong>Agency</strong>, but none have been received.91
Table B.14 <strong>–</strong> ES predicted Effects, proposed Mitigation and the Evaluation of the Water sub-objectiveWater feature Effect predicted in ES Proposed mitigation Evaluation of the Water sub-objectiveBalancingpondsNo reference in ESTwo balancing ponds were shown on the ES drawings andreference made in the ecology sectionGroundwater No reference in ES No reference in ES No reference in ESBalancing ponds have been installed as proposed on the ESdrawings. These include pollution control fetures not mentionedin the ES. The ponds appear to be functioning satisfactorily withno evidence of pollution or flooding. Both ponds support a rangeof marginal vegetation.92
<strong>A6</strong> Rushden and Higham Ferrers Bypass - Five Years After StudyPhotographsPhotograph B.16 <strong>–</strong> Balancing pond adjacent to Stanwick RoadPhotograph B.16 <strong>–</strong> Balancing pond at southern end of scheme.93
<strong>A6</strong> Rushden and Higham Ferrers Bypass - Five Years After StudyKey FindingsThe AST predicted the scheme to have moderate negative effect on the Water sub-objective. TheES made no reference to drainage proposals except as part of the ecological mitigation.The drainage features were visited during the site visit and a visual appraisal indicated that theywere performing satisfactorily.Physical Fitness and Journey AmbienceNeither the AST or ES made reference to Physical Fitness or Journey Ambience, and they are notdefined as scheme objectives.It was noted that two footbridges were built as part of the scheme which were not described in theES and these would have improved the conditions for non motorised users crossing the bypass.There are two other at grade crossings on the route.In chapter 6, there is a summary of consultation responses to questions relating to Accessibility,and some of these are also relevant to Physical Fitness. More respondents agreed than disagreedthat crossing roads and cycling had improved. However, only a minority said they used footpathsor bridleways near the bypass.Journey ambience will be better for drivers using the bypass than those on the old <strong>A6</strong>, due to thereduction in congestion. A layby has been provided in each direction on the northern section of thebypass.94
<strong>A6</strong> Rushden and Higham Ferrers Bypass - Five Years After StudyMain Environment ConclusionsThe effect of the scheme on the Noise sub-objective is considered to beas expected in the ES as a result of higher traffic flows being offset by theuse of a low noise surface.The effect of the scheme on the Air Quality sub-objective is considered tobe as expected in the ES as a result of higher traffic flows being offset byimprovements in vehicle technology.In general the proposed improvements and mitigation have been carriedout as proposed in the ES and the effect of the scheme on the Landscapesub-objective is considered to be as expected in the ES.In general the effect of the scheme on the Biodiversity sub-objective hasbeen as expected in the ES. Mitigation for badgers that was not includedin the ES was implemented as part of the scheme.Overall the effects of the scheme on the Heritage sub-objective areconsidered to be as expected in the ES. Archaeological assets that wereidentified after the Es was published have been investigated satisfactorilyWater quality has been dealt with in accordance with the ES and theaffect on water quality is as expected in the ESPhysical Fitness and Journey Ambience have been identified in theScheme Evaluation Plan as not being a scheme sub-objective and havenot been analysed. Measures to maintain NMU links across the bypasshave been implemented and proposals for journey ambience have beenimplemented.95