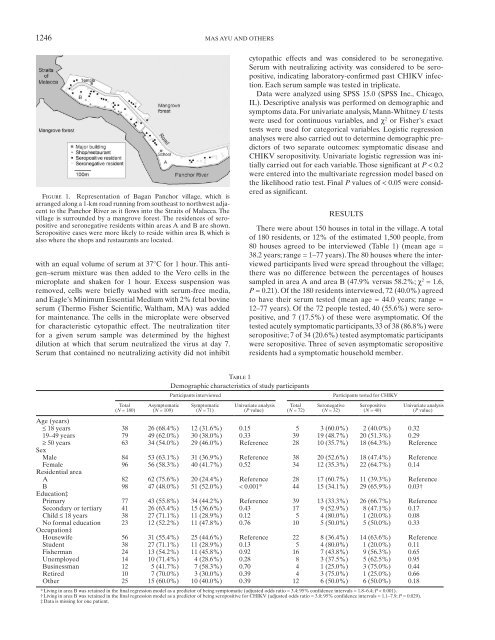
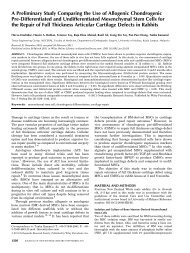
1246 MAS AYU AND OTHERSFigure 1. Representation <strong>of</strong> <strong>Bagan</strong> <strong>Panchor</strong> village, which isarranged along a 1-km road runn<strong>in</strong>g from southeast to northwest adjacentto the <strong>Panchor</strong> River as it flows <strong>in</strong>to the Straits <strong>of</strong> Malacca. Thevillage is surrounded by a mangrove forest. The residences <strong>of</strong> seropositiveand seronegative residents with<strong>in</strong> areas A and B are shown.Seropositive cases were more likely to reside with<strong>in</strong> area B, which isalso where the shops and restaurants are located.with an equal volume <strong>of</strong> serum at 37°C for 1 hour. This antigen–serummixture was then added to the Vero cells <strong>in</strong> themicroplate and shaken for 1 hour. Excess suspension wasremoved, cells were briefly washed with serum-free media,and Eagle’s M<strong>in</strong>imum Essential Medium with 2% fetal bov<strong>in</strong>eserum (Thermo Fisher Scientific, Waltham, MA) was addedfor ma<strong>in</strong>tenance. The cells <strong>in</strong> the microplate were observedfor characteristic cytopathic effect. The neutralization titerfor a given serum sample was determ<strong>in</strong>ed by the highestdilution at which that serum neutralized the virus at day 7.Serum that conta<strong>in</strong>ed no neutraliz<strong>in</strong>g activity did not <strong>in</strong>hibitcytopathic effects and was considered to be seronegative.Serum with neutraliz<strong>in</strong>g activity was considered to be seropositive,<strong>in</strong>dicat<strong>in</strong>g laboratory-confirmed past CHIKV <strong>in</strong>fection.Each serum sample was tested <strong>in</strong> triplicate.Data were analyzed us<strong>in</strong>g SPSS 15.0 (SPSS Inc., Chicago,IL). Descriptive analysis was performed on demographic andsymptoms data. For univariate analysis, Mann-Whitney U testswere used for cont<strong>in</strong>uous variables, and χ 2 or Fisher’s exacttests were used for categorical variables. Logistic regressionanalyses were also carried out to determ<strong>in</strong>e demographic predictors<strong>of</strong> two separate outcomes: symptomatic disease andCHIKV seropositivity. Univariate logistic regression was <strong>in</strong>itiallycarried out for each variable. Those significant at P < 0.2were entered <strong>in</strong>to the multivariate regression model based onthe likelihood ratio test. F<strong>in</strong>al P values <strong>of</strong> < 0.05 were consideredas significant.RESULTSThere were about 150 houses <strong>in</strong> total <strong>in</strong> the village. A total<strong>of</strong> 180 residents, or 12% <strong>of</strong> the estimated 1,500 people, from80 houses agreed to be <strong>in</strong>terviewed ( Table 1 ) (mean age =38.2 years; range = 1–77 years). The 80 houses where the <strong>in</strong>terviewedparticipants lived were spread throughout the village;there was no difference between the percentages <strong>of</strong> housessampled <strong>in</strong> area A and area B (47.9% versus 58.2%; χ 2 = 1.6,P = 0.21). Of the 180 residents <strong>in</strong>terviewed, 72 (40.0%) agreedto have their serum tested (mean age = 44.0 years; range =12–77 years). Of the 72 people tested, 40 (55.6%) were seropositive,and 7 (17.5%) <strong>of</strong> these were asymptomatic. Of thetested acutely symptomatic participants, 33 <strong>of</strong> 38 (86.8%) wereseropositive; 7 <strong>of</strong> 34 (20.6%) tested asymptomatic participantswere seropositive. Three <strong>of</strong> seven asymptomatic seropositiveresidents had a symptomatic household member.Table 1Demographic characteristics <strong>of</strong> study participantsParticipants <strong>in</strong>terviewedParticipants tested for CHIKVTotal( N = 180)Asymptomatic( N = 109)Symptomatic( N = 71)Univariate analysis( P value)Total( N = 72)Seronegative( N = 32)Seropositive( N = 40)Univariate analysis( P value)Age (years)≤ 18 years 38 26 (68.4%) 12 (31.6%) 0.15 5 3 (60.0%) 2 (40.0%) 0.3219–49 years 79 49 (62.0%) 30 (38.0%) 0.33 39 19 (48.7%) 20 (51.3%) 0.29≥ 50 years 63 34 (54.0%) 29 (46.0%) Reference 28 10 (35.7%) 18 (64.3%) ReferenceSexMale 84 53 (63.1%) 31 (36.9%) Reference 38 20 (52.6%) 18 (47.4%) ReferenceFemale 96 56 (58.3%) 40 (41.7%) 0.52 34 12 (35.3%) 22 (64.7%) 0.14Residential areaA 82 62 (75.6%) 20 (24.4%) Reference 28 17 (60.7%) 11 (39.3%) ReferenceB 98 47 (48.0%) 51 (52.0%) < 0.001 * 44 15 (34.1%) 29 (65.9%) 0.03 †Education ‡Primary 77 43 (55.8%) 34 (44.2%) Reference 39 13 (33.3%) 26 (66.7%) ReferenceSecondary or tertiary 41 26 (63.4%) 15 (36.6%) 0.43 17 9 (52.9%) 8 (47.1%) 0.17Child ≤ 18 years 38 27 (71.1%) 11 (28.9%) 0.12 5 4 (80.0%) 1 (20.0%) 0.08No formal education 23 12 (52.2%) 11 (47.8%) 0.76 10 5 (50.0%) 5 (50.0%) 0.33Occupation ‡Housewife 56 31 (55.4%) 25 (44.6%) Reference 22 8 (36.4%) 14 (63.6%) ReferenceStudent 38 27 (71.1%) 11 (28.9%) 0.13 5 4 (80.0%) 1 (20.0%) 0.11Fisherman 24 13 (54.2%) 11 (45.8%) 0.92 16 7 (43.8%) 9 (56.3%) 0.65Unemployed 14 10 (71.4%) 4 (28.6%) 0.28 8 3 (37.5%) 5 (62.5%) 0.95Bus<strong>in</strong>essman 12 5 (41.7%) 7 (58.3%) 0.70 4 1 (25.0%) 3 (75.0%) 0.44Retired 10 7 (70.0%) 3 (30.0%) 0.39 4 3 (75.0%) 1 (25.0%) 0.66Other 25 15 (60.0%) 10 (40.0%) 0.39 12 6 (50.0%) 6 (50.0%) 0.18* Liv<strong>in</strong>g <strong>in</strong> area B was reta<strong>in</strong>ed <strong>in</strong> the f<strong>in</strong>al regression model as a predictor <strong>of</strong> be<strong>in</strong>g symptomatic (adjusted odds ratio = 3.4; 95% confidence <strong>in</strong>tervals = 1.8–6.4; P < 0.001).† Liv<strong>in</strong>g <strong>in</strong> area B was reta<strong>in</strong>ed <strong>in</strong> the f<strong>in</strong>al regression model as a predictor <strong>of</strong> be<strong>in</strong>g seropositive for CHIKV (adjusted odds ratio = 3.0; 95% confidence <strong>in</strong>tervals = 1.1–7.9; P = 0.029).‡ Data is miss<strong>in</strong>g for one patient.
CHIKUNGUNYA IN BAGAN PANCHOR, MALAYSIA1247Table 2Cl<strong>in</strong>ical features <strong>of</strong> seropositive residents with laboratory-confirmed<strong>Chikungunya</strong> <strong>in</strong>fection ( N = 40)Symptomatic and seropositive cases were reported throughoutthe village, although there were more cases <strong>in</strong> the northwesternhalf by the mouth <strong>of</strong> the river (area B <strong>in</strong> Figure 1 ),which had more dense hous<strong>in</strong>g, the jetty, shops, and restaurants.This was confirmed by multivariate analyses; the only significant<strong>in</strong>dependent demographic predictor <strong>of</strong> both symptomaticdisease and seropositivity was residence <strong>in</strong> area B ( Table 1 ).Other demographics such as age, sex, education background,and occupation were not significant predictors.The cl<strong>in</strong>ical features <strong>of</strong> the 40 seropositive residents areshown <strong>in</strong> Table 2 . Of the 33 symptomatic cases, the most commonsymptoms were arthralgia (90.9%), fever (75.8%), andrash (63.6%). The most frequently affected jo<strong>in</strong>ts were knees,ankles, elbows, and wrists. Of the 30 seropositive cases report<strong>in</strong>garthralgia, 29 stated that jo<strong>in</strong>t symptoms lasted for amedian <strong>of</strong> 14 days (range = 2–100 days).Two (5.0%) seropositive people reported dependence onothers for self-care activities such as us<strong>in</strong>g the toilet and dress<strong>in</strong>g,and one <strong>of</strong> two people required a wheelchair. This dependencewas temporary, last<strong>in</strong>g between 3 and 30 days. Only one<strong>of</strong> the seropositive residents, who had arthralgia symptoms for100 days, reported concurrent depressive symptoms <strong>of</strong> loss <strong>of</strong><strong>in</strong>terest and tiredness; this was <strong>in</strong>sufficient to meet the criteriafor a major depressive episode.DISCUSSIONNumber/total %Asymptomatic 7/40 17.5Symptomatic 33/40 82.5Arthralgia 30/33 90.9Knees 22/30 73.3Ankles 20/30 66.7Elbows 20/30 66.7Wrists 15/30 50.0F<strong>in</strong>gers 12/30 40.0Shoulders 6/30 20.0Sp<strong>in</strong>e 2/30 6.7Fever 25/33 75.8Rash 21/33 63.6Myalgia 16/33 48.5Headache 10/33 30.3Pruritus 8/33 24.2Nausea 1/33 3.0Bleed<strong>in</strong>g 0/33 0This study is the first seroprevalence study to be performed<strong>in</strong> Malaysia s<strong>in</strong>ce the 1960s, when “a very low level <strong>of</strong> populationimmunity” was found <strong>in</strong> the western states, <strong>in</strong>clud<strong>in</strong>gPerak. 10 A total <strong>of</strong> 72 <strong>Bagan</strong> <strong>Panchor</strong> residents were tested,which is higher than the 63 tested dur<strong>in</strong>g the outbreak. 2, 3Compared with the contemporary Indian Ocean outbreaks,the attack rate <strong>in</strong> <strong>Bagan</strong> <strong>Panchor</strong> <strong>of</strong> 55.6% was higher thanthe rates <strong>in</strong> Mayotte 11 and Réunion Island 12 but lower than therates <strong>in</strong> the Comoros 13 and Lamu Island <strong>in</strong> Kenya 14 ( Table 3 ).The <strong>Bagan</strong> <strong>Panchor</strong> rate may overestimate the true attack rate,because symptomatic participants were more likely to agreeto test<strong>in</strong>g than the asymptomatic participants (53.5% versus31.2%; χ 2 = 8.9, P = 0.003). Differences <strong>in</strong> attack rates arelikely caused by local factors, <strong>in</strong>clud<strong>in</strong>g population immunityand genetic susceptibility, vector competence, environmentalsett<strong>in</strong>gs, and effectiveness <strong>of</strong> outbreak control measures.These may also vary with<strong>in</strong> the same locality. We found thatresidence <strong>in</strong> the northwestern half <strong>of</strong> the village, where thema<strong>in</strong> commercial activities and a greater density <strong>of</strong> hous<strong>in</strong>gwere located, predicted symptomatic disease and seropositivity.We did not explicitly study the reasons for this <strong>in</strong> <strong>Bagan</strong><strong>Panchor</strong>, but it is likely that social and environmental factorscontributed. For example, <strong>in</strong> Mayotte, CHIKV seroprevalencewas higher <strong>in</strong> households with structural risk factors for mosquitobreed<strong>in</strong>g or exposure, such as open yards and outdoortoilets. 17 In two neighborhoods <strong>in</strong> Rio de Janeiro, the highestseroprevalence <strong>of</strong> dengue was seen <strong>in</strong> the busiest areas, whereshops, schools, and transport hubs were located. 18The asymptomatic rate <strong>of</strong> 17.5% <strong>in</strong> our sample is with<strong>in</strong> therange <strong>of</strong> 16.7–27.8% reported <strong>in</strong> other studies. 11,12,15,16 This rateis much lower than that <strong>of</strong> dengue, which has asymptomaticrates <strong>of</strong> over 70%. 18, 19 In the present study, 33 <strong>of</strong> 38 (86.8%)symptomatic participants were seropositive, similar to the 53<strong>of</strong> 63 (84.1%) symptomatic cases with laboratory-confirmedCHIKV <strong>in</strong>fection reported dur<strong>in</strong>g the outbreak. 2, 3 Some <strong>of</strong>the suspected cases could be caused by other <strong>in</strong>fections giv<strong>in</strong>gsimilar cl<strong>in</strong>ical symptoms, such as dengue. Symptom-basedsurveillance is, therefore, not enough to accurately determ<strong>in</strong>ethe attack rate dur<strong>in</strong>g CHIKV outbreaks, and asymptomaticpeople must also be tested. Asymptomatic cases wouldhave played a role <strong>in</strong> community transmission, because theywould not be conf<strong>in</strong>ed to their homes like ill cases and wouldrema<strong>in</strong> mobile and active dur<strong>in</strong>g their viremic stage.The acute symptoms reported <strong>in</strong> this study were similar toother outbreaks. Long-term sequelae, especially arthralgia,have been reported <strong>in</strong> uncontrolled studies. 20 However, theonly study to date us<strong>in</strong>g matched controls found that CHIKV<strong>in</strong>fectedpatients had only slightly reduced physical scoresfor quality <strong>of</strong> life, with no impact on medical care received ormental scores. 21 In support <strong>of</strong> this, we found no residual physicaldependence or depression <strong>in</strong> our sample. This supports theTable 3Laboratory-confirmed attack rates and symptomatic:asymptomatic case ratios reported <strong>in</strong> previous CHIKV outbreaksSite (year <strong>of</strong> outbreak) CHIKV genotype *Estimatedpopulation sizeSample size testedfor CHIKV (%) Attack rate (%)Asymptomaticrate (%)Symptomatic:asymptomatic ratioReference<strong>Bagan</strong> <strong>Panchor</strong>, Malaysia (2006) Asian 1,500 72 (4.8) 55.6 17.5 4.7 This studyCastiglione di Cervia, Italy (2007) CEA 2,000 325 (16.3) 10.2 17.9 4.6 15Mayotte (2006) CEA 175,000 1,154 (0.7) 37.2 27.8 2.6 11Réunion Island (2005–2006) CEA 787,836 2,442 (0.3) 38.2 16.7 5.0 12Grande Comore, Comoros (2005) CEA 340,000 331 (0.9) 63 – – 13Lamu Island, Kenya (2004) CEA 18,000 288 (1.6) 75 – – 14Barangay Pulo, Philipp<strong>in</strong>es (1996) Unknown(probably Asian) 500 298 (59.6) 65.5 23.3 3.3 16* CEA = Central/East African.