The GeneCycle Package - NexTag Supports Open Source Initiatives
The GeneCycle Package - NexTag Supports Open Source Initiatives
The GeneCycle Package - NexTag Supports Open Source Initiatives
Create successful ePaper yourself
Turn your PDF publications into a flip-book with our unique Google optimized e-Paper software.
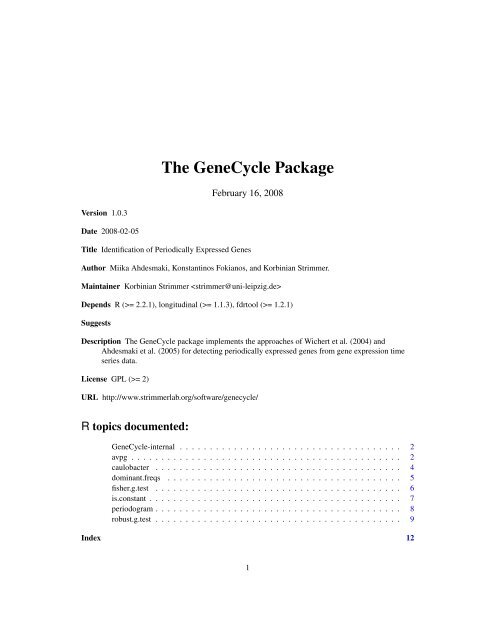
<strong>The</strong> <strong>GeneCycle</strong> <strong>Package</strong>February 16, 2008Version 1.0.3Date 2008-02-05Title Identification of Periodically Expressed GenesAuthor Miika Ahdesmaki, Konstantinos Fokianos, and Korbinian Strimmer.Maintainer Korbinian Strimmer Depends R (>= 2.2.1), longitudinal (>= 1.1.3), fdrtool (>= 1.2.1)SuggestsDescription <strong>The</strong> <strong>GeneCycle</strong> package implements the approaches of Wichert et al. (2004) andAhdesmaki et al. (2005) for detecting periodically expressed genes from gene expression timeseries data.License GPL (>= 2)URL http://www.strimmerlab.org/software/genecycle/R topics documented:<strong>GeneCycle</strong>-internal . . . . . . . . . . . . . . . . . . . . . . . . . . . . . . . . . . . . . 2avpg . . . . . . . . . . . . . . . . . . . . . . . . . . . . . . . . . . . . . . . . . . . . . 2caulobacter . . . . . . . . . . . . . . . . . . . . . . . . . . . . . . . . . . . . . . . . . 4dominant.freqs . . . . . . . . . . . . . . . . . . . . . . . . . . . . . . . . . . . . . . . 5fisher.g.test . . . . . . . . . . . . . . . . . . . . . . . . . . . . . . . . . . . . . . . . . 6is.constant . . . . . . . . . . . . . . . . . . . . . . . . . . . . . . . . . . . . . . . . . . 7periodogram . . . . . . . . . . . . . . . . . . . . . . . . . . . . . . . . . . . . . . . . . 8robust.g.test . . . . . . . . . . . . . . . . . . . . . . . . . . . . . . . . . . . . . . . . . 9Index 121
2 avpg<strong>GeneCycle</strong>-internal Internal <strong>GeneCycle</strong> FunctionsDescriptionInternal <strong>GeneCycle</strong> functions.Note<strong>The</strong>se are not to be called by the user (or in some cases are just waiting for proper documentationto be written).avpgAverage Periodogram for Multiple (Genetic) Time SeriesDescriptionavgp calculates and plots the average periodogram as described in Wichert, Fokianos and Strimmer(2004).Usageavgp(x, title = deparse(substitute(x)), plot = TRUE, angular = FALSE, ...)Argumentsxtitleplotangularmultiple (genetic) time series data. Each column of this matrix corresponds toa separate variable/time seriesname of the data set (default is the name of the data object)plot the average periodogram?convert frequencies to angular frequencies?... arguments passed to plot and to periodogramDetails<strong>The</strong> average periodogram is simply the frequency-wise average of the spectral density (as estimatedby the Fourier transform) over all times series. To calculate the average periodogram the functionperiodogram is used. See Wichert, Fokianos and Strimmer (2004) for more details.
avpg 3ValueA list object with the following components:freqavg.spectitleA vector with the discrete Fourier frequencies (see periodogram). If theoption angular=TRUE then the output are angular frequencies (2*pi*f).A vector with the average power spectral density at each frequency.Name of the data set underlying the average periodogram.<strong>The</strong> result is returned invisibly if plot is true.Author(s)Konstantinos Fokianos (http://www.ucy.ac.cy/~fokianos/) and Korbinian Strimmer(http://strimmerlab.org).ReferencesWichert, S., Fokianos, K., and Strimmer, K. (2004). Identifying periodically expressed transcriptsin microarray time series data. Bioinformatics 20:5-20.See Alsoperiodogram, spectrum.Examples# load <strong>GeneCycle</strong> librarylibrary("<strong>GeneCycle</strong>")# load data setdata(caulobacter)# how many samples and how many genes?dim(caulobacter)# average periodogramavgp.caulobacter
4 caulobactercaulobacterMicroarray Time Series Data for 1444 Caulobacter Crescentus GenesDescriptionThis data set describes the temporal expression of 1444 genes (open reading frames) in the cellcycle of the bacterium Caulobacter crescentus.Usagedata(caulobacter)Formatcaulobacter is a longitudinal object containing the data from the Laub et al. (2000)experiment. Essentially, this is a matrix with with 1444 columns (=genes) and 11 rows (=timepoints)<strong>Source</strong>This data is described in Laub et al. (2000) and can be freely downloaded from (http://caulobacter.stanford.edu/CellCycle/DownloadData.htm).ReferencesLaub, M.T., McAdams, H.H., Feldblyum, Fraser, C.M., and Shapiro, L. (2000) Global analysis ofthe genetic network controlling a bacterial cell cycle. Science, 290, 2144–1248.Examples# load <strong>GeneCycle</strong> librarylibrary("<strong>GeneCycle</strong>")# load data setdata(caulobacter)is.longitudinal(caulobacter)# how many samples and how many genes?dim(caulobacter)summary(caulobacter)get.time.repeats(caulobacter)# plot first nine time seriesplot(caulobacter, 1:9)
dominant.freqs 5dominant.freqsDominant Frequencies in Multiple (Genetic) Time SeriesDescriptiondominant.freqs returns the m dominant frequencies (highest peaks) in each of the periodogramcomputed for the individual time series.Usagedominant.freqs(x, m=1, ...)ArgumentsxmValuemultivariate (genetic) time series (each column of this matrix corresponds to aseparate variable/time series), or a vector with a single time seriesnumber of dominant frequences... arguments passed to periodogramA matrix (or vector, if only 1 time series is considered) with the dominant frequencies. In a matrix,each column corresponds to one time series.Author(s)Konstantinos Fokianos (http://www.ucy.ac.cy/~fokianos/) and Korbinian Strimmer(http://strimmerlab.org).See Alsoperiodogram, spectrum.Examples# load <strong>GeneCycle</strong> librarylibrary("<strong>GeneCycle</strong>")# load data setdata(caulobacter)# how many samples and how many genes?dim(caulobacter)# first three dominant frequencies for each genedominant.freqs(caulobacter, 3)# first four dominant frequencies for gene no. 1000dominant.freqs(caulobacter[,1000], 4)
6 fisher.g.testfisher.g.testFisher’s Exact g Test for Multiple (Genetic) Time SeriesDescriptionfisher.g.test calculates the p-value(s) according to Fisher’s exact g test for one or more timeseries. This test is useful to detect hidden periodicities of unknown frequency in a data set. For anapplication to microarray data see Wichert, Fokianos, and Strimmer (2004).Usagefisher.g.test(x, ...)Argumentsxvector or matrix with time series data (one time series per column).... arguments passed to periodogramDetailsFisher (1929) devised an exact procedure to test the null hypothesis of Gaussian white noise againstthe alternative of an added deterministic periodic component of unspecified frequency. <strong>The</strong> basicidea behind the test is to reject the null hypothesis if the periodogram contains a value significantlylarger than the average value (cf. Brockwell and Davis, 1991). This test is useful in the contextof microarray genetic time series analysis as a gene selection method - see Wichert, Fokianos andStrimmer (2004) for more details. Note that in the special case of a constant time series the p-valuereturned by fisher.g.test is exactly 1 (i.e. the null hypothesis is not rejected).ValueA vector of p-values (one for each time series). Multiple testing may then be done using the thefalse discover rate approach (function fdrtool).Author(s)Konstantinos Fokianos (http://www.ucy.ac.cy/~fokianos/) and Korbinian Strimmer(http://strimmerlab.org).ReferencesFisher, R.A. (1929). Tests of significance in harmonic analysis. Proc. Roy. Soc. A, 125, 54–59.Brockwell, P.J., and Davis, R.A. (1991). Time Series: <strong>The</strong>ory and Methods (2nd ed). SpringerVerlag. (the g-test is discussed in section 10.2).Wichert, S., Fokianos, K., and Strimmer, K. (2004). Identifying periodically expressed transcriptsin microarray time series data. Bioinformatics 20:5-20.
is.constant 7See Alsofdrtool.Examples# load <strong>GeneCycle</strong> librarylibrary("<strong>GeneCycle</strong>")# load data setdata(caulobacter)# how many samples and and how many genes?dim(caulobacter)# p-values from Fisher's g testpval.caulobacter
8 periodogramExamples# load <strong>GeneCycle</strong> librarylibrary("<strong>GeneCycle</strong>")# load data setdata(caulobacter)# any constant genes?sum(is.constant(caulobacter))# but here:series.1
obust.g.test 9freqA vector with frequencies f ranging from 0 to fc (if the sampling rate frequency(x))equals 1 then fc = 0.5). Angular frequencies may be obtained by multiplicationwith 2*pi (i.e. omega = 2*pi*f).Author(s)Konstantinos Fokianos (http://www.ucy.ac.cy/~fokianos/) and Korbinian Strimmer(http://strimmerlab.org).See Alsospectrum, avgp, fisher.g.test.Examples# load <strong>GeneCycle</strong> librarylibrary("<strong>GeneCycle</strong>")# load data setdata(caulobacter)# how many genes and how many samples?dim(caulobacter)# periodograms of the first 10 genesperiodogram(caulobacter[,1:10])robust.g.testRobust g Test for Multiple (Genetic) Time SeriesDescriptionrobust.g.test calculates the p-value(s) for a robust nonparametric version of Fisher’s g-test(1929). Details of this approach are described in Ahdesmaki et al. (2005), along with an extensivediscussion of its application to gene expression data.g.statistic computes the test statistic given a discrete time series spectrum.robust.spectrum computes a robust rank-based estimate of the periodogram/correlogram - seeAhdesmaki et al. (2005) for details.Usagerobust.g.test(y, index, perm = FALSE, x, noOfPermutations = 5000)g.statistic(y, index)robust.spectrum(x)
10 robust.g.testArgumentsyxDetailsValueindexthe matrix consisting of the spectral estimates as column vectorsa matrix consisting of the time series as column vectors. In robust.g.testonly needed if permutation tests are usedan index to the spectral estimates that is to be used in the testing for periodicity.If index is missing, the maximum component of the spectral estimate is usedin testing (regardless of the frequency of this maximum)permif perm is FALSE, a simulated distribution for the g-statistic is used. If perperm is TRUE, permutation tests are used to find the distribution of the g-statistic for each time series separately.noOfPermutationsnumber of permutations that are used for each time series (default = 5000)Application of robust.g.test can be very computer intensive, especially the production of thedistribution of the test statistics may take a lot of time. <strong>The</strong>refore, this distribution (dependeningon the length of the time series) is stored in an external file to avoid recomputation (see examplebelow).For the general idea behind the Fisher’s g test also see fisher.g.test which implements ananalytic approach for g-testing. This is faster but not robust and also assumes Gaussian noise.robust.g.test returns a list of p-values, and g.statistic the associated test statistics.robust.spectrum returns a matrix where the column vectors correspond to the spectra correspondingto each time series.Author(s)Miika Ahdesmaki (〈miika.ahdesmaki@tut.fi〉).ReferencesFisher, R.A. (1929). Tests of significance in harmonic analysis. Proc. Roy. Soc. A, 125, 54–59.Ahdesmaki, M., Lahdesmaki, H., Peason, R., Huttunen, H., and Yli-Harja O. (2005). BMC Bioinformatics6:117.See Alsofdrtool, fisher.g.test.Examples## Not run:# load <strong>GeneCycle</strong> librarylibrary("<strong>GeneCycle</strong>")
obust.g.test 11# load data setdata(caulobacter)# how many samples and and how many genes?dim(caulobacter)# robust, rank-based spectral estimator applied to first 5 genesspe5
Index∗Topic datasetscaulobacter, 3∗Topic htestfisher.g.test, 5robust.g.test, 9∗Topic internal<strong>GeneCycle</strong>-internal, 1∗Topic tsavpg, 2dominant.freqs, 4is.constant, 6periodogram, 7avgp, 7, 8avgp (avpg), 2avpg, 2periodogram, 2–5, 7periodogram.freq(<strong>GeneCycle</strong>-internal), 1periodogram.spec(<strong>GeneCycle</strong>-internal), 1plot, 2robust.g.test, 9robust.spectrum (robust.g.test), 9robust.spectrum.single(<strong>GeneCycle</strong>-internal), 1spearman (<strong>GeneCycle</strong>-internal), 1spectrum, 3, 4, 7, 8caulobacter, 3dominant.freqs, 4dominant.freqs.single(<strong>GeneCycle</strong>-internal), 1fdrtool, 5, 6, 10fft, 8fisher.g.test, 5, 7–10fisher.g.test.single(<strong>GeneCycle</strong>-internal), 1frequency, 7, 8g.statistic (robust.g.test), 9<strong>GeneCycle</strong>-internal, 1gPopCreate (<strong>GeneCycle</strong>-internal), 1is.constant, 6is.constant.single(<strong>GeneCycle</strong>-internal), 1longitudinal, 3myresample (<strong>GeneCycle</strong>-internal), 112


