The qpcR Package - NexTag Supports Open Source Initiatives
The qpcR Package - NexTag Supports Open Source Initiatives
The qpcR Package - NexTag Supports Open Source Initiatives
Create successful ePaper yourself
Turn your PDF publications into a flip-book with our unique Google optimized e-Paper software.
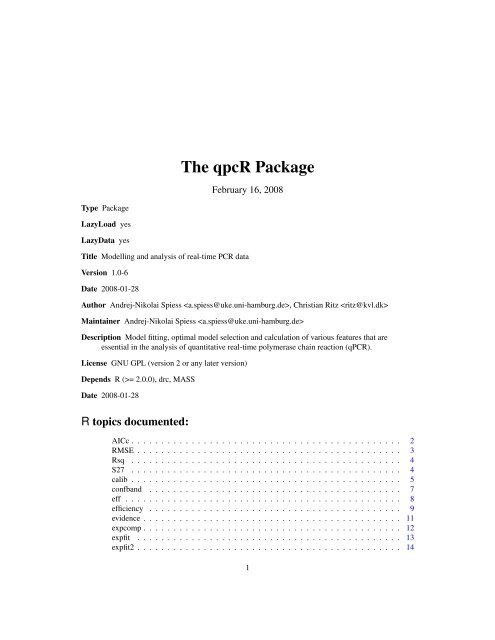
<strong>The</strong> <strong>qpcR</strong> <strong>Package</strong>February 16, 2008Type <strong>Package</strong>LazyLoad yesLazyData yesTitle Modelling and analysis of real-time PCR dataVersion 1.0-6Date 2008-01-28Author Andrej-Nikolai Spiess , Christian Ritz Maintainer Andrej-Nikolai Spiess Description Model fitting, optimal model selection and calculation of various features that areessential in the analysis of quantitative real-time polymerase chain reaction (qPCR).License GNU GPL (version 2 or any later version)Depends R (>= 2.0.0), drc, MASSDate 2008-01-28R topics documented:AICc . . . . . . . . . . . . . . . . . . . . . . . . . . . . . . . . . . . . . . . . . . . . . 2RMSE . . . . . . . . . . . . . . . . . . . . . . . . . . . . . . . . . . . . . . . . . . . . 3Rsq . . . . . . . . . . . . . . . . . . . . . . . . . . . . . . . . . . . . . . . . . . . . . 4S27 . . . . . . . . . . . . . . . . . . . . . . . . . . . . . . . . . . . . . . . . . . . . . 4calib . . . . . . . . . . . . . . . . . . . . . . . . . . . . . . . . . . . . . . . . . . . . . 5confband . . . . . . . . . . . . . . . . . . . . . . . . . . . . . . . . . . . . . . . . . . 7eff . . . . . . . . . . . . . . . . . . . . . . . . . . . . . . . . . . . . . . . . . . . . . . 8efficiency . . . . . . . . . . . . . . . . . . . . . . . . . . . . . . . . . . . . . . . . . . 9evidence . . . . . . . . . . . . . . . . . . . . . . . . . . . . . . . . . . . . . . . . . . . 11expcomp . . . . . . . . . . . . . . . . . . . . . . . . . . . . . . . . . . . . . . . . . . . 12expfit . . . . . . . . . . . . . . . . . . . . . . . . . . . . . . . . . . . . . . . . . . . . 13expfit2 . . . . . . . . . . . . . . . . . . . . . . . . . . . . . . . . . . . . . . . . . . . . 141
2 AICcmchoice . . . . . . . . . . . . . . . . . . . . . . . . . . . . . . . . . . . . . . . . . . . 15modlist . . . . . . . . . . . . . . . . . . . . . . . . . . . . . . . . . . . . . . . . . . . 16pcrGOF . . . . . . . . . . . . . . . . . . . . . . . . . . . . . . . . . . . . . . . . . . . 17pcrbatch . . . . . . . . . . . . . . . . . . . . . . . . . . . . . . . . . . . . . . . . . . . 18pcrfit . . . . . . . . . . . . . . . . . . . . . . . . . . . . . . . . . . . . . . . . . . . . . 19pcrimport . . . . . . . . . . . . . . . . . . . . . . . . . . . . . . . . . . . . . . . . . . 20pcropt1 . . . . . . . . . . . . . . . . . . . . . . . . . . . . . . . . . . . . . . . . . . . 21pcrplot . . . . . . . . . . . . . . . . . . . . . . . . . . . . . . . . . . . . . . . . . . . . 23pcrpred . . . . . . . . . . . . . . . . . . . . . . . . . . . . . . . . . . . . . . . . . . . 24<strong>qpcR</strong> . . . . . . . . . . . . . . . . . . . . . . . . . . . . . . . . . . . . . . . . . . . . . 25repform . . . . . . . . . . . . . . . . . . . . . . . . . . . . . . . . . . . . . . . . . . . 27reps . . . . . . . . . . . . . . . . . . . . . . . . . . . . . . . . . . . . . . . . . . . . . 28reps2 . . . . . . . . . . . . . . . . . . . . . . . . . . . . . . . . . . . . . . . . . . . . . 29reps3 . . . . . . . . . . . . . . . . . . . . . . . . . . . . . . . . . . . . . . . . . . . . . 30resVar . . . . . . . . . . . . . . . . . . . . . . . . . . . . . . . . . . . . . . . . . . . . 31rutledge . . . . . . . . . . . . . . . . . . . . . . . . . . . . . . . . . . . . . . . . . . . 31sliwin . . . . . . . . . . . . . . . . . . . . . . . . . . . . . . . . . . . . . . . . . . . . 32Index 34AICcAkaike’s second-order Information Criterion for small sample numbersDescriptionCalculates the second-order (corrected) Akaike information criterion for ’drc’ objects. This is amodified version of the original AIC which compensates for bias with small n. As qPCR datausually has n/par < 40 (see original reference), AICc was implemented to correct for this.UsageAICc(object)Argumentsobjectan object of class ’drc’.DetailsExtends the AIC such that AICc = AIC + 2k(k+1)n−k−1, with k = number of parameters + 1, and n =number of observations. For large n, AICc converges to AIC.Value<strong>The</strong> second-order AIC value.
RMSE 3Author(s)Andrej-Nikolai SpiessReferencesSakamoto, Y., Ishiguro, M., and Kitagawa G. (1986). Akaike Information Criterion Statistics. D.Reidel Publishing Company.Hurvich CM & Tsai CL (1989) Regression and Time Series Model Selection in Small SamplesBiometrika 76, 297-307.See AlsoAIC, logLik.Examplesm
4 S27RsqR-square of a sigmoidal fitDescriptionCalculates the R-square value of a sigmoidal fit.UsageRsq(object)Argumentsobjectan object of class ’drc’.Value<strong>The</strong> R-square value from the sigmoidal fit.Author(s)Christian RitzExamplesm
calib 5Details<strong>The</strong> real-time PCR was conducted with primers for the S27a housekeeping gene in a Lightcycler1.0 instrument (Roche Diagnostics).<strong>Source</strong>Andrej-Nikolai Spiess & Caroline Feig, Department of Andrology, University Hospital Hamburg,Germany.Examplesdata(S27)### on single datam1
6 calibArgumentsdatacyc.colf.colgroupsthreshmethoddilpredfctplotconf.levopt.minopt.plota dataframe containing the qPCR data.the column containing the cycle numbers. Defaults to the first column.the columns containing the raw fluorescence qPCR data.a factor defining replicates of the qPCR runs.the fluorescence value from which the threshold cycles are defined.the method for defining the threshold cycles. Either ’var’ for a user-defined valueor ’cpD2’ (overrides ’var’) for estimation from the second derivative maximumof the first run.a vector with the concentration (or dilution) values corresponding to the qPCRruns.a vector of threshold cycles whose concentrations are to be predicted.the model used for the threshold cycle estimation. Any sigmoidal model in the’drc’ package. Defaults to ’l5()’.logical. Defaults to TRUE. If FALSE, the values are returned.the p-value for the confidence interval. Defaults to 0.05, can be omitted withNULL.numeric. <strong>The</strong> minimal value for the regression optimization. Must be tweakedby the user.logical. If TRUE, the Fluorescence vs. AIC plot is displayed (with the best valuehighlighted).ValueA list with the following components:ctr.squaredthe calculated threshold cycles.<strong>The</strong> r-square of the linear fit.adj.r.squared<strong>The</strong> adjusted r-square of the linear fit.AICEffpredthresh.optAIC.optthe AIC value of the linear fit.the qPCR efficiency as calculated from the slope of the dilution curve.the predicted values for the data given in ’pred’.the optimal threshold value.the minimal AIC of the regression optimization.Author(s)Andrej-Nikolai Spiess
confband 7Examples###define dilutions and values to be predicted###dil
8 effAuthor(s)See AlsoAndrej-Nikolai Spiess & Christian RitzIs also implemented in the pcrplot function for plotting the confidence bands.Examplesm
efficiency 9Examplesm
10 efficiencyValueA list with the following components:effresVarAICcAICRsqcpD1cpD2cpEcpRfluoinitcfthe PCR efficiency.the residual variance.the bias-corrected Akaike Information Criterion.the Akaike Information Criterion.the R-square value.the first derivative maximum (point of inflection in ’l4’ or ’b4’ models, can beused for defining the threshold cycle).the second derivative maximum (turning point of cpD1, more often used fordefining the threshold cycle).the PCR cycle with the highest efficiency, if "maxE" method is chosen.the PCR cycle within the exponential region calculated as under ’Details’, if"expR" method is chosen.the raw fluorescence value at the point defined by type.the initial template fluorescence, i.e. F(0), calculated as under ’Details’.the conversion factor between raw fluorescence and template amount, if the latteris defined.NoteThree parameter models (’b3’ or ’l3’) do not work very well in calculating the PCR efficiency. Itis advisable not to take too many cycles of the plateau phase prior to fitting the model as this has astrong effect on the validity of the efficiency estimates.Author(s)Andrej-Nikolai Spiess & Christian RitzReferencesWeihong Liu and David A. Saint (2002) Validation of a quantitative method for real time PCRkinetics, BBRC, 294, 347 - 353.Examples## Fitting initial modelm1
evidence 11efficiency(m2, type = "maxE", shift = 1)##using the exponential regionefficiency(m2, type = "expR")## using threshold value (15.32) from PCR softwareefficiency(m2, type = 15.32)## using the first 30 cycles and a template amountm3
12 expcompExamples### compare two models, four-parameter and five-parameterm1
expfit 13expfitCalculation of PCR efficiency by fitting of an exponential model andminimization of residual varianceDescriptionUsageAn exponential model is fit to a sliding window of defined size along the qPCR data. In the windowwith minimal residual variance (or minimal AIC), the efficiency is calculated.ArgumentsDetailsValueexpfit(object, fitcyc = 5, plot = TRUE, crit = "resVar", start = 5, maxeff = 2, mobjecta ’drc’ object.fitcyc the size of the sliding window, default is 5.plotcritif TRUE the result is plotted, if FALSE the result is diplayed on the console.the criterium to be minimized. Either "resVar" or "AICc".start the cycle number to start from. Defaults to 5.maxeffmineffthe maximum allowed efficiency of the fit.the minimum allowed efficiency of the fit. See Details.<strong>The</strong> exponential growth function f(x) = b ∗ exp(k ∗ x) + e is fit to the data. To avoid good fitsin the plateau phase, the fitting procedure is stopped at cpD1 (first derivative maximum cycle). <strong>The</strong>efficiency is calculated a) from the exponential fit with E = exp(d) (Eff.fit) and b) for each cyclewithin the exponential region from the raw fluorescence values by E =F (n)F (n−1) (Eff.curve).<strong>The</strong> inital template fluorescence (F0) is derived from parameter b. Avoiding good fits in the noisyground phase can be tweaked by increasing the effmin parameter.A list with the following components:cyc.bestEff.fitEff.curveresVarAICRMSEinitmodthe ’best’ cycle with the minimized criterium.the PCR efficiency calculated from the exponential fit.the PCR efficiency for each cycle within the exponential phase. See Details.the residual variance at the best cycle.the AIC at the best cycle.the root-mean-squared error at the best cycle.the initial template fluorescence, i.e. ’F0’.the exponential model from the best fit.
14 expfit2Author(s)Andrej-Nikolai SpiessExamplesm
mchoice 15ValueA list with the following components:outlierEff.fitEff.curveresVarAICRMSEinitmodthe outlier cycle.the PCR efficiency calculated from the exponential fit.the PCR efficiency for each cycle within the exponential phase. See Details.the residual variance of the fit.the Akaike Information Criterion of the fit.the root-mean-squared-error of the fit.the initial template fluorescence, i.e. ’F0’.the exponential model from the best fit.Author(s)Andrej-Nikolai SpiessReferencesStandardized determination of real-time PCR efficiency from a single reaction set-up. Tichopad etal., Nucleic Acids Research, 2003, e122.Examplesm
16 modlistArgumentsobjectsig.levelverbosean object of class ’drc’.the significance level for the nested F-test.logical. If TRUE, the result matrix is displayed in the console.DetailsCriterion 5) cannot be used for comparison unless the models are nested. For criterion 1) the largerthe better. For criteria 2), 3) and 4): the smaller the better. <strong>The</strong> best model is chosen from the nestedF-test and returned as a new ’drc’ model.ValueA ’drc’ model of the best fit selected by the nested F-tests. <strong>The</strong> new model has an additional listitem ’retMat’ with the result matrix from the criterion tests.Author(s)Andrej-Nikolai Spiess & Christian RitzExamplesm1
pcrGOF 17DetailsValueFor a more detailed description of the functions see i.e. ’l5()’.A list with each item containing the model from each column.Author(s)Andrej-Nikolai SpiessExamples### calculate efficiencies for each run in### the 'reps' dataml
18 pcrbatchAuthor(s)Andrej-Nikolai SpiessExamplesm
pcrfit 19DetailsValue<strong>The</strong> qPCR raw data should be arranged with the cycle numbers in the first column with the name"Cycles". All subsequent columns must be plain raw data with sensible column descriptions. Ifreplicates are defined, the output will contain a numbering of groups (i.e. "group1" for the firstreplicate group). <strong>The</strong> model selection process is optional, but we advocate using this for obtainingbetter parameter estimates. Normalization has been described to improve certain qPCR analyses,but this has still to be independently evaluated.A dataframe with the results in columns containing the calculated values with descriptions and themethod used as the name prefix.Author(s)Andrej-Nikolai SpiessReferencesA standard curve based method for relative real time PCR data processing. Larionov et al., BMCBioinformatics, 6: 62.Examples## complete dataset## Not run:temp
20 pcrimportArgumentsdatathe name of the dataframe containing the variables.cyc the column number with the cycle data. Defaults to 1.fluofctDetailsValuethe column containing the raw fluorescence data.the model to be used for the analysis, with the usual ’drc’ package nomenclature.Defaults to ’l5’.This function is to be used at the single run level. Otherwise use pcrbatch.A ’drc’ model.Author(s)Andrej-Nikolai SpiessReferencesSee AlsoRitz C & Streibig JC. Bioassay analysis using R. J Stat Soft (2005), 12: 1-22.<strong>The</strong> function multdrc for more detailed model specification.Examples### simple l4() fit of F1.1 of the 'reps' datasetpcrfit(reps, 1, 2, l4())### same with five-parameter modelpcrfit(reps, 1, 2)pcrimportSimple qPCR data import function (i.e. from text files or clipboard).DescriptionUsageSimple wrapper function to easily import qPCR data from the clipboard (default) or tab-delimitedtext files.pcrimport(file = "clipboard", sep = "\t", header = TRUE, quote = "",dec = ".", colClasses = "numeric", ...)
pcropt1 21ArgumentsfilesepheaderquotedecDetailscolClassesthe name of the file which the data are to be read from (full path).the field separator character.a logical value indicating whether the file contains the names of the variables asits first line.the set of quoting characters.the character used in the file to denote decimal points.character. A vector of classes to be assumed for the columns.... further arguments to be passed on to read.table.For a more detailed description of the arguments see read.table.ValueA data frame containing a representation of the data in the file.Author(s)Andrej-Nikolai SpiessExamples### paste some Excel data into the clipboard ##### Not run:temp
22 pcropt1Usagepcropt1(object, fact = 3, opt = FALSE, ...)Argumentsobjectfactopta ’drc’ object.numeric. <strong>The</strong> multiplier for the scan border. See ’Details’.logical. If true, model selection is applied for each combination of cycles.Beware: Slow!!... other parameters to be passed on to efficiency, i.e. where to take the PCRefficiency from.DetailsIt has been shown by Rutledge (2004) that the estimation of PCR efficiency gives more realisticvalues when the number of plateau cycles are decreased. This paradigm is the basis for this function,but we also consider the cycles in the ground phase and all combinations between ground/plateaucycles. All datapoints between the lower border cpD1 - fact * (cpD1 - cpD2) and upper bordercpD1 + fact * (cpD1 - cpD2) are cycled through.ValueA dataframe with the border values, the AICc, the residual variance, the efficiency and the estimatedF(0) from the exponential and sigmoidal model.Author(s)Andrej-Nikolai SpiessReferencesSigmoidal curve fitting redefines quantitative real-time PCR with the prospective of developingautomated high-throughput applications. Rutledge RG, Nucleic Acids Research, 2004, e178.See Also<strong>The</strong> function efficiency that is called by this function.Examples## Not run:### Using one model throughoutm
pcrplot 23pcrplotPlotting PCR data with fitted curvesDescriptionUsageDisplays fitted curves and observations in the same plot window, distinguishing between curves bydifferent plot symbols and line types. Various additional features can be plotted, i.e. error bars orconfidence bands.Argumentsxpcrplot(x, ..., level = NULL, col = FALSE,conLevel, conName, grid = 100, legend, legendText, legendPos,type = "average", lty, log = "", pch, xlab, ylab, xlim, ylim,xt = NULL, xtlab = NULL, yt = NULL, ytlab = NULL,add = FALSE, confband = NULL)an object of class ’drc’.... additional arguments.levelcolconLevelvector of character strings. To plot only the curves specified by their names.either logical or a vector of colours. If TRUE default colours are used. If FALSE(default) no colours are used.numeric. Dose level below which the dose is zero (the amount of stretching onthe x-axis above zero). Default is 1e-2.conName character string. Name on x axis for dose zero. Default is ’"0"’.gridlegendlegendTextlegendPostypeltylogpchxlabylabnumeric. Number of points in the grid used for plotting the fitted curves.logical. If TRUE a legend is displayed.a character string or vector of character strings specifying the legend text.numeric vector of length 2 giving the position of the legend.a character string specifying how the originals observations should be plotted.<strong>The</strong>re are 5 options: "average" (default), "none" (only the fitted curve(s)), "obs"(only the data points), "all" or "points" (all data points), "errbar" (errorbars +-stdev).a numeric vector specifying the line types.a character string which contains ’"x"’ if the x axis is to be logarithmic, ’"y"’if the y axis is to be logarithmic and ’"xy"’ or ’"yx"’ if both axes are to belogarithmic. <strong>The</strong> default is "", which yields the original axes.a vector of plotting characters or symbols.an optional label for the x axis.an optional label for the y axis.
24 pcrpredxlimylimxtxtlabytytlabaddconfbanda numeric vector of length two, containing the lower and upper limit for the xaxis.a numeric vector of length two, containing the lower and upper limit for the yaxis.a numeric vector containing the positions of the tick marks on the x axis.a vector containing the tick marks on the x axis.a numeric vector containing the positions of the tick marks on the y axis.a vector containing the tick marks on the y axis.logical. If TRUE then add to already existing plot.numeric. <strong>The</strong> confidence level.DetailsIs an extension of the plot.drc function from the ’drc’ package.ValueAn invisible data frame with the values used for plotting the fitted curves. <strong>The</strong> first column containsthe PCR cycles, and the following columns (one for each curve) contain the fitted fluorescence data.Author(s)Christian Ritz & Andrej-Nikolai SpiessExamplesrepData
<strong>qpcR</strong> 25Usagepcrpred(object, newdata, which = c("y", "x"), ...)ArgumentsDetailsValueobjectnewdatawhicha ’drc’ object.a vector containing the values to estimate from.either "y" (default) for prediction of the raw fluorescence or "x" for predictionof the cycle number.... other parameters to be passed to the predict.drc function.Uses the predict.drc function from the ’drc’ library for estimation, if the raw fluorescencevalues are to be estimated, and the inversion function of either the llogistic or bolztmannmodels if the cycle number is to be estimated.A vector containing the estimated values.Author(s)Andrej-Nikolai Spiess and Christian RitzExamplesm
26 <strong>qpcR</strong>Details<strong>Package</strong>: <strong>qpcR</strong>Type: <strong>Package</strong>LazyLoad: yesLazyData: yesVersion: 1.0-6Date: 2008-01-28License: GNU GPL (version 2 or any later version)Depends: R (>= 2.0.0), drcURL: http://www.r-project.org; http://www.bioassay.dk; http://www.dr-spiess.de<strong>Package</strong>d: Thu Jan 17 2008; spiessBuilt: R 2.6.0; ; 2008-01-28; windowsIndex:package:<strong>qpcR</strong> Modelling and analysis of real-time PCR data.Functions:confband Confidence bands for a sigmoidal fit.confband <strong>The</strong> amplification efficiency curve of a fitted object.confband Calculation of qPCR efficiency and several other important qPCR parametersconfband Selection of the best model by nested f-tests.confband Plotting PCR data with fitted curves.confband Formatting of PCR data with or without replicates for analysis.confband Residual variance of a sigmoidal fit.confband R-square value of a sigmoidal fit.confband Calculation of PCR efficiency by the window-of-linearity method.confband Calculation of PCR efficiency by fitting of an exponential model and minimconfband Calculation of PCR efficiency by fitting of an exponential model and outliconfband Batch calculation of qPCR efficiency and several other important qPCR paraconfband Root-mean-squared-error of a sigmoidal fit.confband Calculation of qPCR efficiency by dilution curve analysis.confband Value prediction from a fitted sigmoidal model.confband Summarize measures for the goodness-of-fit.confband Comparison of several sigmodal models by RMSE within the exponential regioconfband Simple qPCR data import function (i.e. from text files, clipboard).confband Simple wrapper function for fast model fitting.confband Akaike's second-order Information Criterion for small sample numbers.confband Evidence ratio for model comparison with AIC or AICc.confband Create sigmoidal models from a dataframe and coerce them into a list.confband Optimization of efficiency and F0 estimation by combinatorial cycle eliminDatasets:confband qPCR dilution experiment with replicates (Roche Lightcycler).confband Another qPCR dilution experiment with replicates (Roche Lightcycler).
epform 27confband qPCR data from Rutledge et al (Biorad Opticon).confband qPCR data from 15 different testicular biopsies (Roche Lightcycler).confband A qPCR dilution experiment with replicates (Stratagene MXPro3000P).Author(s)Andrej-Nikolai Spiess , Christian Ritz Maintainer: Andrej-Nikolai Spiess ReferencesSee AlsoExamplesrepformFormatting of PCR data with or without replicates for analysisDescriptionUsageThis function formats the PCR data prior to the model analysis. <strong>The</strong> columns of the PCR data,that need to be in a dataframe or matrix, are defined by a factor vector in respect to cycle data andfluorescence data of (possible) replicates.Argumentsrepform(x, group)xgroupa dataframe or matrix containing the PCR data.a vector defining the data structure in respect to PCR cycles and replicated dataDetailsValue<strong>The</strong> function calls the stack function. <strong>The</strong> column containing the cycle number must be termed’0’.A dataframe that is formatted for use in the multdrc analysis.
28 repsAuthor(s)Andrej-Nikolai Spiess & Christian RitzExamplesdata(reps)### take the first five columns of the dataframe,### first column contains the cycle numbers,### the next four columns are replicatesrepData
eps2 29Examplesdata(reps)### on single datam1
30 reps3reps3 A qPCR dilution experiment with replicates (Stratagene MX-Pro3000P)DescriptionA high quality dilution experiment with six 4-fold dilutions of the cDNA, and three replicates foreach dilution.Usagedata(reps3)FormatA data frame with the PCR cycles and 21 qPCR runs with three replicates of six 4-fold dilutions.<strong>The</strong> replicates are defined by FX.Y (X = dilution number, Y = replicate number).Details<strong>The</strong> real-time PCR was conducted with primers for the S27a housekeeping gene in a MXPro3000Pinstrument (Stratagene). Data was ROX-normalized, but without smoothing.<strong>Source</strong>Heike Cappallo-Obermann, Bone Marrow Transplantation Unit, University Hospital Hamburg-Eppendorf.Examplesdata(reps3)### on single datam1
esVar 31resVarResidual variance of a sigmoidal fitDescriptionCalculates the residual variance of a sigmoidal fit.UsageresVar(object)Argumentsobjectan object of class ’drc’.Value<strong>The</strong> residual variance from the sigmoidal fit.Author(s)Christian RitzExamplesm
32 sliwinDetails<strong>The</strong> real-time PCR was conducted for a 102 bp amplicon in an Opticon2 instrument.<strong>Source</strong>Supplemental data 1 to the paper.ReferencesSigmoidal curve-fitting redefines quantitative real-time PCR with the prospective of developingautomated high-throughput applications. Rutledge RG, Nucleic Acids Research, 2004, 32, e178.Examplesdata(rutledge)### on single datam1
sliwin 33DetailsValueTo avoid fits with a high R-squared in the baseline region, the second derivative maximum is takenas a fixpoint. This value is consequently always near to the exponential region of the data and avoidsthe problem above. <strong>The</strong> efficiency is calculated by E = exp(slope), as the transformed raw datawas based on the natural logarithm. <strong>The</strong> initial template fluorescence (F0) is thus calculated byF 0 = exp(intercept).A list with the following components:effmaxrmaxinitthe maximal PCR efficiency.the maximum regression coefficient.the initial template fluorescence, i.e. ’F0’.Author(s)Andrej-Nikolai SpiessReferencesAssumption-free analysis of quantitative real-time polymerase chain reaction (PCR) data. RamakersC et al., Neuroscience Letters, 2003, 339, 62-66.Examplesm
Index∗Topic IOmodlist, 16pcrimport, 20∗Topic filemodlist, 16pcrimport, 20∗Topic modelsAICc, 1calib, 4confband, 6eff, 7efficiency, 8evidence, 10expcomp, 11expfit, 12expfit2, 13mchoice, 15pcrbatch, 17pcrfit, 19pcrGOF, 17pcropt1, 21pcrplot, 22pcrpred, 24<strong>qpcR</strong>, 25repform, 27reps, 28reps2, 28reps3, 29resVar, 30RMSE, 2Rsq, 3rutledge, 31S27, 4sliwin, 32∗Topic nonlinearAICc, 1calib, 4confband, 6eff, 7efficiency, 8evidence, 10expcomp, 11expfit, 12expfit2, 13mchoice, 15pcrbatch, 17pcrfit, 19pcrGOF, 17pcropt1, 21pcrplot, 22pcrpred, 24<strong>qpcR</strong>, 25repform, 27reps, 28reps2, 28reps3, 29resVar, 30RMSE, 2Rsq, 3rutledge, 31S27, 4sliwin, 32∗Topic package<strong>qpcR</strong>, 25AIC, 2, 11AICc, 1, 11calib, 4confband, 6, 25, 26eff, 7efficiency, 8, 17, 18, 21, 22evidence, 10expcomp, 11expfit, 12, 17expfit2, 11, 13, 17logLik, 234
INDEX 35mchoice, 15modlist, 16multdrc, 19, 20pcrbatch, 17, 19pcrfit, 19pcrGOF, 17pcrimport, 20pcropt1, 21pcrplot, 7, 22pcrpred, 24<strong>qpcR</strong>, 25read.table, 20repform, 27reps, 28reps2, 28reps3, 29resVar, 30RMSE, 2Rsq, 3rutledge, 31S27, 4sapply, 16sliwin, 17, 32


