- Page 1 and 2:
High-resolution InterferometricDiag
- Page 5 and 6:
AcknowledgementsMy supervisor Ian W
- Page 8 and 9:
6 High-harmonic generation 1256.1 D
- Page 10 and 11:
List of acronymsADK Ammosov, Delone
- Page 12 and 13:
Definitions and symbolsAll Fourier
- Page 14 and 15:
1. INTRODUCTIONprofile in space as
- Page 17 and 18:
2 BackgroundThis dissertation prese
- Page 19 and 20:
2.1 Metrology, ultrashort pulses, a
- Page 21 and 22:
2.1 Metrology, ultrashort pulses, a
- Page 23 and 24:
2.2 Formal introduction to ultrasho
- Page 25 and 26:
2.2 Formal introduction to ultrasho
- Page 27 and 28:
2.2 Formal introduction to ultrasho
- Page 29 and 30:
2.2 Formal introduction to ultrasho
- Page 31 and 32:
2.2 Formal introduction to ultrasho
- Page 33 and 34:
2.3 Introduction to ultrashort puls
- Page 35 and 36:
2.3 Introduction to ultrashort puls
- Page 37 and 38:
2.3 Introduction to ultrashort puls
- Page 39 and 40:
2.3 Introduction to ultrashort puls
- Page 41 and 42: 2.3 Introduction to ultrashort puls
- Page 43 and 44: 2.3 Introduction to ultrashort puls
- Page 45 and 46: 2.3 Introduction to ultrashort puls
- Page 47 and 48: 2.3 Introduction to ultrashort puls
- Page 49 and 50: 2.3 Introduction to ultrashort puls
- Page 51 and 52: 2.3 Introduction to ultrashort puls
- Page 53 and 54: 2.3 Introduction to ultrashort puls
- Page 55 and 56: 2.3 Introduction to ultrashort puls
- Page 57 and 58: 2.3 Introduction to ultrashort puls
- Page 59 and 60: 2.3 Introduction to ultrashort puls
- Page 61 and 62: 2.3 Introduction to ultrashort puls
- Page 63 and 64: 2.3 Introduction to ultrashort puls
- Page 65 and 66: 2.4 Extending ultrashort metrology
- Page 67 and 68: 2.4 Extending ultrashort metrology
- Page 69 and 70: 2.4 Extending ultrashort metrology
- Page 71 and 72: 2.4 Extending ultrashort metrology
- Page 73 and 74: 2.4 Extending ultrashort metrology
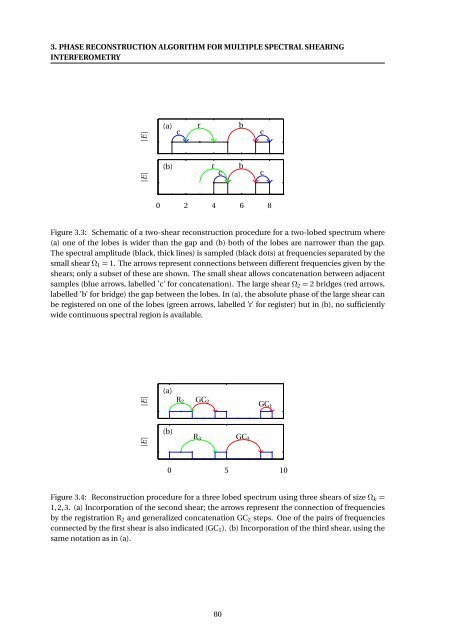
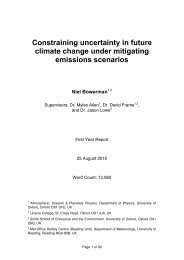
- Page 75 and 76: 3 Phase reconstruction algorithm fo
- Page 77 and 78: 3.1 Motivationration of information
- Page 79 and 80: 3.2 Quantitative noise analysis for
- Page 81 and 82: 3.3 Nature of the input datato give
- Page 83 and 84: 3.4 Sampling and uniqueness of solu
- Page 85 and 86: 3.5 Main algorithmfrom all the shea
- Page 87 and 88: 3.5 Main algorithmsituation, Γ k ,
- Page 89 and 90: 3.5 Main algorithmfor j = 1,2,...,k
- Page 91: 3.6 Implications for the relative p
- Page 95 and 96: 3.8 Signal-to-noise ratio benefit o
- Page 97 and 98: 3.9 Numerical comparison of single-
- Page 99 and 100: 3.9 Numerical comparison of single-
- Page 101 and 102: 3.9 Numerical comparison of single-
- Page 103 and 104: 3.10 Summary, critical evaluation,
- Page 105 and 106: 4 Experimental implementations of m
- Page 107 and 108: 4.1 Sequential acquisition of shear
- Page 109 and 110: 4.1 Sequential acquisition of shear
- Page 111 and 112: 4.2 Simultaneous acquisition of she
- Page 113 and 114: 4.2 Simultaneous acquisition of she
- Page 115 and 116: 4.2 Simultaneous acquisition of she
- Page 117 and 118: 5 Compact Space-time SPIDERIn this
- Page 119 and 120: 5.2 Role of the measurement planetr
- Page 121 and 122: 5.3 Analysis of ST-SPIDERof design
- Page 123 and 124: 5.4 A common-path re-imaging ST-SPI
- Page 125 and 126: 5.4 A common-path re-imaging ST-SPI
- Page 127 and 128: 5.4 A common-path re-imaging ST-SPI
- Page 129 and 130: 5.4 A common-path re-imaging ST-SPI
- Page 131 and 132: 5.5 Experimental exampleRomero [295
- Page 133 and 134: 5.6 Effect of miscalibrationy (pix)
- Page 135: 5.7 Summary and outlooknow perform
- Page 138 and 139: 6. HIGH-HARMONIC GENERATIONcurrent
- Page 140 and 141: 6. HIGH-HARMONIC GENERATIONcomponen
- Page 142 and 143:
6. HIGH-HARMONIC GENERATION00−I p
- Page 144 and 145:
6. HIGH-HARMONIC GENERATION (t ) (E
- Page 146 and 147:
6. HIGH-HARMONIC GENERATIONstationa
- Page 148 and 149:
6. HIGH-HARMONIC GENERATION10080log
- Page 150 and 151:
6. HIGH-HARMONIC GENERATIONwhere re
- Page 152 and 153:
6. HIGH-HARMONIC GENERATION• Sadd
- Page 154 and 155:
6. HIGH-HARMONIC GENERATIONgiven in
- Page 156 and 157:
6. HIGH-HARMONIC GENERATIONderivati
- Page 158 and 159:
6. HIGH-HARMONIC GENERATIONPhase ma
- Page 160 and 161:
6. HIGH-HARMONIC GENERATION30(S31)2
- Page 162 and 163:
6. HIGH-HARMONIC GENERATIONwhere W
- Page 164 and 165:
6. HIGH-HARMONIC GENERATIONtheir re
- Page 166 and 167:
6. HIGH-HARMONIC GENERATIONsmall pi
- Page 168 and 169:
7. LATERAL SHEARING INTERFEROMETRY
- Page 170 and 171:
7. LATERAL SHEARING INTERFEROMETRY
- Page 172 and 173:
7. LATERAL SHEARING INTERFEROMETRY
- Page 174 and 175:
7. LATERAL SHEARING INTERFEROMETRY
- Page 176 and 177:
7. LATERAL SHEARING INTERFEROMETRY
- Page 178 and 179:
7. LATERAL SHEARING INTERFEROMETRY
- Page 180 and 181:
7. LATERAL SHEARING INTERFEROMETRY
- Page 182 and 183:
7. LATERAL SHEARING INTERFEROMETRY
- Page 184 and 185:
7. LATERAL SHEARING INTERFEROMETRY
- Page 186 and 187:
7. LATERAL SHEARING INTERFEROMETRY
- Page 188 and 189:
7. LATERAL SHEARING INTERFEROMETRY
- Page 190 and 191:
7. LATERAL SHEARING INTERFEROMETRY
- Page 192 and 193:
7. LATERAL SHEARING INTERFEROMETRY
- Page 194 and 195:
7. LATERAL SHEARING INTERFEROMETRY
- Page 196 and 197:
7. LATERAL SHEARING INTERFEROMETRY
- Page 198 and 199:
8. QUANTUM-PATH INTERFEROMETRY IN H
- Page 200 and 201:
8. QUANTUM-PATH INTERFEROMETRY IN H
- Page 202 and 203:
8. QUANTUM-PATH INTERFEROMETRY IN H
- Page 204 and 205:
8. QUANTUM-PATH INTERFEROMETRY IN H
- Page 206 and 207:
8. QUANTUM-PATH INTERFEROMETRY IN H
- Page 208 and 209:
8. QUANTUM-PATH INTERFEROMETRY IN H
- Page 210 and 211:
8. QUANTUM-PATH INTERFEROMETRY IN H
- Page 212 and 213:
8. QUANTUM-PATH INTERFEROMETRY IN H
- Page 214 and 215:
8. QUANTUM-PATH INTERFEROMETRY IN H
- Page 216 and 217:
8. QUANTUM-PATH INTERFEROMETRY IN H
- Page 218 and 219:
8. QUANTUM-PATH INTERFEROMETRY IN H
- Page 220 and 221:
8. QUANTUM-PATH INTERFEROMETRY IN H
- Page 222 and 223:
8. QUANTUM-PATH INTERFEROMETRY IN H
- Page 224 and 225:
8. QUANTUM-PATH INTERFEROMETRY IN H
- Page 226 and 227:
8. QUANTUM-PATH INTERFEROMETRY IN H
- Page 229 and 230:
9 Summary and outlookThis chapter s
- Page 231:
the vacuum chamber on the laser pul
- Page 234 and 235:
A. NOISE AND UNCERTAINTYdomain, so
- Page 236 and 237:
A. NOISE AND UNCERTAINTYUsing the i
- Page 238 and 239:
B. SIMULATION CODES FOR HIGH-HARMON
- Page 241 and 242:
References[1] Rakov, V. & Uman, M.
- Page 243 and 244:
REFERENCES247 (1999). 11[63] Stiben
- Page 245 and 246:
REFERENCES[127] Gyuzalian, R., Sogo
- Page 247 and 248:
REFERENCES[189] Kornelis, W., Biege
- Page 249 and 250:
REFERENCES[254] Geindre, J. P., Aud
- Page 251 and 252:
REFERENCES[313] L’Huillier, A. &
- Page 253 and 254:
REFERENCESPhys. Rev. Lett. 91, 1630
- Page 255 and 256:
REFERENCESMarangos, J. In Conferenc


![Extended Notes 8 [pdf]](https://img.yumpu.com/50123548/1/190x245/extended-notes-8-pdf.jpg?quality=85)
![Handout 3 [pdf] - University of Oxford Department of Physics](https://img.yumpu.com/46475432/1/190x245/handout-3-pdf-university-of-oxford-department-of-physics.jpg?quality=85)