
You also want an ePaper? Increase the reach of your titles
YUMPU automatically turns print PDFs into web optimized ePapers that Google loves.
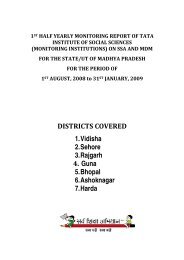
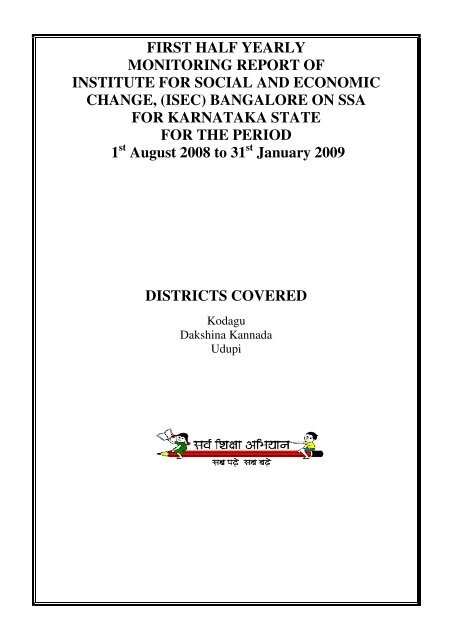
FIRST HALF YEARLY<br />
MONITORING REPORT OF<br />
INSTITUTE FOR SOCIAL AND ECONOMIC<br />
CHANGE, (ISEC) BANGALORE ON SSA<br />
FOR KARNATAKA STATE<br />
FOR THE PERIOD<br />
1 st August 2008 to 31 st January 2009<br />
DISTRICTS COVERED<br />
Kodagu<br />
Dakshina Kannada<br />
Udupi
SSA Monitoring of Kodagu District of Karnataka: A<br />
Report<br />
AWP & B FOR 2007-08<br />
Prepared by<br />
Dr. M.D.Usha Devi<br />
ISEC, Bangalore<br />
Submitted to<br />
Ministry of Human Resource Development<br />
Government of India<br />
2009<br />
1
AWP & B FOR 2007-08<br />
Preface<br />
The present monitoring report relating to Kodagu District of Karnataka is an outcome of<br />
the task assigned by the Ministry of Human Resource Development, Government of India, and<br />
the task accomplished by the Institute for Social and Economic Change, (ISEC) Bangalore for<br />
monitoring progress and implementation of SSA activities in Karnataka.<br />
The task required visiting two blocks in the district as sample blocks covering 19 schools,<br />
four BRCs and five CRCs along with capturing activities under Out of School Strategies and civil<br />
works. The monitoring task has been accomplished satisfactorily with the cooperation extended<br />
by the State Project Office, the District Project Office and the sub-district office functionaries and<br />
the project team members. In particular, Sri. Shankar, Dy.PC of Kodagu district, his predecessor,<br />
Sri. Machado and his SSA team who extended excellent support in the field at various stages of<br />
this work deserve special word of appreciation and thanks from us. The coordinator is indeed<br />
thankful to the MHRD for having given this wonderful opportunity to visit different districts,<br />
understand the implementation of SSA across the blocks in the district and to prepare reports<br />
based on the analysis of the field data captured. Our thanks are also due to the State Project<br />
Director, Director (SSA Programmes), programme officers from the state project office, SSA<br />
Mission, GoK and all those who have provided excellent cooperation in this endeavour.<br />
The coordinator is also thankful to the Director, ISEC for extending full support to carryout<br />
the SSA monitoring task. The entire project team deserves the appreciation for the professional<br />
support rendered at various stages in this huge monitoring task.<br />
The final report is prepared keeping in view the terms of reference given by the MHRD. It<br />
is hoped that the readers of this report would get a picture of how Kodagu district is performing<br />
in implementing SSA programme.<br />
2<br />
M. D. Usha Devi<br />
Coordinator, MHRD/GoI SSA<br />
Monitoring<br />
Karnataka
Project Team<br />
AWP & B FOR 2007-08<br />
3<br />
Position in the Project<br />
1 Dr. M.D.Usha Devi Coordinator & MHRD Team Lead<br />
Member, Kodagu District<br />
2 Mr. Datta Saraf<br />
3 Sri. P. Mahadeviah<br />
Desk Officer, Kodagu District<br />
Field Officer, Kodagu District<br />
4 Sri. Machaiah Field Investigator, Virajpet Block<br />
5 Sri. Janardhan Field Investigator, Madikeri Block
Preface<br />
Project Team<br />
Content page<br />
AWP & B FOR 2007-08<br />
Contents<br />
Chapter 1: District Profile and Historical Background<br />
Chapter 2: Methodology Used:<br />
2.1 Sampling Design<br />
2.2 Tools for Data Collection<br />
2.3 Strategies for Field Data Collection<br />
Chapter 3: Review of AWP&B and Analysis of Field Data<br />
4
DISTRICT PROFILE<br />
AWP & B FOR 2007-08<br />
CHAPTER 1<br />
DISTRICT ADMINISTRATIVE STRUCTURE<br />
ZILLA PANCHAYATH<br />
DEPUTY COMMISIONER CHIEF EXECUTIVE OFFICER<br />
ZILLAPANCHAYATH<br />
ASSISTANT COMMISSIONER DDPI (ADMN) & DDPI (DEV)<br />
TAHASILDARS<br />
REVENUE INPECTORS<br />
VILLAGE PANCHAYATH<br />
SECRETARIES<br />
5<br />
DYPC EDUCATION<br />
OFFICERS<br />
BLOCK EDUCATION OFFICERS<br />
APC BRC SIs<br />
BRP CRP HM'S ECs
GENERAL PROFILE<br />
1. Geographical area of the dist. in Square Kms. -4102 Sq. Kms.<br />
2. No. of Revenue blocks -03<br />
3. No. of Educational blocks -03<br />
4. No. of City corporation -01<br />
5. No. of Town Panchayath -05<br />
6. No. of Assembly constituency -03<br />
7. No. of habitations -605<br />
8. No. of villages -303<br />
9. No. of Grama Panchayath -97<br />
10. Percapita income -Rs.3535/year<br />
Kodagu is a small district having 03 taluks. The population is 5,45,322 as per 2001<br />
census. It is having a total area of 4102 Sq. kms.<br />
Physical features: Kodagu is known for its scenic beauty and attracts tourists. Madikeri the<br />
district head quarters is 1270 meters above sea level. The district has valleys, coffee and<br />
cardamom plantations. Many rivers flow here and it is the birthplace of river Kaveri<br />
Weather: The weather is cool and pleasant. It is situated in western ghats and the average rain<br />
fall is 2725mm per year.<br />
Forests: Kodagu has 410775 hectares of land out of which 134615 hectares are forests.<br />
Life style, Culture: Kodagu is a peculiar district having its own lifestyle and culture. Kodavas<br />
the native of this district have their own lifestyle and culture which is very special and attractive.<br />
Even their customs are very attractive and distinct in nature. This community has given birth to<br />
two great personalities in General Cariappa and General Thimmaiah who are very famous in our<br />
country and regarded as patriot sons of India.<br />
This district has a number of sanctuaries. The important among them are Talacauvery<br />
wild life sanctuary, Pushpagiri wildlife sanctuary, Nagarhole National park and Brahmagiri wild life<br />
sanctuary. This district has a number of tourist places to see, important among them being Irpu<br />
falls, Abbey falls, Harangi dam, Dubare forest, Thalacauvery and Igguthappa temple.<br />
The major industries of this district are coffee curing, Honey and wax products and spice<br />
industry. These industries play a pivotal role in the economy of the district.<br />
AWP & B FOR 2007-08<br />
6
SL<br />
NO<br />
BLOCK<br />
AWP & B FOR 2007-08<br />
AREA IN<br />
Sq.Kms.<br />
DEMOGRAPHIC PROFILE<br />
7<br />
POPULATION<br />
1991 2001<br />
MALE FEMALE TOTAL MALE FEMALE TOTAL<br />
1 MADIKERI 1449 64200 63200 127400 70987 71025 142012<br />
2 SOMWARPET 999 91700 90800 182500 102739 103182 205921<br />
3 VIRAJPET 1646 90900 87600 178500 101105 99523 200628<br />
TOTAL 4102 246800 241600 488400 274831 273730 548561<br />
source census 2001<br />
Though the area of Madikeri and Virajpet taluks is more than Somwarpet taluk the<br />
population in these two taluks are less due to geographical reason. However Somwarpet taluk<br />
has a denser population due to its plain surface and flat lands.<br />
Sl.No. Block Total<br />
Details of SC and ST population<br />
population<br />
Total<br />
SC<br />
Percentage Total<br />
ST<br />
Percentage<br />
1 Madikeri 142012 14582 10.26 6908 4.86<br />
2 Somwarpet 205921 31967 15.52 9201 4.46<br />
3 Virajpet 200628 20823 10.40 30006 14.95<br />
Source: Census 2001<br />
Total 548561 67422 12.29 46115 8.4<br />
It can be observed from the table that the SC population is more in Somwarpet taluk and<br />
ST population is more in Virajpet Taluk. Importance has to be given to these taluks.<br />
Sl.<br />
No. Block<br />
Comparison Rural and Urban population<br />
Rural<br />
population<br />
Urban<br />
population<br />
Total Percentage of<br />
population<br />
Rural Urban<br />
1 Madikeri 109516 32496 142012 77.11 22.89<br />
2 Somwarpet 185515 20406 205921 90.09 9.91<br />
3 Virajpet 178148 22480 200628 88.79 11.21<br />
Total 473179 75382 548561 86.25 13.75
Source: Census 2001<br />
The population in rural areas is more than urban area. Madikeri Taluk is having more<br />
urban population when compared with the other two taluks.<br />
In this district about 86.25% of the population live in rural area. This calls for more<br />
educational facilities to rural areas.<br />
AWP & B FOR 2007-08<br />
Percentage of decadal growth<br />
Sl.No. Block Decadal growth in percentage<br />
1 Madikeri + 11.09<br />
2 Somwarpet + 12.85<br />
3 Virajpet + 10.81<br />
Source: Census 2001<br />
Average + 11.65<br />
The decadal growth in population is more in Virajpet taluk. The average decadal growth is<br />
+11.65%. This increase in population demands more schooling facilities.<br />
Sl.No. Block Density<br />
Density of population and sex ratio<br />
per Sq.Km.<br />
8<br />
Sex Ratio Infant Mortality<br />
1991 2001<br />
Rate in 2001<br />
1 Madikeri 97 983 998 54<br />
2 Somwarpet 206 989 1003 56<br />
3 Virajpet 119 963 986 58<br />
Source: Census 2001<br />
Average 133 973 996 57<br />
Density of population in Somwarpet taluk is more when compared with the other two<br />
taluks. This is due to the reason that this taluk has more agricultural land and other ways of<br />
livelihood. It can be seen that the sex ratio has increased from 979 in 1991 to 996 in 2001. This<br />
is a positive trend and focus has to be made towards girls' education.<br />
Literacy Rate Of Kodagu district
Sl.No. Literacy Rate 1991 2001<br />
1 Male 75.35 83.80<br />
2 Female 61.22 72.50<br />
3 SC 55.40 60.31<br />
4 ST 29.27 36.25<br />
Source: Census 2001<br />
AWP & B FOR 2007-08<br />
Total 68.35 78.17<br />
The literacy rate of Kodagu district has increased by 9.82% in ten years. It can be seen<br />
that there is gradual increase in literacy rate of both male and female population.<br />
education.<br />
The district education profile clearly reflects the socio-economic factors which affects the<br />
9
EO's<br />
AWP & B FOR 2007-08<br />
CHAPTER III<br />
DISTRICT EDUCATIONAL PROFILE<br />
The Structure for Educational Administration Structure is as given below:<br />
GOVERNMENT OF KARNATAKA<br />
MINISTER FOR PRIMARY AND SECONDARY EDUCATION<br />
SECRETARY<br />
PRIMARY AND SECONDARY EDUCATION<br />
COMMISSIONER FOR PUBLIC INSTRUCTION<br />
DIRECTOR<br />
PRIMARY AND SECONDARY EDUCATION<br />
DDPI (Admn)<br />
DIVISIONAL JOINT DIRECTORS<br />
BEO's<br />
SI's EC's<br />
CRC BRC<br />
DyPC<br />
APC's<br />
PRIMARY AND UPPER PRIMARY SCHOOLS<br />
10<br />
DDPI (Developt)<br />
SENIOR LECTURER<br />
LECTURER<br />
SCHOOL<br />
COMPLEX<br />
SCHOOL DEVELOPMENT AND MONITORING COMMITTEE
Number of pre primary centers: 692<br />
Primary schools: 216<br />
Upper primary schools: 318<br />
High schools: 125<br />
Junior colleges: 11<br />
Degree colleges: 08<br />
Teachers' training Institutes: 05<br />
B.E.D. Colleges : 02<br />
Medical Colleges : 00<br />
Polytechniques 02<br />
Dental colleges : 01<br />
Engineering colleges : 01<br />
Educational expansion took place as per the growing need of the district. The expansion of<br />
schools in the private sector is growing rapidly when compared to government sector.<br />
In the following pages an attempt has been made to plot the growth of educational<br />
institutions with special reference to primary education in the district<br />
ACCESS: -<br />
Table: 3.1<br />
BLOCKS<br />
AWP & B FOR 2007-08<br />
TABLE SHOWING THE COVERAGE OF SCHOOLING FACILITY<br />
TOTAL NO OF HABITATIONS<br />
NO OF HABS WHICH HAVE LPS<br />
WITHIN 1 KM<br />
NO. OF UN-COVERED HABS<br />
% OF COVERAGE<br />
MADIKERI 125 122 03 97.60 124 01 99.20 125 0 100.00<br />
SOMAVARPET 337 331 06 98.81 337 0 100.00 331 06 98.21<br />
VIRAJPET 143 128 15 89.51 126 17 88.11 130 13 90.90<br />
TOTAL 605 581 22 96.36 587 18 97.00 586 19 96.85<br />
Source: - Child census<br />
11<br />
NO OF HABS WHICH HAVE UPS<br />
WITHIN 3KM<br />
NO. OF UN-COVERED HABS<br />
% OF COVERAGE<br />
NO OF HABS WHICH HAVE VIII<br />
WITH IN 5 KMS<br />
NO OF UN COVERD<br />
HABITATIONS<br />
% OF COVEREGE
The above table reveals that 96.36 % of habitations are served with primary<br />
schools 97.00 % of habitation is served with upper primary schools and 96.85 %<br />
of habitations are served with High schools<br />
Table 3.2<br />
SCHOOL INFORMATION - KODAGU DISTRICT as on 31-12-2006<br />
Madikeri Somawarpet Virajpet Total<br />
Sl.No LP UP Total LP UP Total LP UP Total LP UP Total<br />
1 Government 50 75 125 64 87 151 50 76 126 164 238 402<br />
2 Aided 1 3 4 0 2 2 1 2 3 2 7 9<br />
3 Un-aided 9 12 21 9 15 24 19 32 51 37 59 96<br />
4 Local Body/ Tribes 0 3 3 0 0 0 1 0 1 1 3 4<br />
5 Social Welfare 0 3 3 0 5 5 0 7 7 0 15 15<br />
Sl.N<br />
0<br />
Total 60 96 156 73 109 182 71 117 188 204 322 526<br />
Source: BEO Kodagu Dist<br />
TOTAL ENROLMENT PRIMARY/UPPER-PRIMARY IN KODAGU DISTRICT<br />
Block<br />
1 MADIKERI<br />
2<br />
SOMWAR<br />
PET<br />
3 VIRAJPET<br />
4 TOTAL<br />
Table 3.3<br />
Mal<br />
e<br />
114<br />
63<br />
139<br />
81<br />
123<br />
45<br />
377<br />
89<br />
AWP & B FOR 2007-08<br />
ALL SC ST Total SC/ST<br />
Fema<br />
le<br />
1146<br />
2<br />
1351<br />
3<br />
1092<br />
0<br />
3589<br />
5<br />
Tota<br />
l<br />
229<br />
25<br />
274<br />
92<br />
232<br />
65<br />
736<br />
84<br />
Mal<br />
e<br />
164<br />
0<br />
267<br />
3<br />
161<br />
9<br />
593<br />
2<br />
Source: BEO Kodagu Dist<br />
Block Population<br />
Fema<br />
le<br />
1606<br />
2476<br />
1715<br />
5797<br />
12<br />
Tota<br />
l<br />
324<br />
6<br />
514<br />
9<br />
333<br />
4<br />
117<br />
29<br />
Mal<br />
e<br />
Fema<br />
le<br />
656 681<br />
686 705<br />
290<br />
8<br />
425<br />
0<br />
2782<br />
4168<br />
Tot<br />
al<br />
133<br />
7<br />
139<br />
1<br />
569<br />
0<br />
841<br />
8<br />
SCHOOL INFORMATION - KODAGU DISTRICT<br />
No of<br />
Habitations<br />
No. of<br />
Habitation<br />
having<br />
school<br />
Mal<br />
e<br />
229<br />
6<br />
335<br />
9<br />
452<br />
7<br />
101<br />
82<br />
Fema<br />
le<br />
2287<br />
3181<br />
4497<br />
9965<br />
Tota<br />
l<br />
458<br />
3<br />
654<br />
0<br />
902<br />
4<br />
201<br />
47<br />
Access ratio<br />
per 1000<br />
population<br />
Madikeri 142012 125 124 0.87<br />
Somwarpet 205921 337 331 1.61<br />
Virajpet 200628 143 128 0.64<br />
Source: BEO Kodagu Dist
The above table revels that in an average there are 1.04 schools per 1000<br />
populations in our Distrit.<br />
Table: -3.4<br />
Blocks<br />
AWP & B FOR 2007-08<br />
UN-SERVED HABITATIONS WHICH REQUIRE SCHOOLS<br />
Total no of<br />
habitations<br />
Habitations<br />
covered with<br />
schools<br />
13<br />
Unreserved<br />
Habitations<br />
No of eligible<br />
habitations<br />
which require<br />
school<br />
LPS LPS LPS<br />
Madikeri 125 124 01 01<br />
Somavarpet 337 331 06 03<br />
Virajpet 143 128 15 02<br />
Total 605 583 22 06<br />
Source Child census 2006<br />
The above table shows that out of 605 habitations there are about 24 habitations,<br />
which do not have lower primary schools, for these habitations schooling facilities<br />
have to be provided during the planning period, but many of the habitations are<br />
not having the minimum number of children. The main reason for uncovered<br />
habitations in Kodagu district is the physical barriers such as hilly regions, forests,<br />
rivers, valleys and cliffs.<br />
FIG - 1 SCHOOLS PRIMARY
From the Fig -1, it can be seen that in Kodagu District 80% of the lower<br />
primary schools are Government schools when compared with the aided and<br />
unaided primary schools<br />
AWP & B FOR 2007-08<br />
FIG - 2 SCHOOLS - UPPER PRIMARY<br />
From the Fig -2, it can be seen that in Kodagu District the 76% of the<br />
higher primary schools are Government schools when compared with the aided<br />
and unaided primary schools<br />
Table: 3.5<br />
NUMBER OF LINGUISTIC MINORITY SCHOOLS (GOVT/AIDED)<br />
Blocks Tamil Urdu Malayalam Total<br />
Madikeri 00 00 02 02<br />
Somavarpet 00 04 00 04<br />
Virajpet 05 03 01 09<br />
Total 05 07 03 15<br />
Source: - : BEO Kodagu Dist<br />
In Kodagu the linguistic minority schools are 15. The parents are sending<br />
to these schools with a high expectation of getting education in their mother<br />
tongue But in these schools as there are no language teachers the dropouts in<br />
number more.<br />
TEACHERS' POSITION:<br />
14
Teacher is an important input in the process of education. Towards the<br />
achievement of UEE, it has been the policy of the state government to provide<br />
teachers to every school. In order to improve quality, the State government has<br />
raised the entry qualification from SSLC to PUC for DED, course, and from 2001<br />
to 2002 entrance examination is introduced for recruitment of teachers. On the<br />
lines of sound policy decision of the state government, massive recruitment of<br />
primary school teachers has taken place on a continuous basis from 1992-93<br />
onwards.<br />
NUMBER OF TEACHERS IN GOVERNMENT LOWER PRIMARY SCHOOL AND<br />
Table 3.6<br />
Block<br />
Madiker<br />
i<br />
Somwar<br />
pet<br />
PS<br />
11<br />
7<br />
17<br />
3<br />
Virajpet 14<br />
1<br />
Total 43<br />
1<br />
No. of Posts<br />
Sanctioned<br />
UP<br />
AWP & B FOR 2007-08<br />
S<br />
Tot<br />
al<br />
UPPER PRIMARY SCHOOLS<br />
Mal<br />
e<br />
Teachers working in<br />
Government schools<br />
PS UPS<br />
Fema<br />
le<br />
Mal<br />
e<br />
15<br />
Fema<br />
le<br />
Total<br />
Teachers<br />
Tot<br />
al<br />
Mal<br />
e<br />
Total<br />
Fema<br />
516 633 29 81 91 370 120 451 1:2.<br />
577 750 36 100 204 366 240 466 1:2.<br />
444 585 20 86 77 353 97 439 1:4.<br />
153<br />
7<br />
196<br />
8<br />
85 267 37<br />
Source: - : BEO Kodagu Dist<br />
2<br />
le<br />
Female<br />
Teacher<br />
PS<br />
1029 457 1356 1:3.<br />
7<br />
7<br />
3<br />
2<br />
Ratio No. of<br />
UP<br />
S<br />
1:4.<br />
1<br />
1:1.<br />
8<br />
1:4.<br />
5<br />
1:3.<br />
4<br />
Vaca<br />
nc-ies<br />
62<br />
44<br />
49<br />
155
Name of the<br />
Block<br />
NUMBER OF TEACHERS IN GOVERNMENT LOWER PRIMARY AND UPPER<br />
Table 3.7<br />
Teachers in Government<br />
Primary<br />
alone<br />
Schools<br />
Primary<br />
AWP & B FOR 2007-08<br />
+<br />
Middle<br />
PRIMARY SCHOOLS<br />
Primary<br />
+<br />
Secondary<br />
16<br />
Teachers in Government<br />
Primary<br />
along<br />
Aided Schools<br />
Primary<br />
+<br />
Middle<br />
Primary<br />
+<br />
Secondary<br />
Teachers<br />
in un-<br />
aided<br />
Schools<br />
Total<br />
No. of<br />
Teachers<br />
MADIKERI 102 445 0 6 25 0 68 646<br />
SOMWARPET 163 551 4 7 11 0 148 884<br />
VIRAJPET 102 450 2 2 4 28 193 702<br />
TOTAL 367 1446 6 15 40 28 409 2232<br />
Source: : BEO Kodagu Dist<br />
NUMBER OF TEACHERS IN AIDED LPS,HPS AND PRIMARY + SECONDARY.<br />
Table 3.8(a)<br />
Table 3.8<br />
Block<br />
Teacher Working in Aided<br />
LPS HPS<br />
Male Female Male Female<br />
Total<br />
Madikeri 00 07 05 42 54<br />
Somwarpet 00 00 00 13 13<br />
Virajpet 00 02 02 20 24<br />
Total 00 09 07 75 91<br />
Source: : BEO Kodagu Dist<br />
Block<br />
NUMBER OF TEACHERS IN UNAIDED LPS AND HPS.<br />
Teacher Working in Un-aided<br />
LPS HPS<br />
Male Female Male Female<br />
Total<br />
Madikeri 04 27 10 121 163
Somwarpet 01 22 21 85 129<br />
Virajpet 06 93 31 202 332<br />
Total 11 142 62 408 624<br />
AWP & B FOR 2007-08<br />
Source: : BEO Kodagu Dist<br />
The above table shows that 91 teachers are working in Aided schools of<br />
Kodagu District.The above table shows that 624 teachers are working in Un-<br />
Aided schools of Kodagu District.<br />
Table 3.8(b)<br />
NUMBER OF TEACHERS IN OTHER DEPARTMENTS<br />
Block<br />
Teacher Working in Other Departments<br />
LPS HPS<br />
Male Female Male Female<br />
17<br />
Total<br />
Madikeri 00 00 10 02 12<br />
Somwarpet 00 00 00 00 00<br />
Virajpet 00 00 00 00 00<br />
Total 00 00 10 02 12<br />
Source: BEO Kodagu Dist<br />
The above table shows that 12 teachers are working in Other department schools<br />
in Kodagu District.<br />
Fig -3 TEACHERS PRIMARY
Sl.<br />
No<br />
From the fig-4, we can see that 69% of the teachers are working in Government<br />
schools when compared to the aided and unaided schools.<br />
AWP & B FOR 2007-08<br />
Fig -4 TEACHERS UPPER PRIMARY<br />
From the fig-4, we can see that 70% of the teachers are working in Government<br />
schools when compared to the aided and unaided schools.<br />
For Sanctioned Posts<br />
Table 3.9<br />
Block<br />
TEACHER PUPIL RATIO OF THE DISTRICT<br />
(GOVT. DEPARTMENT OF EDUCATION)<br />
Total No. of<br />
Schools<br />
No. of schools with PTR<br />
40 >50 >60 >70 >80 >90<br />
1 MADIKERI 126 50 32 16 28 0 0 0<br />
2 SOMWARPET 151 71 40 30 10 0 0 0<br />
3 VIRAJPET 125 49 38 20 18 0 0 0<br />
Total 402 170 110 66 56 0 0 0<br />
TEACHER PUPIL RATIO OF THE DISTRICT<br />
The teacher pupil ratio of Kodagu district is 1:17 in Lower primary School and<br />
1:26 in Upper primary school with respect to sanctioned post. The teacher pupil<br />
ratio of Kodagu district is 1:19 in Lower primary School and 1:29 in Upper<br />
primary school with respect to working posts.<br />
It shows that the population is heterogeneous and mixed. Under SSA the<br />
norm is that minimum two teachers in primary and 4 teachers in UPS are to be<br />
18
posted irrespective of the strength. In Kodagu District, the teacher pupil ratio is<br />
less than the State norm.<br />
The Teacher Room Ratio of Kodagu District in Lower primary schools is<br />
1:0.98 and that of Higher Primary school is 1:0.85. According to the norms there<br />
has to be 1:1 ratio and so the district ratio is less than 1. Hence there is a need<br />
for additional classrooms and there for it is proposed in the civil works component<br />
of AWP & B 2007-08.<br />
The PTR of LPS is less in Virajpet Taluk when compared to the other two<br />
taluks. The same is less in Madikeri and Somavarpet Taluks with respect to<br />
Higher primary schools.<br />
Sl.N<br />
o.<br />
Table 3.10<br />
Name of<br />
the Block<br />
Enrollm<br />
ent of<br />
primary<br />
students<br />
in Govt.<br />
Schools<br />
AWP & B FOR 2007-08<br />
P.T.R, P.C.R and T.C.R Details<br />
Teach<br />
ers in<br />
positio<br />
n<br />
Upper Primary Schools<br />
No of<br />
Classroo<br />
ms<br />
19<br />
P.T.<br />
R.<br />
P.C.<br />
1 MADIKERI 11912 1480 614 24:1 19:1<br />
2<br />
SOMWAR<br />
PET<br />
8430 570 636 15:1 13:1<br />
3 VIRAJPET 14621 445 810 32:1 18:1<br />
TOTAL 36939 1495 2060 13:1 16:1<br />
Name of Primary Schools<br />
R<br />
T.C.<br />
R<br />
1:0.<br />
89<br />
1:0.<br />
87<br />
1:0.<br />
81<br />
1:0.<br />
85<br />
Singl<br />
e<br />
teach<br />
er<br />
schoo<br />
ls<br />
Percent<br />
age of<br />
Female<br />
teachers<br />
0 85<br />
0 80<br />
0 79<br />
0 0.813
Sl.N<br />
o.<br />
the Block Enrollm<br />
ent of<br />
primary<br />
students<br />
in Govt.<br />
Schools<br />
AWP & B FOR 2007-08<br />
Teach<br />
ers in<br />
positio<br />
n<br />
No of<br />
Classroo<br />
ms<br />
20<br />
P.T.<br />
R.<br />
P.C.<br />
1 MADIKERI 5956 95 157 15:1 38:1<br />
2<br />
SOMWAR<br />
PET<br />
9530 133 230 23:1 41:1<br />
3 VIRAJPET 5924 87 103 33:1 51:1<br />
TOTAL 25410 315 490 23:1 43:1<br />
Source BRC AND BEO<br />
R<br />
T.C.<br />
R<br />
1:0.<br />
99<br />
1:0.<br />
98<br />
1:0.<br />
96<br />
1:0.<br />
98<br />
Singl<br />
e<br />
teach<br />
er<br />
schoo<br />
ls<br />
Percent<br />
age of<br />
Female<br />
teachers<br />
12 76<br />
15 78<br />
13 80<br />
40 78<br />
The above table reveals that the pupil class room ratio is 43 :1 in case of primary<br />
schools and 16 :1 in case of upper primary schools.It is less in madikeri block .<br />
There is a need for additional rooms in case of upper primary schools.<br />
Singl School Teacher detail :<br />
There is policy in the state the school with less than 15 children will remain<br />
single school teacher so we cannot make it zero.<br />
ENROLMENT:<br />
The enrolment is not constant in a district like Kodagu because of floating<br />
population. Parents are not ready to send their wards to far off places for want of<br />
good education. The data available from EMIS 2006-07 is taken to compute the<br />
Gross Enrolment Ratio of the district. The class wise and category wise enrolment<br />
of the district is given in the following tables.<br />
Table: -3.11<br />
CHILD POPULATION 2006
Sl.<br />
No.<br />
Name of the<br />
Block<br />
AWP & B FOR 2007-08<br />
Child Population (6-11 age group) all communities<br />
Urban Rural<br />
21<br />
Total<br />
Male Female Total Male Female Total Male Female Total<br />
1 MADIKERI 1178 1709 2887 6498 5835 12333 7675 7544 15219<br />
2 SOMWARPET 1252 1230 2482 7497 7259 14756 8749 8489 17238<br />
3 VIRAJPET 1173 1148 2321 7230 6949 14182 8403 8097 16500<br />
4 Total 3603 4087 7690 21235 20043 41278 24827 24130 48957<br />
Sl.<br />
No.<br />
Child Population (6-11 age group) SC<br />
Urban Rural<br />
Total<br />
Male Female Total Male Female Total Male Female Total<br />
163 213 376 877 811 1688 1050 1024 2074<br />
166 165 321 1574 1482 3056 1740 1657 3392<br />
103 105 208 933 1012 1945 1034 1117 2151<br />
432 483 915 3384 3325 6709 3824 3798 7622<br />
Child Population (6-11 age group) ST<br />
Urban Rural<br />
Total<br />
Male Female Total Male Female Total Male Female Total<br />
26 26 52 382 399 781 408 425 833<br />
30 29 59 483 485 968 513 514 1027<br />
24 31 55 2189 2037 4226 2213 2068 4201<br />
80 86 166 3054 2921 5975 3134 3007 6041<br />
Name of the<br />
Block<br />
Child Population (11-14 age group) all<br />
communities Total<br />
Urban Rural<br />
Male Female Total Male Female Total Male Female Total<br />
1 MADIKERI 714 742 1456 3932 3745 7677 4646 4487 9183<br />
2 SOMWARPET 811 815 1626 4421 4203 8624 5232 5018 10200<br />
3 VIRAJPET 666 696 1362 3276 3227 6503 3962 3923 7865<br />
4 TOTAL 2191 2253 4444 11629 11175 22804 13820 13428 27548<br />
Child Population (11-14 age group) SC<br />
Urban Rural<br />
Total<br />
Male Female Total Male Female Total Male Female Total<br />
54 64 118 526 509 1035 580 573 1153<br />
135 112 247 788 727 1515 923 839 1762<br />
75 98 173 508 490 998 583 588 1171<br />
264 274 538 1822 1726 3548 2086 2000 4086<br />
Child Population (11-14 age group) ST<br />
Urban Rural<br />
Total
Male Female Total Male Female Total Male Female Total<br />
11 18 29 213 213 426 224 231 455<br />
14 24 38 171 170 341 185 194 379<br />
19 26 47 786 686 1472 805 714 1519<br />
44 68 114 1170 1069 2239 1214 1139 2353<br />
Source: EMIS report.<br />
growth rate of Children is -0.483%. So the Child Population is Projected to be<br />
72,672.<br />
We observe the Children population is floating in Kodagu district, as many<br />
nomads and labours come in groups with families during the Coffee picking<br />
season, stay for the time and they move out of the District after the work.<br />
The above table reveals that the child population of 6 – 14 age group is<br />
very high, almost double, as compared to the child population of 12 – 14 age<br />
group.<br />
Table: -3.12<br />
BLOCK<br />
AWP & B FOR 2007-08<br />
ENTRY RATE<br />
All SC ST<br />
B G T B G T B G T<br />
Madikeri 99.55 99.35 99.45 99.50 99.44 99.47 99.25 99.44 99.34<br />
Somwarpet 99.40 99.6 99.50 99.60 99.37 99.48 99.20 99.28 99.24<br />
Virajpet 99.05 99.07 99.06 99.20 99.20 99.20 98.5 98.5 98.5<br />
TOTAL 99.33 99.34 99.33 99.43 99.33 99.38 98.98 99.07 99.52<br />
The above table tells us that the entry rate is slightly less than 100.This is due to<br />
children either not being enrolled or not attending the schools.In our district due<br />
to seasonal migration of parents for plantation work some children do not enroll<br />
themselves school.So alternate strategies,have been chalkedout to enroll all the<br />
children to school ,the details of which is discussed elsewhere.<br />
BLOCK<br />
Table: 3.13<br />
TRANSITION RATE BLOCKWISE<br />
All SC ST<br />
B G T B G T B G T<br />
Madikeri 100 99.8 99.9 99.7 99.1 99.4 99.8 99.1 99.4<br />
22
Somwarpet 99.9 98.9 99.4 99.5 99.4 99.4 98.3 98.7 98.5<br />
Virajpet 99.7 99.1 99.4 99.7 99.2 99.4 98.6 98.5 98.5<br />
Since it is the policy of the government not to retain children in the same<br />
class the percentage of promotion to primary level to upper primary level should<br />
be 100%.But due to some children leaving the school for various reasons the<br />
percentage is slightly less than 100%.The transition rate is slightly less in case of<br />
SC & ST childrens. However these children will also be brought back to the school<br />
through various activities.<br />
Table-3.14<br />
Enrolment/<br />
Population<br />
AWP & B FOR 2007-08<br />
RETENTION RATE<br />
(Excluding students studying in 8 th standard in High School)<br />
All SC ST<br />
B G T B G T B G T<br />
1-5 th / 6-11Age 99.2 99.6 99.4 99.4 99.26 99.33 99.3 99.01 99.15<br />
6-8 th / 12-14 Age 99.3 99.32 99.31 97.2 99.55 98.37 99.07 99.00 99.04<br />
1-8 th / 6-14Age 99.2 99.46 99.35 98.3 99.40 98.85 99.18 99.01 99.09<br />
Enrolment/<br />
Population<br />
Source: EMIS 2006-07<br />
Retention Rate (R.R.):<br />
It can be observed that the retention rate is more than 98% in our<br />
District. This is due to various incentives provided by the Government to the<br />
children. An awareness has been created among the parents to send their<br />
children regularly to the schools. The drop out rate is very low when compared to<br />
other Districts.<br />
Table-3.15<br />
GROSS ENROLMENT RATIO<br />
(Excluding students studying in 8 th standard in High School)<br />
All SC ST<br />
B G T B G T B G T<br />
1-5 th / 6-11Age 101.69 101.71 101.69 100.80 101.57 101.85 103.66 104.79 104.22<br />
23
6-8 th / 12-14 Age 101.72 102.61 102.69 102.8 102.62 102.62 102.93 104.00 103.47<br />
1-8 th / 6-14Age 101.70 100.68 101.19 101.55 101.87 101.87 104.73 105.8 105.65<br />
Gross Enrolment Ratio (GER):<br />
It can be observed from the table 2.11(b) that the Gross enrolment ratio is<br />
more than 100%. This is due to the children who are either under aged or over<br />
aged studying in Primary classes. This has been calculated on the projected child<br />
population. This may increase after the real population is taken into<br />
consideration.<br />
Table-3.16<br />
Enrol-<br />
ment/ Popula-<br />
Tion<br />
AWP & B FOR 2007-08<br />
NET ENROLMENT RATIO<br />
(Excluding students studying in 8 th standard in High School)<br />
All SC ST<br />
B G T B G T B G T<br />
1-5 th / 6-11Age 98.8 99.15 98.97 87.08 84.51 85.79 73.23 78.19 78.21<br />
6-8 th / 12-14 Age 86.79 82.05 84.45 79.82 83.29 81.55 75.72 74.63 75.17<br />
1-8 th / 6-14Age 92.79 90.60 91.71 79.01 83.45 81.23 76.98 76.41 76.69<br />
Net Enrolment Ratio (NER):<br />
It can be observed from the table 2.11(c) that NER in the case of Primary<br />
classes is more than the NER in the Upper Primary classes. It is low in the case<br />
of ST boys and girls when compared to SC children. This shows that they are<br />
averaged children among ST children. This is due to the effort put by the<br />
community in general and SSA in particular to bring all the children to school<br />
24
through various activities like Chinnara Angala, special Enrolment Drive. Over<br />
aged children have also joined the school and these children should be retained in<br />
the school.<br />
Table-3.17<br />
AWP & B FOR 2007-08<br />
Details of Disabled Children of 2006-07<br />
Sl.No. Name of the<br />
Block<br />
1 Madikeri<br />
25<br />
No. of disabled children identified<br />
Boys Girls Total<br />
189 159 348<br />
2 Somawarpet 233 217 450<br />
3 Virajpet 254 180 434<br />
TOTAL 676 556 1232<br />
Note: The above table shows there are 1232 CWSN studying in primary classes.<br />
The children in 8 th Standard are only the Students in 8 th in Primary Schools and<br />
does not include those studying in 8 th of High school.<br />
Sl<br />
No<br />
Table: - 3.18<br />
Name of<br />
the Block<br />
RETENTION<br />
ALL SC ST<br />
B G T B G T B G T<br />
1 Madikeri 99.55 99.35 99.45 99.50 99.44 99.47 99.25 99.44 99.34<br />
2 Somwarpet 99.40 99.60 99.50 99.60 99.37 99.48 99.20 99.28 99.24<br />
3 Virajpet 99.05 99.07 99.06 99.20 99.20 99.20 98.50 98.50 98.50<br />
Total 99.34 99.34 99.43 99.34 99.38 98.98 99.07 99.03 99.03<br />
To achieve the goal of 100% retention in schools, provided by the state Govt<br />
many incentives are being provided by the State in the form of<br />
� Akshara Dhasoha.<br />
� Free uniforms - for all boys and girls.<br />
� Free text books - for all children<br />
� Free school bags - for all SC/ST girls of 5-7<br />
� Chinnara Karnataka Darshana - A Tour of historical Places in Karnataka.<br />
etc.
The retention rate is good in Kodagu district.The retention rate in case of SC<br />
Children is 98.98 and 99.03 in case of ST Children.<br />
DROP OUT<br />
The Dropout rate in Kodagu District is very less - 0.66%. Only 23 Boys and 24<br />
girls Dropped out from Primary Classes. 25 Boys & 21 Girls dropped out from<br />
Upper Primary classes during last year. Most of the Students dropped out belong<br />
to SC & ST, while general student form a small percent.<br />
“We are immensely happy to put forward that drop out rate is nullifying<br />
as the school is becoming attractive place for the child to learn. All this is possible<br />
because of the effective implementation of SSA activities.”<br />
Table: - 3.19<br />
Sl.N<br />
o.<br />
Name of<br />
the Block<br />
AWP & B FOR 2007-08<br />
OUT OF SCHOOL CHILDREN<br />
Population of<br />
Children in the age<br />
Male<br />
1 MADIKERI 902<br />
2<br />
SOMWAR<br />
PET<br />
3 VIRAJPET<br />
TOTAL<br />
Table: - 3.19(a)<br />
Sl.N<br />
o<br />
Name of<br />
the Block<br />
7<br />
877<br />
9<br />
507<br />
0<br />
228<br />
26<br />
group 6-11<br />
Fema<br />
le<br />
8841<br />
9181<br />
4854<br />
2287<br />
6<br />
Population of<br />
Children in the<br />
age group 12-14<br />
Tota<br />
l<br />
178<br />
68<br />
179<br />
60<br />
992<br />
4<br />
455<br />
72<br />
26<br />
Total enrolment of<br />
6-11 age group<br />
children in schools<br />
Male<br />
902<br />
7<br />
876<br />
4<br />
501<br />
4<br />
228<br />
05<br />
Fema<br />
le<br />
8841<br />
9167<br />
4818<br />
2282<br />
6<br />
Tota<br />
l<br />
178<br />
68<br />
179<br />
31<br />
983<br />
2<br />
456<br />
31<br />
Total enrolment of<br />
12-14 age group<br />
children in schools<br />
% of Out of<br />
school children<br />
Mal<br />
e<br />
Fema<br />
le<br />
Tot<br />
al<br />
0 0 0<br />
0.17 0.15<br />
1.1 0.74<br />
0.63<br />
5<br />
0.445<br />
% of Out of<br />
0.1<br />
6<br />
0.9<br />
2<br />
0.5<br />
4<br />
school children
1 MADIKERI<br />
2<br />
SOMWAR<br />
PET<br />
3 VIRAJPET<br />
TOTAL<br />
Male<br />
160<br />
518<br />
1<br />
245<br />
923<br />
AWP & B FOR 2007-08<br />
Female<br />
0 1598<br />
3977<br />
1 2448<br />
2<br />
8023<br />
Tot<br />
al Male<br />
319<br />
8<br />
915<br />
8<br />
489<br />
9<br />
172<br />
55<br />
157<br />
520<br />
7<br />
244<br />
27<br />
Female<br />
Total<br />
4 575 2149<br />
4<br />
922<br />
5<br />
Male<br />
Female<br />
Tot<br />
al<br />
0 0.43 0.43<br />
4987 10194 0 0.15 0.15<br />
2439 4883<br />
0.2<br />
8<br />
8001 17226 0.2<br />
8<br />
0.36 0.32<br />
0.44 0.3<br />
Source: - Projected Drop out based on Drop out in previous years. DPO Reports.<br />
Note : This Table does not include the information regarding the Children<br />
studying in 8 th standard in High schools.<br />
Labor department has identified 18 students (Child Labor) in the district.<br />
They are enrolled to special residential school for labor class children of which 05<br />
of them are mainstream directly to schools depending on their ability.<br />
Education department along with the other departments like child labour,<br />
social welfare, women and child welfare are joining hands and working in<br />
convergence to achieve the set target of SSA.<br />
QUALITY IMPROVEMENT:<br />
To increase the quality in education, training for in service teachers have<br />
been taken up.<br />
• ‘Chaithanya I’ and ‘Chaithanya II’ (activity based learning and teaching<br />
process) is being given for all the in service teachers<br />
• 3-days TLM training for all the primary school teachers<br />
• 3 days theatre in education for all the primary school teachers<br />
• In addition to the above trainings, creative activities like music, drama,<br />
science exhibitions; quiz programmes are organized by DSERT.<br />
• 10 day orientation programme in teaching “English” language by the<br />
Regional Institute of English<br />
Content enrichment programmes by the DIET etc.,
• To equip with the new approach of teaching and evaluation trimester<br />
training (SOURABHA) training have been given to all the teachers.<br />
• Induction training(PRERANA) for newly recruited teachers, have been<br />
taken up by the DIET to help them equip with the new trends in teaching<br />
learning process.<br />
AWP & B FOR 2007-08<br />
BASE LINE ASSESMENT SURVEY 2001-02<br />
During 2001 – 2002 the baseline assessment study has been conducted.<br />
The results of which are given in the table.<br />
Table: 3.20<br />
Subjects<br />
MEAN ACHIEVEMENT OF CHILDREN IN SCHOOL SUBJECTS<br />
Class Class Class<br />
I / II III / IV VI / VII<br />
Rural Urban Rural Urban Rural Urban<br />
Language 75.34 67.54 47.33 48.99 55.32 51.65<br />
Mathematics 76.32 73.82 58.81 41.88 37.75 49.15<br />
Science 47.89 68.38<br />
Social Science 43.43 55.81 48.85 49.65<br />
Source: - Baseline Survey<br />
The above table reveals that achievement level in this district at all<br />
levels is fairly good. Only in subject Kannada at IIIrd standard level there is low<br />
achievement level. The other subjects are satisfactory. The year 2003-04 was<br />
declared as the year of learning achievement and it is being continued for the<br />
year 2004-05.During 2005-06 achievement level has been tested by state level<br />
team in the name of KSQAO.<br />
CAPACITY BUILDING:<br />
The <strong>Sarva</strong> <strong>Shiksha</strong>na <strong>Abhiyan</strong> program is implemented through various<br />
project management structures like SDMC's, CRC's BRC's, DPO and SPO.<br />
The Block wise number of SDMC's, CRC and BRC in the district is furnished<br />
in the table below.<br />
Table: 3.21<br />
NUMBER OF BRC'S, CRC'S, SDMC'S - KODAGU DISTRICT<br />
28
l.No. Block BRC CRC SDMC<br />
1 Madikeri 01 08 127<br />
2 Somwarpet 01 07 151<br />
3 Virajpet 01 08 118<br />
AWP & B FOR 2007-08<br />
TOTAL 03 23 396<br />
Source: : BEO Kodagu Dist.<br />
State Project Office:<br />
The State Project Office has technical, academic, administrative and<br />
accounts staff to guide the district offices in the implementation of the program.<br />
It is also responsible for the quality improvement of the Program. The State<br />
Project Director conducts periodical review meetings at the state level to assess<br />
the progress of the scheme and give necessary instruction for the proper<br />
implementation of the project.<br />
District Level Office:<br />
The complete responsibility of supervising and monitoring system is<br />
done by the DDPI administration and DDPI development. Two Educational<br />
officers, five Subject Inspectors, one Inspector of Urdu schools and one district<br />
superintendent for sports assist the DDPI in administration in each educational<br />
district. For each educational block there is one Block education officer.<br />
District Project Office has 01 Deputy Project Co-ordinator, 02 Assistant<br />
Project Co-ordinator, Computer Personnel and other supporting staff who plans,<br />
implements, monitor and co-ordinate the project activities at the district level.<br />
Block Level Office:<br />
At the educational block level, Block education officer of class I junior<br />
cadre heads the range. 5 educational coordinators and office staff assist this<br />
officer. The Block resource center is headed by one co-ordinator of class II cadre<br />
and is assisted by 5 block resource persons. Out of which two are of high school<br />
teachers cadre and 3 are of primary school teacher cadre.<br />
Cluster Level Office:<br />
At the Cluster level there is 01 resource person who is of primary school<br />
teacher cadre who will assist each BRC.<br />
School Level:<br />
At the school level there is a School Development and Monitoring<br />
Committee, which is represented by 08 members headed by the parent elected<br />
29
member as president. The headmaster is the member secretary of the<br />
committee. The nominated members include retired teachers, educationists,<br />
parent of disabled, SC/ST children and self help groups. This committee overseas<br />
the physical as well as academic development of the school.<br />
DIET-District Institute Of Education & Training:<br />
The DIET headed by the DDPI development, has 7 wings (PSTE, DRU,<br />
P&M, CMDE, IFIC, WE, ET). One senior lecturer of class I junior grade heads each<br />
wing and is assisted by 2 junior lecturers of class II cadre. Each wing has specific<br />
functions like providing pre-service training, in-service training, Planning and<br />
management, evaluation, education technology, curriculum development etc.,<br />
The main functions of the DIET is training of teachers, act as resource support<br />
and conduct action research.<br />
The main programmes and activities of the DIET are:<br />
• Pre-service teacher education programme<br />
• In-service programme of primary teachers, headmasters, heads of school<br />
complexes and officers of the department up to block level.<br />
• Field interaction.<br />
• Training programs for personnel of adult and non-formal education<br />
• Training to teachers regarding Inclusive Education.<br />
• Workshops to develop curriculum, teaching learning materials, low cost<br />
teaching aid etc.,<br />
• Orientation programs for members of SDMC's, community leaders, youth<br />
and all others interested in educational activities.<br />
• Field studies, Action research and experimentation.<br />
• 42 days inclusive education for in-service teachers.<br />
In order to strengthen the teachers and community members all these<br />
trainings are organised by the DIET and BRC. To empower the community<br />
leaders, ZP, TP, GP, SDMC, Presidents and Members and for helping them to<br />
discharge their duties effectively i.e., providing guidance to Head Masters of<br />
schools and teachers in a right way trainings have been organized by DIET,<br />
BRC's, NGO's like Prajayatna and through distance education programme.<br />
AWP & B FOR 2007-08<br />
30
INFRASTRUCTURE FACILITIES:<br />
With the convergence of State level and the effort of SSA there are school<br />
which lack infrastructure facilities. The EMIS report 2004-05 shows that schools<br />
have no toilets, no electricity, no compound schools have no drinking water<br />
facility and schools have no ramps.<br />
In Kodagu district except one school in Virajpet taluk all the Govt School<br />
have their own buildings.<br />
The block wise number of schools at elementary level which requires basic<br />
infrastructure facilities is shown in the table below.<br />
School Repairs:<br />
In Kodagu district a good number of classrooms were constructed under Govt<br />
and local panchayath. Many of the classrooms in the district remain unattractive<br />
for want of maintenance and require minor repairs.<br />
TABLE SHOWING THE REQUIREMENTS OF MINOR AND MAJOR REPAIRS<br />
OF THE GOVT SCHOOLS<br />
Table: 3.22<br />
BLOCKS<br />
AWP & B FOR 2007-08<br />
TOTAL No. Of<br />
Schools (LPS<br />
+ HPS)<br />
31<br />
NO. OF ROOMS which REQUIRE<br />
MAJOR REPAIRS<br />
Madikeri 126 53<br />
Somavarpet 151 100<br />
Virajpet 125 180<br />
Total 402 233<br />
Source: BRC 2006-07<br />
This table reveals that less number of schools require minor repairs.<br />
SPECIAL FOCUS GROUP:<br />
Integrated Education For Children With Special Needs:
The goal of enrolling all children in school could be acheived only when<br />
every disabled child is enrolled. As far as these children are concerned 63<br />
children are yet to be enrolled. This task has been taken up by the NGO's.<br />
Education of SC, ST Children:<br />
Pre matric scholarships of Rs.75/- for classes 1-4 and Rs.100/- for classes<br />
5-10 are given to retain the children in schools. In this district, 18 hostels have<br />
been provided for SC, ST students with free boarding and lodging to pursue their<br />
studies. This task has been taken up by the Social Welfare Department and ITDP<br />
Department.<br />
A new program called Chinnara Karnataka Darshana has been launched in<br />
the year 2004-05 as Innovative activity under SSA. For providing these children<br />
an opportunity to appraise the rich cultural heritage of Karnataka by taking them<br />
for a 04 days tour to important tourist places of Karnataka.<br />
Girls Education:<br />
Special attention are given to these children by providing special<br />
scholarships for girls who are studying from standard 6 - 10. Girls of primary<br />
school get Rs.500/- as scholarship apart from the other eligible scholarship.<br />
A new program called Chinnara Karnataka Darshana has been launched in<br />
the year 2004-05 as Innovative activity under SSA and 2005-06 the same as<br />
been continued . For providing these children an opportunity to appraise the rich<br />
cultural heritage of Karnataka by taking them for a 05 days tour to important<br />
tourist places of Karnataka.<br />
A special strategy under Innovative activities for adolescent girls has<br />
launched by SSA in the year 2004-05 with an objective of providing awareness<br />
training<br />
regarding health, education, hygiene and life skills. For this a 03 day residential<br />
program was organized in convergence with health department, NGO's and other<br />
departments.<br />
Separate toilets have been constructed for girls under SSA to reduce<br />
dropouts and sustain them in school.<br />
Early Childhood Care And Education:<br />
Early childhood education is generally considered as the support system<br />
to primary education. The quality of input to primary education is to a great<br />
extent influenced by the effective early childcare education facilities that are<br />
AWP & B FOR 2007-08<br />
32
eing offered. Considering the importance of ECCE centers as feeding schools for<br />
pre primary schools and to reduce the dropout rate among the children for sibling<br />
care. A strategy under SSA has been developed to provide children with<br />
nutritious food, clay materials and health care for their growth. There are 692<br />
pre- primary centers run by Women and Child Welfare Department and 55 pre-<br />
primary centers are opened in the year 2004-05 in concurrence with SSA.<br />
AWP & B FOR 2007-08<br />
It is hard to meet the growing demand of the community. To cater<br />
the needs of the community and keeping in mind the long-term implications of<br />
pre-primary centers in achieving the goals of UEE, it is felt by the planning team<br />
to undertake an innovation.<br />
Most of the pre-primary schools are located in the primary school<br />
premises, thus they become the feeding schools for primary schools. This helps<br />
us to enroll all eligible 6 th age group to the primary schools.<br />
In order to achieve the goals of UEE and to improve the quality of<br />
education from elementary education to secondary, there is a well-established<br />
management structure right from School Development and Monitoring<br />
committees to the Ministry of education.<br />
33
AWP & B FOR 2007-08<br />
CHAPTER 2: Methodology<br />
In this chapter, the methodology employed by the monitoring team for<br />
data collection from the field has been described under three sections namely<br />
sampling design, tools for data collection and strategies for field data collection.<br />
The same is given in the foregoing sections.<br />
2.1 Sampling Design: As per the requirement of the TOR of the MHRD (GOI)<br />
a 5% sample of schools has to be covered for field data capturing in each district<br />
so as to represent both formal and alternative and innovative types. In order to<br />
do this, the monitoring team has employed a multi-stage, representative and<br />
systematic random sampling design based on the criteria of number, distribution<br />
of blocks and category of schools.<br />
In the first stage, 5% sample of schools was worked out for each district<br />
from out of the total number of government formal primary schools (both<br />
Lower Primary Schools and Higher Primary Schools) in the district. This gave the<br />
total number of schools that need to be covered for field visits.<br />
In the second stage, the blocks were selected from the district based on<br />
their geographical location in the district. In every district the sample size for<br />
blocks has been restricted so as to cover a minimum of 50% as it was not<br />
possible to include all the blocks for purpose of field data collection due to<br />
constraints of time, resource and quality output. However care has been taken to<br />
include blocks which are located away from the district head quarter as well as<br />
those which are within the district head quarter.<br />
In the third stage, after selecting the block, the 5% sample schools<br />
selected for the district was distributed among the sample blocks selected for field<br />
visits. The distribution was done proportionately as per the number of schools<br />
present in each of the blocks. Further the distribution has been done for both<br />
categories of Lower and Higher primary schools in the block separately. Thus the<br />
final number of schools that needed to be selected from each block and each<br />
category of primary schools in the district was obtained by this exercise.<br />
34
In the fourth stage, the actual schools for visit were selected. This was<br />
done using the EMIS school list data obtained from the State Project Office,<br />
Karnataka. The schools were selected from out of the list using systematic<br />
sampling technique so as to ensure not only unbiased selection, but also true<br />
representativeness. Thus in the final list of schools selected, care was taken to<br />
see that it included minority schools as well as EGS upgraded types.<br />
Alternative Innovative Education: In line with the requirement of the TOR by<br />
the MHRD(GOI), it was necessary to include alternative innovative education<br />
strategies in the 5% sample coverage for field monitoring. However, the<br />
monitoring team has considered this as an additional sample component over and<br />
above the 5% sample of formal schools selected in each district. Thus an<br />
additional number of 5-8 schools under this category in every district covering all<br />
types such as Residential Bridge course(RBC), NRBC (Non-Residential Bridge<br />
Course), Tent school, Mobile School, Seasonal Migration Residential School,<br />
KGBV, NPEGEL, Home based etc,. has been covered. The number of schools<br />
covered under this type is presented in the table in each of the district reports.<br />
BRC/CRC: As per the TOR by the MHRD (GOI), a minimum of 5 CRCs and 5<br />
BRCs was also to be covered in each district for SSA field monitoring. Thus from<br />
each district, 5 CRCs and 5 BRCs have been selected to capture the field data. So<br />
far as selecting the BRCs, all the sample blocks have been covered. In case of<br />
number of sample blocks selected in the district is less than five, the BRCs in the<br />
other blocks (non-sampled) have been selected on the basis of purposive<br />
randomness so as to make it 5. However, if the district had less than 5 BRCs, all<br />
the available number of BRCs has been covered including the non-sampled<br />
blocks. Similarly for selecting the 5 CRCs, a purposive random sampling<br />
technique has been used and the selection has largely been done from the<br />
sample blocks owing to the presence of sufficient number of CRCs in each block.<br />
The number of BRCs/CRCs covered is presented in the table in each of the district<br />
reports.<br />
Thus the overall sample size selected for Kodagu district is given in the following<br />
table.<br />
AWP & B FOR 2007-08<br />
35
Name<br />
of<br />
blocks<br />
selecte<br />
d<br />
Madike<br />
ri<br />
Virajpe<br />
t<br />
Total<br />
AWP & B FOR 2007-08<br />
Table 2.1: Sample Size Selected in Kodagu District<br />
No. of Schools Selected Alternative Schools<br />
LPS HPS Total<br />
3 8 11<br />
5 7 12<br />
Tent<br />
School<br />
RBC NPEG<br />
EL<br />
36<br />
Home<br />
based<br />
school<br />
Mobile<br />
School<br />
EGS KGBV<br />
- 2 - 3 - - -<br />
BRC CRC<br />
8 15 23 - 2 - 1 - - - 3 3<br />
2.2 Tools for Data Collection: As required by the TOR, for the purpose of<br />
monitoring field level data, it was necessary to collect data from different sources<br />
such as formal schools, alternative innovative education schools, CRCs, BRCs,<br />
District Project Office (DPO) and the State Project Office (SPO). This necessitated<br />
development of different kinds of tools for collecting comprehensive datasets,<br />
both in quantitative and qualitative kinds from the field. As has been mentioned<br />
earlier the field staff was oriented to collect the data using techniques such as<br />
questioning, interviewing and observing during their visits to schools. Besides,<br />
the data were also required to be gathered from several records, registers and<br />
documents maintained in the schools. Therefore, the school schedule, in<br />
particular has been designed in such a way that it lends itself for using variety of<br />
techniques while collecting data from different sources. Specific instructions have<br />
been inserted at appropriate places in the schedule to prompt the field<br />
investigator not only to collect the required data but also for using different<br />
techniques for the same.<br />
In all, five different data capture formats have been developed by the<br />
monitoring team, based on the tool given by the MHRD. The designing of these<br />
formats involved several meetings of the monitoring team members as these<br />
have been developed through participatory workshop modes. These<br />
meetings/workshops were held both at RIE, Mysore and Institute for Social and<br />
Economic Change, Bangalore. An unique feature of these formats is that they<br />
attempt to capture every single data unit specified by the TOR be it from the<br />
school, alternative school, CRC, BRC, DPO or the SPO. Further, the MS Excel<br />
design used for developing the tool renders itself for smooth data keying in and
developing analysis format for data consolidation at the block, district and the<br />
state levels as required. While the individual items in the field level data capture<br />
formats from the formal schools and the alternative innovative education schools<br />
(herein referred to as school schedule) have been rendered into regional<br />
language (Kannada), all other schedules have been retained in English language.<br />
A copy of each of the same is enclosed with the report under annexure.<br />
Description of Tools: As mentioned earlier, five different data capture formats<br />
have been developed by the monitoring team. The same is described hereunder.<br />
School Schedule: The school schedule includes main items such as opening of<br />
new schools, civil works, free text books, school grant, teacher and teacher<br />
training, teaching-learning material, children with special needs, DISE, SDMC,<br />
mid-day meals and other items such as enrolment, attendance, school health<br />
check up, evaluation scheme, school environment and facilities, co-curricular<br />
activities, learning attainments etc,. Under each one of these main items there<br />
were several sub-items, which attempted to capture specific details pertaining to<br />
the main item. In addition, the school schedule also included a master table<br />
format seeking enrolment and attendance each, class-wise, sex-wise and<br />
category-wise (general, SC, ST).<br />
The SPO Schedule : The SPO schedule includes items relating to opening of new<br />
schools, civil works, free text books, school grants, teacher and teacher training,<br />
teaching-learning materials, EGS,AIE, NRBC, RBC, children with special needs,<br />
NPEGEL, KGBV, DISE, SDMC, staffing pattern and position. Under each one of<br />
these main items there were several sub-items, which attempted to capture<br />
specific details pertaining to the main item.<br />
The DPO Schedule: The DPO schedule includes items relating to opening of<br />
new schools, civil works, free text books, school grants, teacher and teacher<br />
training, teaching-learning materials, EGS, AIE, NRBC, RBC, children with special<br />
needs, NPEGEL, KGBV, DISE, SDMC, Research and Evaluation, staffing and<br />
BRCs,CRCs. Under each one of these main items there were several sub-items,<br />
which attempted to capture specific details pertaining to the main item.<br />
BRC/CRC Schedule: The BRC/CRC schedule includes main items relating to<br />
staffing pattern and position, teacher and teacher training and children with<br />
AWP & B FOR 2007-08<br />
37
special needs. Under each one of these main items there were several sub-items,<br />
which attempted to capture specific details pertaining to the main item.<br />
Alternative Innovative Education: Under this category, separate tools have<br />
been developed for each one so as to capture the required data from the field<br />
visits along the lines of the TOR. Each one of them is described herein.<br />
NPEGEL: This schedule includes items relating to model cluster school, gender<br />
sensitive TLM, vocational education, gender empowerment for teachers,<br />
community mobilisation for girls’ education, ECCE, activity documenting format,<br />
frequency of reporting etc,. Under each one of these main items there were<br />
several sub-items, which attempted to capture specific details pertaining to the<br />
main item.<br />
KGBV: This schedule includes items relating to function, land identification, civil<br />
works, sanctioned and filled in positions, enrolment and provision of facilities<br />
including boarding and lodging arrangements and maintenance of the inmates<br />
etc,. The specific items to elicit further information relating to each one of the<br />
items are also included in the schedule.<br />
RBC/NRBC : This schedule includes items relating to enrolment, attendance,<br />
volunteers, training, mainstreamed children, infrastructure, learning attainment<br />
levels, text books, TLM etc,. the specific questions relating to each one of these<br />
items are also included in the schedule.<br />
Tent/Mobile : The same RBC/NRBC schedule has been used for collecting data<br />
relating to these types of schools with suitable modifications wherever required.<br />
EGS Upgraded: This schedule includes items relating to up gradation, building<br />
construction, civil works, teacher deployment etc,.<br />
Home Based: This schedule includes items relating to child’s profile, volunteer,<br />
education and training, mode of recruitment, monitoring support etc,.<br />
2.3 Strategies for Field Data Collection<br />
Logistic Support from the SPO/DPO: The data collection from the field<br />
involved the support and cooperation of the SSA offices right from the state level<br />
through the district level to the block and sub block levels. As such sufficient<br />
effort was made by the MI in terms of obtaining official procedural sanctions. The<br />
AWP & B FOR 2007-08<br />
38
data collection from the field by the MI team was preceded by a meeting with the<br />
SPO followed by the DPO, wherein the offices were apprised with regard to the<br />
kinds and quality of data requirement from the offices/school and the kind of<br />
logistic support to be provided to the monitoring teams during the field visits.<br />
Accordingly, the field visits were planned with prior intimation to the SPO and the<br />
DPO and after ascertaining the availability of the field functionaries for<br />
interaction with the monitoring teams during the field visits as well as for<br />
enabling the monitoring team in smooth data collection from the schools, CRCs,<br />
BRCs, Alternative & Innovative Strategies and the DPO/DIET etc,.<br />
Planning: Data collection was a challenge, as it required covering 5% of the<br />
actual number of schools in a district. As the task involved collection of data at<br />
three levels, i.e., at the state level (SPO), at District level (DPO) and at school<br />
level, the needed information was first segregated at three levels. The tools<br />
meant for data collection at state level and district levels were kept separately<br />
and the tools to be used at school level were printed in tune with the number<br />
required in every district.<br />
A separate meeting was held at Bangalore to train the field officers in<br />
understanding the requirements of data collection activity. Apart from this they<br />
were also taken to a school to actually show how different information will have<br />
to be sought and recorded. Thus, the field officers were adequately trained in the<br />
task of data collection work. This was necessary as they had the responsibility of<br />
training field level functionaries whom these field officers eventually appointed.<br />
Personnel Involved: Since the field work involved working in at least for 50<br />
working days, and covering 5% of the actual schools in every district, the<br />
monitoring institutes had no option but to appoint field functionaries. They<br />
included the following. For every district, the following was planned.<br />
Monitoring Institute to Coordinate Data Collection Work<br />
One Field Officer<br />
AWP & B FOR 2007-08<br />
One Desk Officer<br />
Four to Eight Field Investigators Per District Depending on the Number<br />
and Spread of School Coverage<br />
39
Method: The method of data collection at state, district and sub district levels<br />
varied. At the state level, the SPO was requested to facilitate the work of<br />
providing data from the state office. Similarly, cooperation was sought to gather<br />
data from the district and sub-district offices through issue of official circulars and<br />
orders. Concerned data capture formats were sent to these offices to collect the<br />
required data. Wherever possible the soft copies of the formats were sent to<br />
offices and the data were procured in soft copy formats by the MI. Efforts were<br />
also made to obtain data from the DIETs as they were also involved in SSA<br />
activities for the district.<br />
Data Quality Assurance Measure: In order to ensure quality in the datasets<br />
that were intended to be collected, all necessary precautions were kept in mind.<br />
For instance, in the inner cover page, a provision has been made where, the<br />
headmaster of the school will sign the booklet along with his seal and the field<br />
investigator also signs, after the school data are recorded. Apart from this, the<br />
data collected were physically checked, discussed and only then were received by<br />
the field officer from the field investigators. Again the monitoring institute did a<br />
sample check of some booklets and compared it with the list of sampled schools<br />
to check for any deviation. After ensuring that there was no deviation from the<br />
originally drawn set of sampled schools, they were accepted as completed work<br />
and made available to keying in into the computer.<br />
Keying in: The verified booklets were accepted for computer keying in. All the<br />
school data were keyed in. They were compiled and district profiles were<br />
prepared after integrating the data collected from the school, from the district,<br />
from the state, apart from BRCs and CRCs.<br />
Consolidation and Tabulation: Once the district profiles were developed, the<br />
consolidation work got over and the collected data were tabulated. The tabulated<br />
facts and figures became the basis for generation of the present report.<br />
Facilitating Report Writing: The basic TOR of MHRD, GOI has been the basis<br />
for undertaking the work and logically, the report also must be able to respond to<br />
the issues raised in the TOR. The tabulation and integration of information drawn<br />
from the state level, district level and sub district levels enabled and facilitated<br />
report writing work.<br />
AWP & B FOR 2007-08<br />
40
CHAPTER 3: REVIEW OF AWP&B AND ANALYSIS OF<br />
FIELD DATA<br />
1. OPENING OF SCHOOLS (BOTH PRIMARY &<br />
UPPER PRIMARY SCHOOLS)<br />
As revealed from the AWP&B, the district had planned for only 3 new primary<br />
schools in the year 2008-09 as spill over. Under this component, six regular new<br />
teachers’ salary has an approved outlay of Rs.1.440 lakhs. There is no<br />
expenditure under this as the teachers are yet to be recruited.<br />
From the DPO data it is seen that all the 3 schools are sanctioned and the work<br />
has not started as yet. 2 teachers are appointed. Out of the 41 schools, only 13<br />
schools reveal progress.<br />
From the field data, it is seen that the two new schools identified in the sample<br />
are found to be currently working under shift in another school and in community<br />
hall. In both these cases, the land has been identified and money released to<br />
SDMC. Even the TLE grant has also been released to these schools, teachers have<br />
been appointed and even the building construction is underway.<br />
2. CIVIL WORKS<br />
129 civil works reveals an outlay of Rs. 203.120 lakh. There is excellent progress<br />
with more than 93.0 per cent of the money already being spent.<br />
From the DPO data it is seen that there are 3 new schools and 41 additional<br />
classrooms in the current year. 13 out of these are reported as under progress.<br />
From the field data, it is seen that the 4 schools in the sample reveal<br />
construction work at various stages. Three of them reveal foundation and another<br />
one reveals flooring level. In all these cases, the SDMC has received both<br />
technical training and guidelines for civil works. The technical committee is in<br />
place to supervise the quality of covil works and are also seen to visit the sites as<br />
per schedule, and the SDMCs have maintained separate accounts relating to all<br />
aspects of civil works. Overall the quality of civil works is found to be quite<br />
satisfactory.<br />
AWP & B FOR 2007-08<br />
41
3. TEXT BOOKS<br />
9279 children are covered under this scheme with an outlay of Rs. Rs.8.968 lakh.<br />
All the money has been spent revealing excellent progress.<br />
From the field data it is seen that<br />
4. SCHOOL GRANTS<br />
There is satisfactory progress with over 97.0 per cnt utilization.<br />
From the DPO data it is seen that a total of 694 schools had received grant, which<br />
included 427 primary and 267 higher primary schools. The grant was released in<br />
the month of June itself along with guidelines.<br />
From the field data, it is seen that all 19 schools had received school grant, which<br />
was generally found to be used for repairs, furniture purchase, painting, drinking<br />
water, electricity bill payment, plumbing work etc,.<br />
5. TEACHERS AND TEACHER TRAINING<br />
Teachers’Salary (recurring) under this had an outlay of Rs. 225.72 lakhs out of<br />
which Rs.185.40 lakh fave been spent upto January. Thus utilization is to the<br />
tune of 82.1376 per cent, which may be considered quite satisfactory..<br />
From the DPO data it is seen that 2 teachers are appointed.<br />
The district had a target of 2559 teachers to be trained under in-service training<br />
for an outlay of Rs.36.786 lakhs. The utilization is seen to the extent of 62.90<br />
per cent , which may be considered less than adequate progress.<br />
From the DPO data it is seen that all the targeted 2499 in-service teachers had<br />
AWP & B FOR 2007-08<br />
42
undergone training and similarly all the targeted 60 newly recruited teachers had<br />
undergone 30 days induction training. The district has no untrained teachers as<br />
the state has no policy of recruiting untrained teachers.<br />
From the field data it is seen that overall more than 97.0 per cent of the schools<br />
have teachers in position. None of the teachers were absent in any of the sample<br />
schools on the day of visit. Over 96.0 per cent of the teachers had undergone in-<br />
service training at the DIET and BRCs. More than 95% reported about giving<br />
feedback to the training programme and same percentage of teachers reported<br />
that the training was effective. The training covered all curricular subjects.<br />
However, teachers expressed the need for more training in English, Maths, Hindi,<br />
Computers and Yoga.<br />
6. TEACHING LEARNING MATERIAL (TLM) GRANT<br />
The district had an outlay of Rs.12.495 lakhs for 2499 teachers in primary and<br />
upper primary schools. Out of this, 87.41 per cent has been utilized.<br />
From the DPO data it is noticed that a mere Rs.60,000/- has been released to<br />
teachers towards TLM grant, which is a poor reflection.<br />
From the field data, it is seen that excepting in one school, in all schools all<br />
eligible teachers had received TLM grant. Although 83.0 per cent of the schools<br />
had received Rs.500/- per teacher, in about 3 schools, the amount received was<br />
less than Rs.500/-.85.0 per cent of the teachers had utilized the grant as per<br />
guidelines and in only 3 per cent of the schools, the TLM was displayed in the<br />
calss, while in close to 80.0 per cent of the schools, it was kept separately in the<br />
classroom. In all the schools, it was found to be used by pupils. Similarly, all<br />
teachers had received training for TLM at the BRCs. A large majority of schools<br />
have reported about sharing of good practices.<br />
7. EGS & AIE<br />
AWP & B FOR 2007-08<br />
43
The district reveals an outlay of Rs.165.479 lakh, out of which little over 60.0 per<br />
cent has been spent. This may be considered less than adequate progress. The<br />
district is lagging behind in RBC (12 months) and tent school.<br />
From the DPO data it is seen that the district had 28 newly sanctioned RBC<br />
(Chinnara Angala), all of which have been statrted. Similarly, 3 new Ashakirana<br />
have been sanctioned and all started. 3 HBE, 1 feeder school have also been<br />
started.<br />
The district has been able to cover 66 out of the targeted enrolmemt of 91<br />
children in the 28 RBCs and thus there is a shortfall of 25 children. Similarly there<br />
is a shortfall of 118 children out of the tragettd 150 in the 3 Ashakiranas. The<br />
propsed tent school has been shelved due to lack of children.<br />
The district reveals excellent progress both in feeder school and transportation<br />
with 11 children and 4519 children respectively covering the entire target.<br />
HBE and SED also reveal satisfactory progress.<br />
From the field data it is noticed that one Ashakirana in Ponnampet was run by an<br />
NGO. This centre had an enrolment of 53. However, on the day of visit, 49<br />
children were found to be present and all of these children excepting 2 were<br />
attending the local HPS in Hudukeri. These 2 children were in the centre as they<br />
had some infectious disease. However, 4 children who were absent in the centre<br />
had gone along with their parents to other places. The facilities in the centre was<br />
of satisfactory quality and the centre being a spiritual institituion, children were<br />
exposed to a variety of cultural activities which seemed to inculcate certain good<br />
habits among the children.<br />
In another Ashakirana at Madikeri, which was run by another NGO, there were 32<br />
children enrolled, out of whome 26 were present on the day of visit. There was a<br />
volunteer appointed who was paid a monthly honorarium of Rs.1000/-. These<br />
children were attending the GMPS school within the same premises where the<br />
centre was located. On the day of visit, childen had lime rice as their breakfast<br />
and they were all making preparations for cultural activities on the eve of the<br />
annual school day function. Childen were active and enthusiastic.<br />
8. CHILDREN WITH SPECIAL NEEDS<br />
AWP & B FOR 2007-08<br />
44
1692 children were covered with an outlay of Rs. 20.304 lakh. 89.0 per cent of<br />
this amout has been utilized so far revealing very satisfactory progress.<br />
From the DPO data it is seen that the district had identified 1692 CWSN, all of<br />
whom have been enrolled. out of them, 78 have been provided with aidsssitive<br />
devices. 8 resource teachers have been identified and 2 NGOs are collaborating.<br />
210 children out of these have been provided with HBE support.<br />
From the field data, it is noted that in 11 schools, 17 CWSN children were found<br />
to have attended medical camps. In these schools, only 13 children were found<br />
to be eligible to receive assistive devices. However, except one child, all had<br />
received the aids.. Further, only 57.8 % of the sample schools had a ramp built<br />
as per requirements. 4 schools also revealed severly disabled children enrolled<br />
who were given home based support. The attendance among the CWSN on the<br />
day of visit was more than 93.0 per cent.<br />
9. NATIONAL PROGRAMME FOR EDUCATION OF<br />
GIRLS AT ELEMENTARY LEVEL (NPEGEL<br />
There is no NPEGEL in the district.<br />
10. KASTURBA GANDHI BALIKA VIDYALAYA<br />
(KGBV)<br />
There is no KGBV in the district.<br />
11. DISTRICT INFORMATION SYSTEM FOR<br />
EDUCATION (DISE)<br />
The district reveals an outlay of Rs. 65.79 for MIS, out of which only 32.0 per<br />
cent has been spent so far. This may be considered less than adequate progress.<br />
MIS, Contingency, FTA, IERT salary, community mobilsation, monitoring by DIET<br />
are a few items which have drawn flak. Strangely, under this the LEP although<br />
reveals a small oulay of Rs.2.679 lakh has also not been utilized.<br />
AWP & B FOR 2007-08<br />
45
From the DPO data it is seen that all aspects relating to EMIS are in place.<br />
From the field data it is seen that all sample schools except one had received data<br />
capture formats in time and all teachers had received training in this regard. All<br />
schools reported about 5% data verification by the BRCs/CRCs.<br />
12. RESEARCH AND EVALUATION<br />
The district records 75.0 per cent fund utilization under this, which may be<br />
considered satisfactory. Under innovative activity, there is inadequate progress<br />
as the district reveals fund utlisation to the extent of 24.3 per cent only.<br />
13. FUNCTIONING OF VEC<br />
Excellent progress is seen with 100.0 per cent fund utilization.<br />
From the DPO data it is seen thatl the district has constituted 128 SDMCs as per<br />
required norms. All of them have been given guidelines. 92 per cent of the<br />
members have received training, which is praiseworthy.<br />
From the field data it is seen that all schools had SDMC in place as per norms.<br />
These schools also were in possession of the SDMC guidelines. There was monthly<br />
meeting of the SDMC. Only 9 schools revealed all members attending the<br />
meetings. In other schools, the attendance was around 70.0 per cent. More than<br />
55% schools reported about 100.0 percent attendance among women members<br />
in the SDMC meetings. Large majority of the schools(66.6%) had about 20-30%<br />
of the members who had undergone SDMC training.<br />
14. STAFFING AT STATE AND DISTRICT LEVEL<br />
With regard to staffing, all are in place excepting one accounts assistant. Similarly<br />
at the BRCs, all coordinators are in place. 3 BRPs and 1 IERT are not in place. All<br />
the 21 CAEOs are in place and at the CRCs, there are 4 vacancies.<br />
AWP & B FOR 2007-08<br />
46
In the district, all are in position in the DPO except one accounts assistant. In the<br />
BRCs, all the three coordinators are in position, while 3 BRPs are vacant. Similarly<br />
one ou of 9 IERT is in vacant position. 21 CAEOs are in position and there are 4<br />
vacancies in the CRCs.<br />
15. MID-DAY MEAL SCHEME<br />
All schools served variety of food under mid-day meal. It also displayed daily<br />
menu list. These schools served hot cooked meals. Schools also reported about<br />
greens and vegetables being part of the MDM. The schools reveald an average<br />
enrolment of 68. The average attendance on the day of visit was 64. The previous<br />
day MDM register indicated the number of children taking food was 64 and on the<br />
day of visit, it was found to be 60. There was not much of a difference between<br />
the numbers from different sources.<br />
16. ADDITIONAL ITEMS CHECKED DURING SCHOOL<br />
VISITS BY MI<br />
From the sample schools from the field, it is noticed that the total working days<br />
ranged from 222 to 238. The average of the same was found to be 231. All<br />
schools excepting one school had clean environment, good building, good<br />
classrooms, lighting facility, blackboard and TLM. However with respect to play<br />
ground and seating equipment facilities for pupils, sports and play equipment,<br />
some adequacies wer noticed in a few schools. All schools except one had<br />
organized health check up for their pupils. 4 schools reported about low<br />
attendance, for which some effort was made by the schools. There was<br />
continuous and comprehensive evaluation system in place and grading system<br />
was being adopted for pupils assessment. In all 11 schools reported about under<br />
and over aged children. 2 schools reported about children leaving the school in<br />
the past six months and 2 schools reported about these children joining other<br />
schools. Overall rapport between pupils and teachers was quite good.<br />
AWP & B FOR 2007-08<br />
47
Remedial Teaching<br />
The district had planned remedial teaching for 3083 children with an outlay of Rs.<br />
15.415 lakhs. There is good progress with more than 80.0 per cent utilization.<br />
During the viist, it was noticed that the schools had enaged children in remedial<br />
teaching after schhhol hours on a regular basis.<br />
BRC<br />
The district reveals 100.0 per cent utilization<br />
CRC<br />
The district reveals more than 95.0 per cent utilization, which is excellent.<br />
SSA Overall Total<br />
The district had an overall allocation of Rs. 1120.549 lakh allocation for the year<br />
2008-09. Out of this, Rs.780.15 lakh has been spent so far accounting for close<br />
to 70.0 per cent, which may be considered fairly satisfactory.<br />
AWP & B FOR 2007-08<br />
***************<br />
48
AWP & B FOR 2007-08<br />
49
KODAGU DISTRICT (LPS)<br />
G L P SCHOOL<br />
1 KODAGU 292501 MADIKERI ARUVATHOKLU ARUVATHOKLU<br />
G L P SCHOOL<br />
2 KODAGU 292501 MADIKERI HAKATHUR<br />
HULITALA<br />
G L P SCHOOL<br />
3 KODAGU 292501 MADIKERI HERAVANADU HERAVANADU<br />
G L P SCHOOL<br />
4 KODAGU 292501 MADIKERI KIRUNDADU KIRUNDADU<br />
KUNDALPADI G M P SCHOOL<br />
5 KODAGU 292501 MADIKERI PERAJE<br />
PERAJE<br />
G L P SCHOOL<br />
KUNJALA<br />
6 KODAGU 292501 MADIKERI KUNJILA<br />
AMBALA<br />
G M P SCHOOL<br />
7 KODAGU 292501 MADIKERI MEKERI<br />
MEKERI<br />
G L P SCHOOL<br />
8 KODAGU 292501 MADIKERI PALUR<br />
PALUR<br />
G M P SCHOOL<br />
9 KODAGU 292502 SOMAVARPET ANDAGOVE KODAGARAHALLI<br />
G L P SCHOOL<br />
10 KODAGU 292503 VIRAJPET BADAGABANANGALA MARGOLLY<br />
G L P SCHOOL<br />
11 KODAGU 292503 VIRAJPET BITTANGALA BITTANGALA<br />
G L P SCHOOL<br />
HEBBALE<br />
12 KODAGU 292503 VIRAJPET HEBBALE<br />
BADRAGOLA<br />
G L P SCHOOL<br />
13 KODAGU 292503 VIRAJPET KUNJALAGERI KUNJALAGERI<br />
AWP & B FOR 2007-08<br />
50<br />
Department of<br />
Education<br />
Department of<br />
Education<br />
Department of<br />
Education<br />
Department of<br />
Education<br />
Department of<br />
Education<br />
Department of<br />
Education<br />
Department of<br />
Education<br />
Department of<br />
Education<br />
Department of<br />
Education<br />
Department of<br />
Education<br />
Department of<br />
Education<br />
Department of<br />
Education<br />
Department of<br />
Education
14 KODAGU 292503 VIRAJPET NOKYA<br />
KODAGU DISTRICT (HPS)<br />
1 KODAGU 292501 MADIKERI BELIGERI<br />
CHERALA<br />
2 KODAGU 292501 MADIKERI SHRIMANGALA<br />
3 KODAGU 292501 MADIKERI KALOOR<br />
4 KODAGU 292501 MADIKERI KOLAKERI<br />
5 KODAGU 292501 MADIKERI MALECHEMBU<br />
6 KODAGU 292501 MADIKERI MEKERI<br />
SODLUR<br />
7 KODAGU 292501 MADIKERI KATTEMADU<br />
8 KODAGU 292503 VIRAJPET BEGUR<br />
9 KODAGU 292503 VIRAJPET HODDUR<br />
10 KODAGU 292503 VIRAJPET KUMTOOR<br />
11 KODAGU 292503 VIRAJPET MEKUR HOSAKERI<br />
12 KODAGU 292503 VIRAJPET PARKATAGERI<br />
AWP & B FOR 2007-08<br />
51<br />
G L P SCHOOL<br />
NOKIA<br />
G H P SCHOOL<br />
BELIGERI<br />
G H P SCHOOL R<br />
S CHETTALLI<br />
G H P SCHOOL<br />
KALOOR<br />
G H P SCHOOL<br />
CHAPPENDADI<br />
G H P SCHOOL<br />
DABBADKA<br />
G M P SCHOOL<br />
MEKERI<br />
G H P SCHOOL S<br />
KATTEMADU<br />
G H P SCHOOL<br />
BEGUR<br />
G H P SCHOOL<br />
HODDUR<br />
G H P SCHOOL<br />
KAKOOR<br />
G H P SCHOOL<br />
AMMEGUNDI<br />
G H P SCHOOL<br />
BIRUNANI<br />
G H P<br />
SCHOOL<br />
KAKOOR<br />
G H P<br />
SCHOOL<br />
AMMEGUNDI<br />
G H P<br />
SCHOOL<br />
Department of<br />
Education<br />
Department of<br />
Education<br />
Department of<br />
Education<br />
Department of<br />
Education<br />
Department of<br />
Education<br />
Department of<br />
Education<br />
Department of<br />
Education<br />
Department of<br />
Education<br />
Department of<br />
Education<br />
Department of<br />
Education<br />
Department of<br />
Education<br />
Department of<br />
Education<br />
Department of<br />
Education
AWP & B FOR 2007-08<br />
52<br />
BIRUNANI
AWP & B FOR 2007-08<br />
53
SSA Monitoring of Dakshina Kannada District<br />
of Karnataka: A Report<br />
AWP & B FOR 2007-08<br />
Prepared by<br />
Dr. M.D.Usha Devi<br />
ISEC, Bangalore<br />
Submitted to<br />
Ministry of Human Resource Development<br />
Government of India<br />
2009<br />
Preface<br />
The present monitoring report relating to Dakshina Kannada District of<br />
Karnataka is an outcome of the task assigned by the Ministry of Human Resource<br />
Development, Government of India, and the task accomplished by the Institute<br />
54
for Social and Economic Change, (ISEC) Bangalore for monitoring progress and<br />
implementation of SSA activities in Karnataka.<br />
The task required visiting three blocks in the district as sample blocks<br />
covering 50 schools, five BRCs and five CRCs along with capturing activities under<br />
Out of School Strategies and civil works. The monitoring task has been<br />
accomplished satisfactorily with the cooperation extended by the State Project<br />
Office, the District Project Office and the sub-district office functionaries and the<br />
project team members. In particular, Sri. Gopal, Dy.PC of D.K. district and his<br />
SSA team who extended excellent support in the field at various stages of this<br />
work deserve special word of appreciation and thanks from us. The coordinator is<br />
indeed thankful to the MHRD for having given this wonderful opportunity to visit<br />
different districts, understand the implementation of SSA across the blocks in the<br />
district and to prepare reports based on the analysis of the field data captured.<br />
Our thanks are also due to the State Project Director, Director (SSA<br />
Programmes), programme officers from the state project office, SSA Mission, GoK<br />
and all those who have provided excellent cooperation in this endeavour.<br />
The coordinator is also thankful to the Director, ISEC for extending full<br />
support to carryout the SSA monitoring task. The entire project team deserves<br />
the appreciation for the professional support rendered at various stages in this<br />
huge monitoring task.<br />
The final report is prepared keeping in view the terms of reference given<br />
by the MHRD. It is hoped that the readers of this report would get a picture of<br />
how Dakshina Kannada district is performing in implementing SSA programme.<br />
AWP & B FOR 2007-08<br />
55<br />
M. D. Usha Devi<br />
Coordinator,<br />
MHRD/GoI SSA<br />
Monitoring<br />
Karnataka
Project Team<br />
AWP & B FOR 2007-08<br />
56<br />
Position in the Project<br />
1 Dr. M.D.Usha Devi Coordinator & MHRD Team Lead<br />
Member, Dakshina Kannada District<br />
2 Mr. Datta Saraf<br />
3 Sri. P. Mahadeviah<br />
Desk Officer, Dakshina Kannada<br />
District<br />
Field Officer, Dakshina Kannada<br />
District<br />
4 Sri.Seenappa Field Investigator, Belthangadi Block<br />
5 Sr. Sheenappa Field Investigator, Puttur Block<br />
6 Sri. Raghu Field Investigator, Sulya Block
Preface<br />
Project Team<br />
Content page<br />
Chapter 2: Methodology Used:<br />
AWP & B FOR 2007-08<br />
Contents<br />
Chapter 1: District Profile and Historical Background<br />
2.3 Sampling Design<br />
2.4 Tools for Data Collection<br />
2.3 Strategies for Field Data Collection<br />
Chapter 3: Review of AWP&B and Analysis of Field Data<br />
57
AWP & B FOR 2007-08<br />
CHAPTER 1<br />
DISTRICT PROFILE<br />
No. of Revenue Blocks : 5<br />
No. of Education Blocks : 7<br />
No. of BRCs : 5<br />
No. of CRCs : 76<br />
No. of Grama Panchayats : 204<br />
No. of Villages : 378<br />
No. of Wards : 180<br />
No. of Habitations : 1708<br />
2.1 Demographic Details<br />
Present population of the district is 18,97,730. A comparison of the<br />
population from 1991 and 2001 is shown in the following Table.<br />
Table – 2: Comparison of District Population with the Population of State<br />
and Country<br />
2001 1991<br />
Male Female Total Male Female Total<br />
Dakshina Kannada(in Lakhs) 9.38 9.59 18.97 8.19 8.36 16.55<br />
Karnataka (in Lakhs) 288.56 238.77 527.33 229.00 220.70 449.70<br />
India (in Lakhs) 5312.77 4957.38 10270.15 4375.98 4063.33 8439.31<br />
Source: 2001 Census and 1991 Census<br />
2000000<br />
1500000<br />
1000000<br />
500000<br />
0<br />
POPULATION COMPARISON 1991-2001<br />
819847<br />
938434<br />
836318<br />
959296<br />
58<br />
2E+06<br />
Male Female Total<br />
2E+06<br />
1991<br />
2001<br />
The details of population gender wise and category wise is<br />
annexed in the Table -1 in the annexure.
Sl.<br />
N<br />
o<br />
Table – 3 : Area and Density of population and sex ratio.<br />
Taluks<br />
AWP & B FOR 2007-08<br />
Source : Census records 2001.<br />
2.1.1 The SC and STs comprise 7.06 percent and 3.91 percent<br />
respectively of the total population of the district. The<br />
present population of the SC is 133924 and ST is 93970<br />
(projected from 2001 figures) special programmes for<br />
these deprived communities are in progress in the district.<br />
2.1.2 Density of population in Dakshina Kannada District in<br />
2001 is 433 persons per sq.km. Whereas the State<br />
average is 275 per sq.km. The growth rate of density of<br />
population between 1971-81 and 1981-91 is 23.69 and<br />
17.39 per sq.Km. respectively.<br />
2.2 Literacy Scenario<br />
Name of<br />
Taluk<br />
1 Bantwal<br />
2 Belthangad<br />
y<br />
Density of<br />
population<br />
per sq.kms.<br />
Table - 4 : Literacy Percentages in different taluks,<br />
urban / rural divide.<br />
Percentage Rural Urban<br />
Total Male Femal<br />
80.6<br />
0<br />
77.7<br />
0<br />
88.3<br />
0<br />
85.1<br />
0<br />
Growth rate (percentage)<br />
of population<br />
1971-81 1981-91<br />
e<br />
73.20<br />
70.60<br />
Total Male Femal<br />
80.2<br />
0<br />
77.5<br />
0<br />
59<br />
87.9<br />
0<br />
84.9<br />
0<br />
Sex ratio<br />
(Female per<br />
1000 males)<br />
1991<br />
e<br />
72.70<br />
70.30<br />
Total Male Femal<br />
83.1<br />
0<br />
85.7<br />
0<br />
Sex ratio<br />
(Female per<br />
1000 males)<br />
2001<br />
Bantwal 492 25.45 13.46 1033 1024<br />
Belthangady 179 27.56 20.33 1027 1032<br />
Mangalore 1059 20.06 13.98 1041 1031<br />
Puttur 266 25.56 20.84 978 1004<br />
Sullia 170 19.83 18.36 968 983<br />
Total 433.20 23.69 17.39 1009 1014.8<br />
90.7<br />
0<br />
91.3<br />
0<br />
e<br />
75.60<br />
80.20
3 Mangalore<br />
4 Puttur<br />
5 Sullia<br />
District<br />
Total<br />
87.3<br />
0<br />
80.3<br />
0<br />
81.2<br />
0<br />
83.4<br />
0<br />
90.00%<br />
80.00%<br />
70.00%<br />
60.00%<br />
50.00%<br />
40.00%<br />
30.00%<br />
20.00%<br />
10.00%<br />
0.00%<br />
AWP & B FOR 2007-08<br />
92.6<br />
0<br />
87.2<br />
0<br />
87.4<br />
0<br />
89.7<br />
0<br />
89.70%<br />
82.10<br />
73.50<br />
74.90<br />
77.20<br />
76.10%<br />
82.0<br />
0<br />
78.4<br />
0<br />
80.1<br />
0<br />
79.7<br />
0<br />
60<br />
89.3<br />
0<br />
85.8<br />
0<br />
86.6<br />
0<br />
87.1<br />
0<br />
77.20%<br />
75.30<br />
71.10<br />
73.70<br />
72.70<br />
56.90%<br />
89.7<br />
0<br />
88.8<br />
0<br />
88.4<br />
0<br />
89.1<br />
0<br />
83.40%<br />
94.1<br />
0<br />
93.3<br />
0<br />
92.9<br />
0<br />
93.8<br />
0<br />
Male Female Total<br />
66.60%<br />
85.40<br />
84.30<br />
83.50<br />
84.50<br />
LITERACY RATE Comparision between District and State<br />
Mangalore Taluk stands first in literacy percentage and Belthangady<br />
Taluk last. In all the taluks urban literacy rates are marginally higher<br />
than the rural. The female literacy lags by about ten to fifteen<br />
percent behind the male literacy. Among other aspects this shows a<br />
lack of accessability in Bantwal, Belthangady and Puttur. Comparing<br />
to the literacy percentage of the state, Dakshina Kannada Dist.<br />
stands in a better position in all respects.<br />
D.K.<br />
State
3.1 Educational Structure<br />
The district is educationally forward in terms of literacy,<br />
accessibility of educational institutions to pupils, enrolment percentage.<br />
In Karnataka there are four levels of school education system. They are<br />
Primary, Upper primary, Secondary and Higher secondary. The primary<br />
comprises of I to V classes, Upper primary VI to VIII, Secondary VIII to X<br />
classes and higher secondary XI to XII.<br />
AWP & B FOR 2007-08<br />
There are 407 Primary schools and 1004 Upper primary<br />
schools. The actual number of teachers working in primary school is<br />
979 and 6027 teachers in upper primary schools. The total number of<br />
children in primary is 178250 and 113979 children in upper primary.<br />
Table – 5.a : Block wise Number of Primary Schools, Teachers and<br />
Pupils<br />
Block<br />
Schools Teachers (Working) Pupils<br />
Primary Upper primary Primary Upper primary Primary Upper primary<br />
Bantwal 75 211 207 1401 35679 22842<br />
Belthangady 85 138 187 910 23748 14798<br />
Mangalore City 17 109 70 892 26953 17432<br />
Mangalore Taluk 66 214 224 1105 44441 27173<br />
Moodabidri 34 72 62 362 8562 5765<br />
Puttur 57 170 98 844 26433 17558<br />
Sullia 73 90 131 513 12434 8411<br />
Total 407 1004 979 6027 178250 113979<br />
Source: Data maintained at DPO 2006<br />
Block<br />
Table–5.b : Block wise Number of Secondary Schools, Teachers<br />
and Pupils<br />
Secondary Schools Teachers(Working) Pupils<br />
G A U T G A U T G A U T<br />
Bantwal 27 13 17 57 186 114 84 384 11926 5614 2374 19914<br />
Belthangady 27 7 10 44 150 67 35 252 7634 3370 1407 12411<br />
Mangalore City 9 27 19 55 57 114 18 189 1628 13112 3444 18184<br />
Mangalore Taluk 29 27 49 105 195 231 111 537 7262 11255 5851 24368<br />
Moodabidri 13 9 5 27 52 242 280 574 1782 3268 427 5477<br />
Puttur 19 17 24 60 138 159 156 453 7202 6091 2817 16110<br />
Sullia 15 5 12 32 121 41 73 235 4261 1653 1290 7204<br />
Total 139 105 136 380 899 968 757 2624 41695 44363 17610 103668<br />
G - Government, A – Govt. Aided, U- Unaided, T-Total<br />
61
Sl.<br />
No<br />
Table – 6 : Management wise distribution of schools.<br />
Block Name<br />
AWP & B FOR 2007-08<br />
Education Dept.<br />
Social welfare<br />
Dept.<br />
62<br />
Pvt. Aided Pvt. Unaided Total<br />
LPS UPS LPS UPS LPS UPS LPS UPS LPS UPS<br />
1 Bantwal 55 138 3 0 4 53 13 20 75 211<br />
2 Belthangady 72 106 2 4 1 23 10 7 85 140<br />
3 Mangalore City 3 28 0 1 4 38 9 41 16 108<br />
4 Mangalore Taluk 30 102 0 3 11 62 25 47 66 214<br />
5 Moodabidri 25 41 0 1 0 19 9 10 34 71<br />
6 Puttur 46 138 1 0 0 14 10 18 57 170<br />
7 Sullia 65 75 2 0 0 6 6 9 73 90<br />
TOTAL 296 628 8 9 20 215 82 152 406 1004<br />
Note: Out of total number of UPSs 13 UPSs are to be treated as single unit.<br />
Source : BEOs Report 2006<br />
3.2 Details of Child population :<br />
Table: 7: Details of child population of age group 6-14.<br />
Sl.<br />
No<br />
235<br />
Name of Taluk<br />
Management wise schools<br />
231<br />
17<br />
924<br />
6-14 Child Population<br />
(Child census 2006)<br />
Boys Girls Total<br />
1 Bantwal 27241 23239 50480<br />
2 Belthangady 18518 18516 37034<br />
3 Mangalore City 21278 21276 43854<br />
4 Mangalore Taluk 31710 28709 60419<br />
5 Moodabidre 7222 6767 13989<br />
6 Puttur 22363 18364 40727<br />
7 Sullia 9265 8865 18130<br />
Total 137597 125736 264633<br />
Source : Child census Feb – 2006<br />
Govt<br />
Aided<br />
unaided<br />
Social welfare
SI.<br />
No<br />
3.3 Schools and Access position<br />
a) ACCESS : By Habitation<br />
Table – 8(a): Table shows access ratio for LPS & UPS Block wise<br />
Block Name<br />
Total No.of<br />
habitations<br />
AWP & B FOR 2007-08<br />
No. of habitations which<br />
have primary schools<br />
within 1 km<br />
63<br />
LPS A.R<br />
No.of habitations<br />
which have UPS<br />
within 3 km<br />
UPS A.R<br />
1 Bantwal 469 469 100 469 100<br />
2 Belthangady 483 483 100 480 99.38<br />
3 Mangalore City 45 45 100 45 100<br />
4 Mangalore Taluk 234 234 100 234 100<br />
5 Moodabidre 84 84 100 84 100<br />
6 Puttur 225 225 100 225 100<br />
7 Sullia 168 168 100 168 100<br />
Block<br />
Total 1708 1708 100 1705 99.91<br />
Source: BEOs Report 2006-07 A.R – Access Ratio<br />
The above table shows that all the blocks have 100%<br />
Access Ratio for LPS. These figures reveal that, 3 habitations in<br />
Belthangady block lack UPS schooling facility within a radius of 3<br />
Kms. It is due to the scattered population owing to the forested<br />
geography of this region.<br />
b) ACCESS : By Child Population<br />
* Access ratio for LPS – 100% * Access ratio for UPS – 100%<br />
Table – 8(b): Access by schools<br />
Child<br />
population of<br />
age group 6-11<br />
Enrollment<br />
1-5<br />
Access Ratio<br />
for LPS<br />
Child<br />
population<br />
of age group<br />
12-14<br />
Enrollment<br />
6-8<br />
Access<br />
Ratio for<br />
UPS<br />
Bantwal 35026 35679 100 15646 22842 100<br />
Belthangady 22403 23748 100 14823 14798 100<br />
Mangalore City 26477 26953 100 17569 17432 100<br />
Mangalore Taluk 43236 44441 100 17375 27173 100<br />
Moodabidre 8502 8562 100 5535 5765 100<br />
Puttur 26515 26433 100 13404 17558 100<br />
Sullia 12341 12434 100 5781 8411 100<br />
TOTAL 174500 178250 100 90133 113979 100<br />
Source: child census 2006 and BEOs Report 2006-07
Block<br />
The above table reflects<br />
� The children of age group 6-14 have access to both primary and<br />
upper primary schools within the radius of 1 K.M.<br />
� All the blocks achieved 100% access to schools.<br />
3.4 Teacher and teacher related indicators:<br />
Table – 9(a) Teacher Information (Management wise)<br />
Lower Primary<br />
AWP & B FOR 2007-08<br />
1-5 (LPS) Sanctioned 1-5 (LPS) Working<br />
Govt. Aided Unaided Total Govt. Aided Unaided Total<br />
Bantwal 127 20 65 212 127 15 65 207<br />
Belthangady 151 2 34 187 151 2 34 187<br />
Mangalore City 7 51 40 98 7 23 40 70<br />
Mangalore Taluk 72 51 125 248 72 27 125 224<br />
Moodabidre 49 0 22 71 40 0 22 62<br />
Puttur 95 0 30 125 68 0 30 98<br />
Sullia 131 0 0 131 131 0 0 131<br />
TOTAL 632 124 316 1072 596 67 316 979<br />
Source: BEOs Report 2006-07<br />
Note: There is no single teacher school in our District.<br />
Table – 9(b): Male-Female teacher percentage<br />
Block Male Female<br />
64<br />
Female Teacher<br />
Percentage<br />
Bantwala 58 149 72<br />
Belthangady 85 102 55<br />
Mangalore City 0 70 100<br />
Mangalore Taluk 34 190 85<br />
Moodabidre 48 14 23<br />
Puttur 40 58 59<br />
Sullia 30 101 77<br />
Total 295 684 67<br />
Source: BEOs Report 2006-07
Block<br />
Table - 10(a) Teacher Information (Management Wise) (Upper Primary)<br />
AWP & B FOR 2007-08<br />
1-7 (UPS) Sanctioned (UPS) Working<br />
Govt. Aided Unaided Total Govt. Aided Unaided Total<br />
Bantwal 969 489 123 1581 839 339 123 1301<br />
Belthangady 693 229 53 975 563 174 53 790<br />
Mangalore City 195 396 465 1056 182 245 465 892<br />
Mangalore Taluk 800 669 329 1798 767 366 329 1462<br />
Moodabidre 236 143 68 447 215 79 68 362<br />
Puttur 892 151 72 1115 720 41 72 833<br />
Sullia 438 38 37 513 387 39 37 463<br />
TOTAL 4223 2115 1147 7485 3673 1283 1147 6103<br />
Source: BEOs Report 2006-07<br />
Table – 10(b): Male-Female teacher percentage<br />
Block Male Female<br />
65<br />
Female Teacher<br />
Percentage<br />
Bantwala 624 677 52<br />
Belthangady 316 474 60<br />
Mangalore City 62 830 93<br />
Mangalore Taluk 175 1287 88<br />
Moodabidre 119 243 67<br />
Puttur 283 550 66<br />
Sullia 199 264 57<br />
Total 1778 4325 69<br />
The above Tables reflect that<br />
� In government lower primary schools and upper primary<br />
schools there are about 36 and 550 posts vacant<br />
respectively. These posts are vacant due to:<br />
1. Normal superannuation of teachers<br />
2. Promotions of 29 primary teachers as graduate assistant<br />
teachers to government high schools in November 2006<br />
� In aided lower primary schools 57 and upper primary schools<br />
about 832 posts are vacant against the sanctioned posts.<br />
This is due to the ban imposed by the government on fresh<br />
recruitments to aided primary schools. These posts may be
AWP & B FOR 2007-08<br />
filled up in the near future depending on the State<br />
governments policy.<br />
3.5 Teacher Classroom Ratio<br />
Table 10 shows the distribution of teacher classroom ratio<br />
during 2007-08.<br />
Teacher: Classroom ratio for LPS is 1: 1.30.<br />
• Total No. of classrooms available : 792<br />
• No. of Teachers sanctioned : 632<br />
• Teacher Classroom Ratio : 1: 1.25<br />
Teacher: Classroom ratio for UPS is 1: 1<br />
• Total No. of classrooms available : 4927<br />
• No. of Teachers sanctioned : 4223<br />
• Teacher Classroom Ratio : 1: 1.17<br />
Table - 11: Teacher Class Room Ratio (Govt. Only)<br />
Block<br />
No. of<br />
TRs<br />
Sanctioned<br />
LPS UPS<br />
Total<br />
Rooms<br />
available TCR<br />
66<br />
No. of<br />
TRs<br />
Sanctioned<br />
Total<br />
Rooms<br />
available TCR<br />
Bantwal 127 151 1:1.19 969 1014 1:1.05<br />
Belthangady 151 198 1:1.31 693 864 1:1.24<br />
Mangalore City 7 10 1:1.42 195 212 1:1.09<br />
Mangalore Taluk 72 83 1:1.52 800 873 1:1.09<br />
Moodabidre 49 62 1:1.27 236 308 1:1.30<br />
Puttur 95 127 1:1.37 892 1039 1:1.16<br />
Sullia 131 161 1:1.23 438 617 1:1.40<br />
TOTAL 632 792 1:1.25 4223 4927 1:1.17<br />
Source: BEOs Report<br />
On consolidation of the Block Level Plans for the year 2007-<br />
08, it was found that there is a need for 485 additional classrooms<br />
and 37 rooms for major repair. In the blocks of Bantwal,<br />
Mangalore City and Taluk the TCR is less than the prescribed norms,<br />
hence for the said blocks additional class rooms are required to fill the<br />
gap in the TCR for the year 2007-08.
Table - 12:<br />
AWP & B FOR 2007-08<br />
In some blocks of the district, there is a need for additional<br />
class rooms in the schools as in those schools there is an increase in<br />
enrolment of pupils and also due to the fact that some schools have<br />
started classes for standard 8. This is despite the fact that in some<br />
schools of the district there is an excess of availability of class rooms<br />
due to reduction in enrolment.<br />
The TCR of the LPS in District is 1:1.25 and UPS is 1:1.17 it is<br />
essential to provide Additional Class Rooms for the following reasons<br />
� 220 schools started class 8th.<br />
� 54 schools having computer facility.<br />
� 475 rooms as HM/Staff rooms.<br />
3.5.1 Teacher Pupil Ratio<br />
The teacher-pupil ratio is 1:19 in LPS and 1:28 in UPS. There<br />
are 596 teachers, 12319 pupils in LPS and 3673 teachers, 119555<br />
pupils in UPS.<br />
Block<br />
Teacher Pupil Ratio (Govt. Only)<br />
LPS UPS<br />
Sanctioned Enrollment TPR Sanctioned Enrollment TPR<br />
Bantwal 127 2692 1:21 969 28812 1:29<br />
Belthangady 151 3400 1:22 693 20831 1:30<br />
Mangalore City 7 135 1:19 195 5298 1:27<br />
Mangalore Taluk 72 1226 1:17 800 22316 1:28<br />
Moodabidre 49 754 1:15 236 5765 1:24<br />
Puttur 95 1855 1:19 892 24800 1:28<br />
Sullia 131 2257 1:17 438 11733 1:27<br />
TOTAL 632 12319 1:19 4223 119555 1:28<br />
Source: BEOs Report 2006-07<br />
In LPS TPR is lowest in Moodabidre and highest in Belthangady. And in<br />
UPS TPR is lowest in Moodabidre and highest in Belthangady.<br />
Enrolment and Enrolment related indicators<br />
In order to achieve the first objective of SSA, efforts are being taken to<br />
identify all the out of school children and mainstream them. There were 1076<br />
67
BLOCK<br />
Bantwal<br />
Belthangady<br />
Mangalore<br />
City<br />
Mangalore<br />
Taluk<br />
Moodabidri<br />
Puttur<br />
Sullia<br />
Total<br />
number of out of school children in 2006. These children comprise of mostly<br />
Handicapped, Children of migrating parents, Attaining the age of maturity,<br />
Household work and others. Out of these children 1066 children have been<br />
mainstreamed during 2006-07.Remaining 10 children were not mainstreamed<br />
because of migration.<br />
Table - 13: Block Wise, Category wise Enrolment<br />
Cate<br />
gory<br />
AWP & B FOR 2007-08<br />
Enrolment 1 TO 5 Enrolment 6 TO 7 Enrolment in 8<br />
B G T B G T B G T<br />
ALL 18385 17294 35679 7925 7425 15350 4096 3396 7492<br />
SC 990 974 1964 375 363 738 176 164 340<br />
ST 880 834 1714 403 361 764 198 182 380<br />
ALL 12301 11447 23748 5051 4846 9897 2720 2181 4901<br />
SC 1231 1225 2456 547 489 1036 259 192 451<br />
ST 695 626 1321 281 242 523 177 140 317<br />
ALL 13839 13114 26953 5496 5513 11009 3313 3110 6423<br />
SC 783 767 1550 334 357 691 178 161 339<br />
ST 279 251 530 85 78 163 35 56 91<br />
ALL 22829 21612 44441 9396 8589 17985 4988 4200 9188<br />
SC 1127 951 2078 459 368 827 233 204 437<br />
ST 391 414 805 157 116 273 51 48 99<br />
ALL 4442 4120 8562 1975 1749 3724 1096 945 2041<br />
SC 558 550 1108 261 245 506 123 123 246<br />
ST 193 177 370 84 68 152 33 33 66<br />
ALL 13479 12954 26433 5922 5326 11248 3409 2901 6310<br />
SC 1763 1663 3426 747 649 1396 296 273 569<br />
ST 740 678 1418 343 278 621 179 180 359<br />
ALL 6522 5912 12434 2869 2655 5524 1568 1319 2887<br />
SC 1050 935 1985 396 396 792 127 106 233<br />
ST 486 443 929 236 226 462 142 125 267<br />
ALL 91797 86453 178250 38634 36103 74737 21190 18052 39242<br />
SC 7502 7065 14567 3119 2867 5986 1392 1223 2615<br />
ST 3664 3423 7087 1589 1369 2958 815 764 1579<br />
Source: BEOS Report 2006-07<br />
68
SI. NoBlock<br />
Table - 14: Block wise Boy Girl Ratio<br />
AWP & B FOR 2007-08<br />
Block Boys Girls Total Boy-Girl Ratio<br />
Bantwal 30406 28115 58521 1.10<br />
Belthangady 20072 18474 38546 1.07<br />
Mangalore City 22648 21737 44385 1.04<br />
Mangalore Taluk 37213 34401 71614 1.08<br />
Moodabidre 7513 6814 14327 1.08<br />
Puttur 22810 21181 43991 1.08<br />
Sullia 10959 9886 20845 1.09<br />
Total 151621 140608 292229 1.23<br />
Source: BEOS Report 2006-07<br />
3.6 Infrastructure Facility:<br />
With all efforts through SSA and convergence with other schemes,<br />
still there are large number of schools require infrastructure facilities.<br />
Out of 924 schools at elementary level; 171 schools have no common<br />
toilet facilities; 221 schools require toilets for girls. So we require 950<br />
units of toilets for 392 schools. 92 schools require electrifications; 758<br />
schools need boundary walls; similarly 189 need play grounds, 274<br />
schools require drinking water facilities and 642 schools require ramps-a<br />
special provision for the physically challenged children. We are confident<br />
that we will be able to provide toilet and drinking water facilities to all the<br />
schools by the end of 2007-08. To achieve this target, of providing 100%<br />
infrastructure facilities in all the schools of the district, there is a need for<br />
allocation of funds for infrastructure on a priority basis for the year 2007-<br />
08.<br />
The following table shows existing infrastructure facilities available<br />
in Govt. primary Schools.<br />
Table – 15<br />
No. of<br />
Schools<br />
Drinking<br />
Water<br />
69<br />
No. of Schools having facilities<br />
% Toilets % Electricity % Comp. wall %<br />
School<br />
Bldg.<br />
% Ramps %<br />
1 Bantwal 193 182 94 180 93.26 170 88.08 81 41.96 191 99 52 23.31<br />
2 Belthangady 178 169 96 159 90.34 153 86.93 73 41.47 177 99 50 13.63
3 Mangalore City 31 31 96.87 30 93.75 31 96.87 25 78.12 31 100 17 34.37<br />
4 Mangalore Taluk 132 128 96.96 122 92.42 124 93.93 64 48.48 125 95 40 12.12<br />
5 Moodabidre 66 65 97 61 91.04 64 95.52 31 46.26 66 100 23 26.86<br />
6 Puttur 184 168 91.30 176 95.65 165 89.69 73 39.67 183 99 50 15.76<br />
7 Sullia 140 132 94.28 140 100 125 89.28 86 61.42 140 100 50 16.42<br />
Total 924 875 94.69 868 93.93 832 90.04 433 46.86 913 98.81 282 30.52<br />
Source: Data maintained at DPO 2006-07<br />
The above table reflects<br />
AWP & B FOR 2007-08<br />
• 94.69% schools have Drinking Water facility.<br />
• 93.93 % Schools have Toilets facility.<br />
• 90.04% Schools have Electricity facility.<br />
• 46.86% Schools have Compound Wall facility.<br />
• 98.81% Schools have Building facility<br />
• 30.52% Schools have Ramps facility<br />
Table – 16 shows infrastructure facilities required in Govt.<br />
primary Schools.<br />
Sl.<br />
No.<br />
BLOCK<br />
Drinking<br />
water<br />
Toilet Electricity Ramps CRC Add.Rooms Compound<br />
walls<br />
1 Bantwal 52 134 0 141 2 57 176<br />
2 Belthangady 131 155 75 126 2 159 177<br />
3 Mangalore City 3 15 2 15 11 14 10<br />
4 Mangalore Taluk 0 12 27 93 5 83 101<br />
5 Moodabidri 0 12 5 44 11 16 12<br />
6 Puttur 60 60 16 134 4 144 146<br />
7 Sullia 28 59 29 90 5 12 136<br />
Total 274 447 154 643 40 485 758<br />
Source: Data maintained at DPO 2006-07<br />
1. 485 additional classrooms are needed as per SSA norms<br />
and 37 rooms for major repairs.<br />
2. 274 schools are in need of clean drinking water facility<br />
70
3. 758 schools require compound walls<br />
4. 154 schools require to be electrified, due to construction of<br />
new buildings.<br />
5. 643 schools require ramps for physically challenged<br />
children.<br />
3.7 Gross Enrolment Ratio (G.E.R.)<br />
3.7.1 G.E.R. for 1-5th:<br />
Table 17(a)<br />
Sl.No Block Category<br />
1 Bantwal<br />
2 Belthangady<br />
3 Mangalore<br />
City<br />
4 Mangalore<br />
Taluk<br />
5 Moodabidri<br />
6 Puttur<br />
7 Sullia<br />
Total<br />
AWP & B FOR 2007-08<br />
Child Population Age<br />
Group 6-11<br />
71<br />
1-5 th Enrollment<br />
( As on 30-09-2006)<br />
GER (%)<br />
Boys Girls Tot Boys Girls Tot Boys Girls Tot<br />
All 18012 17014 35026 18385 17294 35679 102 102 102<br />
SC 1081 1089 2170 990 974 1964 92 89 91<br />
ST 949 821 1770 880 834 1714 93 101 97<br />
All 11401 11002 22403 12301 11447 23748 108 104 106<br />
SC 1191 1213 2404 1231 1225 2456 103 101 102<br />
ST 605 559 1164 695 626 1321 114 112 112<br />
All 13438 13039 26477 13839 13114 26953 103 101 102<br />
SC 565 556 1121 783 767 1550 138 138 138<br />
ST 132 128 260 279 251 530 211 196 204<br />
All 22218 21018 43236 22829 21612 44441 103 103 103<br />
SC 1078 910 1988 1127 951 2078 104 105 105<br />
ST 378 422 800 391 414 805 103 98 101<br />
All 4250 4252 8502 4442 4120 8562 105 97 102<br />
SC 432 489 921 558 550 1108 111 110 111<br />
ST 181 163 264 193 177 370 106 108 107<br />
All 13258 13257 26515 13479 12954 26433 102 98 100<br />
SC 1788 1667 3455 1763 1663 3426 99 100 100<br />
ST 745 711 1456 740 678 1418 100 95 98<br />
All 6170 6171 12341 6522 5912 12434 106 96 101<br />
SC 1029 898 1927 1050 935 1985 102 104 103<br />
ST 529 446 975 486 443 929 91 99 95<br />
All 88747 85753 174500 91797 86453 178250 103 101 102<br />
SC 7164 6822 13986 7502 7065 14567 104 103 104
AWP & B FOR 2007-08<br />
ST 3459 3230 6689 3664 3423 7087 105 105 105<br />
Source: Children Census 2006 and BEOs Report<br />
The above table reflects<br />
• GER of Sullia block is the minimum with a ratio of 101.<br />
• GER of Belthangady is the maximum with a ratio of 106 as<br />
some of the pupils enrolled in schools here belong to mofussil<br />
limits.<br />
• GER for SC & ST pupils is similarly minimum in the Bantwala<br />
Block and maximum in the Mangalore City Block<br />
3.7.2 G.E.R. for 1-8th:<br />
Table 17(b)<br />
72
Sl.<br />
No<br />
Block<br />
1 Bantwal<br />
2 Belthangady<br />
3 Mangalore<br />
City<br />
4 Mangalore<br />
Taluk<br />
5 Moodabidri<br />
6 Puttur<br />
7 Sullia<br />
Total<br />
Categor<br />
y<br />
Source: Children Census 2006 and BEOs Report<br />
The above table reflects<br />
• GER of Mangalore City block is the minimum with a ratio of<br />
101.<br />
• GER of Bantwal is the maximum with a ratio of 116 as some<br />
of the pupils enrolled in schools here belong to mofussil limits<br />
too.<br />
• GER for SC & ST pupils is similarly minimum in the<br />
Belthangady Block and maximum in the Mangalore City<br />
Block.<br />
AWP & B FOR 2007-08<br />
Child Population Age Group<br />
6-14<br />
(as on Feb 2005)<br />
The above tables show block wise, gender wise and social<br />
group wise Gross Enrollment Ratio (GER) in class 1 to 5 and 1 to 8. In<br />
73<br />
1-8 th Enrollment<br />
(As on 30-9-2006)<br />
GER (%)<br />
Boys Girls Tot Boys Girls Tot Boys Girls Tot<br />
All 27241 23239<br />
50480 30406 28115 58521 112 121 116<br />
SC 1564 1502 3066 1541 1501 3042 102 100 101<br />
ST 1366 1256 2622 1481 1377 2858 108 110 109<br />
All 18518 18516 37034 20072 18474 38546 108 100 104<br />
SC 2635 2610 5245 2037 1906 3943 77 73 75<br />
ST 1379 1246 2625 1153 1008 2161 84 81 82<br />
All 21278 21276 43854 22648 21737 44385 101 102 101<br />
SC 779 747 1526 1295 1285 2580 166 172 169<br />
ST 179 165 344 399 385 784 222 233 228<br />
All 31710 28709 60419 37213 34401 71614 117 120 119<br />
SC 1479 1238 2717 1819 1523 3342 122 123 123<br />
ST 521 533 1054 599 578 1177 115 108 112<br />
All 7222 6767 13989 7513 6814 14327 104 101 102<br />
SC 841 798 1639 942 918 1860 112 115 114<br />
ST 287 243 530 310 278 588 108 114 111<br />
All 22363 18364 40727 22810 21181 43991 102 115 108<br />
SC 2540 2342 4882 2806 2585 5391 110 110 110<br />
ST 1101 1034 2135 1262 1136 2398 114 110 112<br />
All 9265 8865 18130 10958 9886 20845 118 112 115<br />
SC 1388 1250 2638 1573 1437 3010 113 115 114<br />
ST 680 593 1273 864 794 1658 127 133 130<br />
All 137597 125736 264633 151621 140608 292229 110 112 111<br />
SC 11226 10487 21713 12013 11155 23168 107 106 107<br />
ST 5513 5070 10583 6068 5556 11624 110 109 110
all cases enrollment is higher than the school age population in all<br />
blocks because of voluntary admission in the age group of 5 to 6 and<br />
a portion of overage students in higher classes. The overall G.E.R. in<br />
class 1-5 th is 102 and in 1-8 th is 111.<br />
3.8 Net Enrolment Ratio (N.E.R)<br />
3.8.1 N.E.R for 1 to 5th<br />
Table 18 (a)<br />
Block<br />
AWP & B FOR 2007-08<br />
Enrolment 1-5<br />
(Age Group 6-11)<br />
School Age Population<br />
(Age Group 6-11)<br />
74<br />
NER (%)<br />
Boys Girls Total Boys Girls Total Boys Girls Total<br />
Bantwal 18385 17294 35679 21058 19968 41026 87.30 86.60 86.96<br />
Belthangady 12301 11447 23748 13855 13174 27029 88.78 86.89 87.86<br />
Mangalore City 13839 13114 26953 15915 15524 31439 86.95 84.47 85.73<br />
Mangalore Taluk 22829 21612 44441 25776 24121 49897 88.56 89.59 89.06<br />
Moodabidri 4442 4120 8562 5141 4744 9885 86.40 86.84 86.61<br />
Puttur 13479 12954 26433 15754 15080 30834 85.56 85.90 85.72<br />
Sullia 6522 5912 12434 7693 7073 14766 84.77 83.58 84.20<br />
Total 91797 86453 178250 105192 99684 204876 87.26 86.72 87.00<br />
Source: Children Census 2006-07 and BEOs Report<br />
3.8.2 N.E.R. for 1 to 8th<br />
Table 18(b)<br />
Block<br />
Enrolment 1-8<br />
(Age Group 6-14)<br />
School Age Population<br />
(Age Group 6-14)<br />
NER (%)<br />
Boys Girls Total Boys Girls Total Boys Girls Total<br />
Bantwal 30406 28115 58521 30699 28272 58971 99.04 99.44 99.23<br />
Belthangady 20072 18474 38546 20348 19104 39452 98.64 96.70 97.70<br />
Mangalore City 22648 21737 44385 23162 22665 45827 93.84 95.90 96.85<br />
Mangalore Taluk 37213 34401 71614 37884 35156 73040 98.22 97.85 98.04<br />
Moodabidri 7513 6814 14327 7642 7137 14779 98.31 95.47 96.94<br />
Puttur 22810 21181 43991 23441 21832 45273 97.30 97.01 97.16<br />
Sullia 10958 9886 20845 10831 9933 20764 98.84 99.52 99.61<br />
Total 151620 140608 292229 154007 144099 298106 98.45 97.57 98.02<br />
Source: Children Census 2006-07 and BEOs Report<br />
The tables 18(a) & 18(b) reflect<br />
• NER for Girls in the Classes 1-8 th is good in the District.
3.9 RETENTION RATE (RR):<br />
separately.<br />
AWP & B FOR 2007-08<br />
The following table shows the retention rate for LPS and UPS<br />
Table: 19(a) RR for LPS<br />
Sl.<br />
No<br />
Name of Taluk<br />
ALL SC ST<br />
B G T B G T B G T<br />
1 Bantwal 99.52 99.81 99.66 91.63 87.50 89.49 98.26 97.12 97.72<br />
2 Belthangady 98.25 90.92 94.76 99.72 82.22 91.52 92.54 90.67 91.72<br />
3 Mangalore City 99.56 98.61 99.09 100 93.33 96.55 100 96 98<br />
4 Mangalore Taluk 92.97 90.12 91.54 94.87 89.27 92.54 86.36 86.67 86.47<br />
5 Moodabidri 93.67 90.12 92.19 95.65 99.36 97.79 98.08 100 98.21<br />
6 Puttur 98.99 99.55 99.25 98.49 97.89 98.18 97.33 97.89 97.61<br />
7 Sullia 99.59 99.86 99.71 96.89 88.89 93.15 94.7 95.42 95.05<br />
District Total 98.29 96.68 97.53 97.10 90.74 94.06 95.8 94.82 94.97<br />
Source: BEOs Report 2006-07<br />
Table 19(b): RR for UPS<br />
Sl.<br />
No<br />
RR<br />
105<br />
100<br />
95<br />
90<br />
85<br />
80<br />
75<br />
Name of Taluk<br />
Bantwal<br />
belthangady<br />
Mangalore city<br />
Mangalore Taluk<br />
RR FOR LPS<br />
Moodabidri<br />
BLOCKS<br />
ALL SC ST<br />
B G T B G T B G T<br />
1 Bantwal 98.89 94.74 96.93 96.86 89.92 93.32 94.66 94.32 94.5<br />
75<br />
Puttur<br />
Sullia<br />
Total<br />
ALL<br />
SC<br />
ST
2 Belthangady 88.2 88.7 88.43 84.56 83.00 83.82 90.96 73.26 82.5<br />
3 Mangalore City 99.92 99.89 99.91 98.7 99.39 99.06 100 100 100<br />
4 Mangalore Taluk 99.52 87.34 94.48 82.33 84.89 83.59 86.87 89.89 88.3<br />
5 Moodabidri 98.14 97.14 97.78 98.23 98.67 98.48 98.44 100 99.12<br />
6 Puttur 99.55 99.68 99.61 98.96 98.54 98.76 98.25 97.91 98.09<br />
7 Sullia 99.61 96.02 97.92 93.81 91 92.57 82.67 82.03 83.77<br />
District Total 95.35 93.82 94.62 89.87 89.22 89.55 96.69 89.89 91.38<br />
Source: BEOs Report 2006<br />
RR<br />
120<br />
100<br />
80<br />
60<br />
40<br />
20<br />
0<br />
AWP & B FOR 2007-08<br />
RR FOR UPS<br />
Bantwal<br />
belthangady<br />
Mangalore city<br />
Mangalore Taluk<br />
Moodabidri<br />
3.10 CAPACITY BUILDING:<br />
Blocks<br />
76<br />
Puttur<br />
Sullia<br />
Total<br />
ALL<br />
School Development and Monitoring Committees were established<br />
in Karnataka before the commencement of <strong>Sarva</strong> <strong>Shiksha</strong> <strong>Abhiyan</strong>a. In<br />
our district according to the state norms S.D.M.C. were established with<br />
9 members who are all parents of the children studying in that particular<br />
school. This has led to an awakening among the public about their<br />
powers and functions with regard to the functioning of schools including<br />
provision of infrastructure and other facilities.<br />
� Cluster Resource Centres are formed for academic improvement of<br />
teachers so that there is an improvement in the overall quality of<br />
education provided by the schools. These resource centres are the<br />
SC<br />
ST
hub of training activity for the teachers. The Cluster Resource<br />
Persons (CRP) appointed conduct monthly interaction meetings<br />
with the teachers, visit schools and give necessary suggestions for<br />
improvement of teaching learning activity. The CRPs also support<br />
and are actively involved in implementing all the educational<br />
programmes.<br />
� Block Resource Centres (BRC) have been formed in each Revenue<br />
Block with one Co-ordinator and five Resource Persons (BRPs).<br />
They impart and organise trainings about Chaitanya, T.L.M.<br />
preparation, textbook, evaluation, Theatre in Education etc. for<br />
teachers. Their area of work not only includes the above<br />
mentioned activities but also involves training of the SDMC<br />
Members and elected representatives of the Urban and Rural Local<br />
Bodies. BRCs are mainly responsible for quality improvement.<br />
� At the Block Level, Block Implementation Committees (BIC), Block<br />
Resource Groups (BRG), Block Planning Committees (BPC) are<br />
formed to oversee the smooth functioning and implementation of<br />
SSA activities.<br />
� At District Level District Implementation Committees (DIC),<br />
District Resource Group (DRG), District Planning Committees<br />
(DPC) are formed with the same objective as specified above.<br />
3.11 DIET(District Institute of Education and Training)<br />
AWP & B FOR 2007-08<br />
DIET Mangalore takes care of both the pre-service and in-<br />
service teacher education in the district. DIET is also the apex body in<br />
the district for primary teacher education. DIET has the freedom to<br />
undertake studies and implement innovative schemes for the benefit<br />
of teachers in the district.<br />
3.11.1 Structure of DIET<br />
The DIET has seven wings which take care of different aspects<br />
of teacher education. The details of the seven wings are not given<br />
here because they are already well known. Right now, the functions of<br />
DRU are under debate. Earlier this wing worked for adult and<br />
continuing education. But now that work is taken care of by other<br />
departments. So DRU has to grow as a resource unit for teachers and<br />
77
teacher educators. The ET wing is more concerned with the Mahithi<br />
Sindhu project than any other concerns. The work load is so much on<br />
the wing that it can not think of other possibilities. There is a need to<br />
reorganise the functioning of this wing allowing it to concentrate on<br />
other aspects of educational technology too.<br />
3.11.2 Role Expectations<br />
AWP & B FOR 2007-08<br />
DIET is supposed to cater to the pre-service and the in-service<br />
teacher education in the district. While the PSTE functioning is guided<br />
centrally by the KSEEB, DIET has all the freedom to design and<br />
implement courses in in-service teacher education. DIET has also the<br />
responsibility to design locally suitable curriculum for primary<br />
education, though this has not been done until now. Now that the<br />
Mahithi SIndhu project is extended to all the government schools,<br />
DIET has to monitor the project and ensure that the resources meant<br />
for this project are utilised properly. DIET is the apex body in teacher<br />
education in the district. It guides, designs and implements teacher<br />
training programmes. It also functions as a liaison officer between the<br />
DSERT and the various agencies concerned with education and<br />
teachers education.<br />
3.11.3 Linkages with BRCs, CRCs and Schools<br />
DIET co-ordinates teacher training programmes in various<br />
BRCs. It also monitors the functioning of the CRCs. Follow up work is<br />
also taken up by DIET to ensure the implementation of the new<br />
strategies taught in the training programmes. Monthly meeting are<br />
organised to review the functioning of these agencies<br />
3.13 CRC :<br />
There are 76 Cluster Resource Centres in the district with 76<br />
sanctioned posts of CRPs during the financial year 2006-07. We<br />
proposed 22 additional CRCs for the year 2007-08 as per the norms.<br />
Table 20<br />
Sl. No. Name of the Block<br />
78<br />
No of CRCs existing<br />
District<br />
1 Bantwal 16
3.14 BRC :<br />
AWP & B FOR 2007-08<br />
2 Belthangady 12<br />
3 Mangalore City 04<br />
4 Mangalore Taluk 17<br />
5 Moodabidri 06<br />
6 Puttur 12<br />
7 Sullia 09<br />
Total 76<br />
There are 5 Block Resource Centres (BRC) with 25 Block<br />
Resource Persons (BRPs) and 5 Block Resource Centre Coordinators<br />
(BRCC) in the district.We proposed additional 2 BRCs to Mangalore Taluk<br />
and Moodabidre Educational Blocks.<br />
The following table shows the block wise details of children who<br />
are out of school in the district. In the Age Group of 6-14, as identified<br />
by the Child Census 2006, there were totally 1076 children.<br />
Table 21<br />
Sl.<br />
No Name of Taluk<br />
79<br />
Out of school Children 6-14<br />
Boys Girls Total<br />
1 Bantwal 113 80 193<br />
2 Belthangady 46 52 98<br />
3 Mangalore City 51 70 121<br />
4 Mangalore Taluk 153 138 291<br />
5 Moodabidre 24 10 34<br />
6 Puttur 105 88 193<br />
7 Sullia 91 55 146<br />
Total 583 493 1076<br />
Source: Child Census Feb-2006<br />
Out of 1076 out of school children 1066 children have been<br />
mainstreamed during 2006-07 and remaining 10 children were not<br />
enroled due to migration of parents.<br />
Details of Children with Special Needs (CWSN):
The following table shows the details of CWSN of age group 6-14<br />
who were identified during special IED census conducted in the month of<br />
Jan-2006.<br />
Table 22<br />
Sl.<br />
No Block VI HI OPH MR LD OTHER TOTAL<br />
1 Bantwal 66 96 221 159 6 1 549<br />
2 Belthangady 190 103 99 213 180 129 914<br />
3 Mangalore City 35 49 79 160 88 2 413<br />
4 Mangalore Taluk 65 166 147 189 212 27 806<br />
5 Moodabidre 13 24 38 33 62 3 173<br />
6 Puttur 64 78 94 114 320 80 750<br />
7 Sullia 50 29 97 43 43 6 268<br />
TOTAL 483 545 775 911 911 248 3873<br />
Source: IED census 2006<br />
AWP & B FOR 2007-08<br />
80
AWP & B FOR 2007-08<br />
CHAPTER 2: Methodology<br />
In this chapter, the methodology employed by the monitoring team for<br />
data collection from the field has been described under three sections namely<br />
sampling design, tools for data collection and strategies for field data collection.<br />
The same is given in the foregoing sections.<br />
2.1 Sampling Design: As per the requirement of the TOR of the MHRD (GOI)<br />
a 5% sample of schools has to be covered for field data capturing in each district<br />
so as to represent both formal and alternative and innovative types. In order to<br />
do this, the monitoring team has employed a multi-stage, representative and<br />
systematic random sampling design based on the criteria of number, distribution<br />
of blocks and category of schools.<br />
In the first stage, 5% sample of schools was worked out for each district<br />
from out of the total number of government formal primary schools (both<br />
Lower Primary Schools and Higher Primary Schools) in the district. This gave the<br />
total number of schools that need to be covered for field visits.<br />
In the second stage, the blocks were selected from the district based on<br />
their geographical location in the district. In every district the sample size for<br />
blocks has been restricted so as to cover a minimum of 50% as it was not<br />
possible to include all the blocks for purpose of field data collection due to<br />
constraints of time, resource and quality output. However care has been taken to<br />
include blocks which are located away from the district head quarter as well as<br />
those which are within the district head quarter.<br />
In the third stage, after selecting the block, the 5% sample schools<br />
selected for the district was distributed among the sample blocks selected for field<br />
visits. The distribution was done proportionately as per the number of schools<br />
present in each of the blocks. Further the distribution has been done for both<br />
categories of Lower and Higher primary schools in the block separately. Thus the<br />
final number of schools that needed to be selected from each block and each<br />
category of primary schools in the district was obtained by this exercise.<br />
In the fourth stage, the actual schools for visit were selected. This was<br />
done using the EMIS school list data obtained from the State Project Office,<br />
Karnataka. The schools were selected from out of the list using systematic<br />
81
Name<br />
of<br />
blocks<br />
selecte<br />
d<br />
Beltha<br />
ngadi<br />
Puttur<br />
sampling technique so as to ensure not only unbiased selection, but also true<br />
representativeness. Thus in the final list of schools selected, care was taken to<br />
see that it included minority schools as well as EGS upgraded types.<br />
Alternative Innovative Education: In line with the requirement of the TOR by<br />
the MHRD(GOI), it was necessary to include alternative innovative education<br />
strategies in the 5% sample coverage for field monitoring. However, the<br />
monitoring team has considered this as an additional sample component over and<br />
above the 5% sample of formal schools selected in each district. Thus an<br />
additional number of 5-8 schools under this category in every district covering all<br />
types such as Residential Bridge course(RBC), NRBC (Non-Residential Bridge<br />
Course), Tent school, Mobile School, Seasonal Migration Residential School,<br />
KGBV, NPEGEL, Home based etc,. has been covered. The number of schools<br />
covered under this type is presented in the table in each of the district reports.<br />
BRC/CRC: As per the TOR by the MHRD (GOI), a minimum of 5 CRCs and 5<br />
BRCs was also to be covered in each district for SSA field monitoring. Thus from<br />
each district, 5 CRCs and 5 BRCs have been selected to capture the field data. So<br />
far as selecting the BRCs, all the sample blocks have been covered. In case of<br />
number of sample blocks selected in the district is less than five, the BRCs in the<br />
other blocks (non-sampled) have been selected on the basis of purposive<br />
randomness so as to make it 5. However, if the district had less than 5 BRCs, all<br />
the available number of BRCs has been covered including the non-sampled<br />
blocks. Similarly for selecting the 5 CRCs, a purposive random sampling<br />
technique has been used and the selection has largely been done from the<br />
sample blocks owing to the presence of sufficient number of CRCs in each block.<br />
The number of BRCs/CRCs covered is presented in the table in each of the district<br />
reports.<br />
Thus the overall sample size selected for Dakshina Kannada district is given in the<br />
following table.<br />
Table 2.1: Sample Size Selected in Dakshina Kannadai District<br />
No. of Schools Selected Alternative Schools<br />
LPS HPS Total<br />
3 10 13<br />
8 17 25<br />
AWP & B FOR 2007-08<br />
Tent<br />
School<br />
RBC NPEG<br />
EL<br />
82<br />
Home<br />
based<br />
school<br />
Mobile<br />
School<br />
EGS KGBV<br />
1 - - 3 - - -<br />
BRC CRC
Sulya 5 9 14<br />
Total<br />
16 36 52 1 - - 3 - - - 5 5<br />
2.2 Tools for Data Collection: As required by the TOR, for the purpose of<br />
monitoring field level data, it was necessary to collect data from different sources<br />
such as formal schools, alternative innovative education schools, CRCs, BRCs,<br />
District Project Office (DPO) and the State Project Office (SPO). This necessitated<br />
development of different kinds of tools for collecting comprehensive datasets,<br />
both in quantitative and qualitative kinds from the field. As has been mentioned<br />
earlier the field staff was oriented to collect the data using techniques such as<br />
questioning, interviewing and observing during their visits to schools. Besides,<br />
the data were also required to be gathered from several records, registers and<br />
documents maintained in the schools. Therefore, the school schedule, in<br />
particular has been designed in such a way that it lends itself for using variety of<br />
techniques while collecting data from different sources. Specific instructions have<br />
been inserted at appropriate places in the schedule to prompt the field<br />
investigator not only to collect the required data but also for using different<br />
techniques for the same.<br />
In all, five different data capture formats have been developed by the<br />
monitoring team, based on the tool given by the MHRD. The designing of these<br />
formats involved several meetings of the monitoring team members as these<br />
have been developed through participatory workshop modes. These<br />
meetings/workshops were held both at RIE, Mysore and Institute for Social and<br />
Economic Change, Bangalore. An unique feature of these formats is that they<br />
attempt to capture every single data unit specified by the TOR be it from the<br />
school, alternative school, CRC, BRC, DPO or the SPO. Further, the MS Excel<br />
design used for developing the tool renders itself for smooth data keying in and<br />
developing analysis format for data consolidation at the block, district and the<br />
state levels as required. While the individual items in the field level data capture<br />
formats from the formal schools and the alternative innovative education schools<br />
(herein referred to as school schedule) have been rendered into regional<br />
language (Kannada), all other schedules have been retained in English language.<br />
A copy of each of the same is enclosed with the report under annexure.<br />
Description of Tools: As mentioned earlier, five different data capture formats<br />
have been developed by the monitoring team. The same is described hereunder.<br />
AWP & B FOR 2007-08<br />
83
School Schedule: The school schedule includes main items such as opening of<br />
new schools, civil works, free text books, school grant, teacher and teacher<br />
training, teaching-learning material, children with special needs, DISE, SDMC,<br />
mid-day meals and other items such as enrolment, attendance, school health<br />
check up, evaluation scheme, school environment and facilities, co-curricular<br />
activities, learning attainments etc,. Under each one of these main items there<br />
were several sub-items, which attempted to capture specific details pertaining to<br />
the main item. In addition, the school schedule also included a master table<br />
format seeking enrolment and attendance each, class-wise, sex-wise and<br />
category-wise (general, SC, ST).<br />
The SPO Schedule : The SPO schedule includes items relating to opening of new<br />
schools, civil works, free text books, school grants, teacher and teacher training,<br />
teaching-learning materials, EGS,AIE, NRBC, RBC, children with special needs,<br />
NPEGEL, KGBV, DISE, SDMC, staffing pattern and position. Under each one of<br />
these main items there were several sub-items, which attempted to capture<br />
specific details pertaining to the main item.<br />
The DPO Schedule: The DPO schedule includes items relating to opening of<br />
new schools, civil works, free text books, school grants, teacher and teacher<br />
training, teaching-learning materials, EGS, AIE, NRBC, RBC, children with special<br />
needs, NPEGEL, KGBV, DISE, SDMC, Research and Evaluation, staffing and<br />
BRCs,CRCs. Under each one of these main items there were several sub-items,<br />
which attempted to capture specific details pertaining to the main item.<br />
BRC/CRC Schedule: The BRC/CRC schedule includes main items relating to<br />
staffing pattern and position, teacher and teacher training and children with<br />
special needs. Under each one of these main items there were several sub-items,<br />
which attempted to capture specific details pertaining to the main item.<br />
Alternative Innovative Education: Under this category, separate tools have<br />
been developed for each one so as to capture the required data from the field<br />
visits along the lines of the TOR. Each one of them is described herein.<br />
NPEGEL: This schedule includes items relating to model cluster school, gender<br />
sensitive TLM, vocational education, gender empowerment for teachers,<br />
community mobilisation for girls’ education, ECCE, activity documenting format,<br />
frequency of reporting etc,. Under each one of these main items there were<br />
AWP & B FOR 2007-08<br />
84
several sub-items, which attempted to capture specific details pertaining to the<br />
main item.<br />
KGBV: This schedule includes items relating to function, land identification, civil<br />
works, sanctioned and filled in positions, enrolment and provision of facilities<br />
including boarding and lodging arrangements and maintenance of the inmates<br />
etc,. The specific items to elicit further information relating to each one of the<br />
items are also included in the schedule.<br />
RBC/NRBC : This schedule includes items relating to enrolment, attendance,<br />
volunteers, training, mainstreamed children, infrastructure, learning attainment<br />
levels, text books, TLM etc,. the specific questions relating to each one of these<br />
items are also included in the schedule.<br />
Tent/Mobile : The same RBC/NRBC schedule has been used for collecting data<br />
relating to these types of schools with suitable modifications wherever required.<br />
EGS Upgraded: This schedule includes items relating to up gradation, building<br />
construction, civil works, teacher deployment etc,.<br />
Home Based: This schedule includes items relating to child’s profile, volunteer,<br />
education and training, mode of recruitment, monitoring support etc,.<br />
2.3 Strategies for Field Data Collection<br />
Logistic Support from the SPO/DPO: The data collection from the field<br />
involved the support and cooperation of the SSA offices right from the state level<br />
through the district level to the block and sub block levels. As such sufficient<br />
effort was made by the MI in terms of obtaining official procedural sanctions. The<br />
data collection from the field by the MI team was preceded by a meeting with the<br />
SPO followed by the DPO, wherein the offices were apprised with regard to the<br />
kinds and quality of data requirement from the offices/school and the kind of<br />
logistic support to be provided to the monitoring teams during the field visits.<br />
Accordingly, the field visits were planned with prior intimation to the SPO and the<br />
DPO and after ascertaining the availability of the field functionaries for<br />
interaction with the monitoring teams during the field visits as well as for<br />
enabling the monitoring team in smooth data collection from the schools, CRCs,<br />
BRCs, Alternative & Innovative Strategies and the DPO/DIET etc,.<br />
AWP & B FOR 2007-08<br />
85
Planning: Data collection was a challenge, as it required covering 5% of the<br />
actual number of schools in a district. As the task involved collection of data at<br />
three levels, i.e., at the state level (SPO), at District level (DPO) and at school<br />
level, the needed information was first segregated at three levels. The tools<br />
meant for data collection at state level and district levels were kept separately<br />
and the tools to be used at school level were printed in tune with the number<br />
required in every district.<br />
A separate meeting was held at Bangalore to train the field officers in<br />
understanding the requirements of data collection activity. Apart from this they<br />
were also taken to a school to actually show how different information will have<br />
to be sought and recorded. Thus, the field officers were adequately trained in the<br />
task of data collection work. This was necessary as they had the responsibility of<br />
training field level functionaries whom these field officers eventually appointed.<br />
Personnel Involved: Since the field work involved working in at least for 50<br />
working days, and covering 5% of the actual schools in every district, the<br />
monitoring institutes had no option but to appoint field functionaries. They<br />
included the following. For every district, the following was planned.<br />
Monitoring Institute to Coordinate Data Collection Work<br />
One Field Officer<br />
AWP & B FOR 2007-08<br />
One Desk Officer<br />
Four to Eight Field Investigators Per District Depending on the Number<br />
and Spread of School Coverage<br />
Method: The method of data collection at state, district and sub district levels<br />
varied. At the state level, the SPO was requested to facilitate the work of<br />
providing data from the state office. Similarly, cooperation was sought to gather<br />
data from the district and sub-district offices through issue of official circulars and<br />
orders. Concerned data capture formats were sent to these offices to collect the<br />
required data. Wherever possible the soft copies of the formats were sent to<br />
offices and the data were procured in soft copy formats by the MI. Efforts were<br />
also made to obtain data from the DIETs as they were also involved in SSA<br />
activities for the district.<br />
86
Data Quality Assurance Measure: In order to ensure quality in the datasets<br />
that were intended to be collected, all necessary precautions were kept in mind.<br />
For instance, in the inner cover page, a provision has been made where, the<br />
headmaster of the school will sign the booklet along with his seal and the field<br />
investigator also signs, after the school data are recorded. Apart from this, the<br />
data collected were physically checked, discussed and only then were received by<br />
the field officer from the field investigators. Again the monitoring institute did a<br />
sample check of some booklets and compared it with the list of sampled schools<br />
to check for any deviation. After ensuring that there was no deviation from the<br />
originally drawn set of sampled schools, they were accepted as completed work<br />
and made available to keying in into the computer.<br />
Keying in: The verified booklets were accepted for computer keying in. All the<br />
school data were keyed in. They were compiled and district profiles were<br />
prepared after integrating the data collected from the school, from the district,<br />
from the state, apart from BRCs and CRCs.<br />
Consolidation and Tabulation: Once the district profiles were developed, the<br />
consolidation work got over and the collected data were tabulated. The tabulated<br />
facts and figures became the basis for generation of the present report.<br />
Facilitating Report Writing: The basic TOR of MHRD, GOI has been the basis<br />
for undertaking the work and logically, the report also must be able to respond to<br />
the issues raised in the TOR. The tabulation and integration of information drawn<br />
from the state level, district level and sub district levels enabled and facilitated<br />
report writing work.<br />
AWP & B FOR 2007-08<br />
XXXXXXXX<br />
87
CHAPTER 3: REVIEW OF AWP&B AND ANALYSIS OF FIELD DATA<br />
1. OPENING OF SCHOOLS (BOTH PRIMARY &<br />
UPPER PRIMARY SCHOOLS)<br />
As revealed from the AWP&B, the district had planned for only 5 new primary<br />
schools in the year 2008-09 as spill over. Under this component, 10 regular new<br />
teachers’ salary has an approved outlay of Rs. 2.40 lakhs. There is no<br />
expenditure under this as the teachers are yet to be recruited.<br />
From the DPO data it is seen that all the 5 schools are sanctioned and the work<br />
has not started as yet. 10 teachers are sanctioned, who are yet to be appointed.<br />
From the field data, it is seen that the two new schools identified in the sample<br />
are found to be currently working in another school. In both these cases, the<br />
land has been identified and money released to SDMC. Even the TLE grant has<br />
also been released to these schools, teachers have been appointed and even the<br />
building construction is underway.<br />
2. CIVIL WORKS<br />
271 civil works reveals an outlay of Rs. 671.409 lakh. There is more than<br />
adequate progress with more than 87.00 per cent of the money already being<br />
spent.<br />
From the DPO data it is seen that the work of the new schools is yet to be<br />
started. Even work relating to additional classrooms, special toilets for CWSN,<br />
BRC have not started.<br />
From the field data, it is seen that grant has been released to all the SDMCs for<br />
construction of 33 additional classrooms during the year. Out of this, the work<br />
has begun in 22 cases. The progress for this reveals that 9 are in foundation<br />
stage and the remaining 13 are in basement stage. Similarly money has also<br />
been released for to SDMCs for construction of 3 new schools and 4 special toilets<br />
for CWSN. On the spot observation revealed that in one case, the civil works for<br />
additional classroom had come upto lintel level. In all these cases, the SDMC has<br />
received both technical training and guidelines for civil works. The technical<br />
committee is in place to supervise the quality of civil works and are also seen to<br />
visit the sites as per schedule, and the SDMCs have maintained separate<br />
accounts relating to all aspects of civil works. Overall the quality of civil works is<br />
found to be quite satisfactory.<br />
AWP & B FOR 2007-08<br />
88
3. TEXT BOOKS<br />
78,775 children are covered under this scheme with an outlay of Rs. Rs.69.083<br />
lakh. All the money has been spent revealing excellent progress.<br />
From the DPO data it is noticed that altogether 73038 children from primary and<br />
upper primary schools are found to be receiving text books. Considering the total<br />
enrolment of 121123 in the district in these schools, the percentage of children<br />
receiving text books works out to 60.03 per cent.<br />
From the field data, it is noticed that<br />
4. SCHOOL GRANTS<br />
The district has registered excellent progress with almost 100.0 per cent fund<br />
utilization for 2012 schools.<br />
From the DPO data it is seen that a total of 2003 schools had received grant,<br />
which included 1166 primary and 837 higher primary schools. The grant was<br />
released in the month of May itself along with guidelines.<br />
From the field data, it is seen that all the 50 schools except 2 schools had<br />
received school grant in the month of June itself. The grant in general was<br />
generally found to be used for repairs, furniture purchase, painting, drinking<br />
water, electricity bill payment, plumbing work, school name board, calculator,<br />
laboratory items, CD player etc,. In the previous year, almost all schools had<br />
utilized the entire grant.<br />
5. TEACHERS AND TEACHER TRAINING<br />
Teachers’ salary (recurring) under this had an outlay of Rs. 505.08 lakhs out of<br />
which Rs. 392.12 lakh have been spent upto January. Thus utilization is to the<br />
tune of 77.64 per cent, which may be considered as satisfactory..<br />
AWP & B FOR 2007-08<br />
89
No data are provided by the DPO under this activity.<br />
From the field data it is seen that overall 60.0 per cent of the schools have<br />
teachers in position. About 17 schools revealed teacher absence on the day of<br />
visit. In these schools the teachers had gone to attend training. Over 66.6 per<br />
cent of the teachers had undergone in-service training at the DIET and BRCs.<br />
Almost all teachers reported about giving feedback to the training programme<br />
and same percentage of teachers reported that the training was effective. The<br />
training covered all curricular subjects. However, teachers expressed the need for<br />
more training in English, Maths, Hindi, Computers, administrative, social science,<br />
life science and extra curricular subjects.<br />
6. TEACHING LEARNING MATERIAL (TLM) GRANT<br />
The district had an outlay of Rs. 41.18 lakhs for 8236 teachers in primary and<br />
upper primary schools. Out of this, 83.05 per cent has been utilized upto January<br />
2009, which may be considered as adequate progress.<br />
From the DPO data it is noticed that Rs.30.32 lakh has been released to 6108<br />
teachers towards TLM grant, which works out to 73.6 per cent, which is not only<br />
less than what is revealed in AWP&B but also a poor reflection on the district’s<br />
performance as all the grant should have been released to teachers by now.<br />
From the field data, it is seen that except one school, in all schools all eligible<br />
teachers had received TLM grant. All of them had received Rs.500/- per teacher.<br />
While 64.0 per cent had displayed the TLM within the classroom, the remaining<br />
34.0 per cent had displayed separately in the classroom. In all the schools, it was<br />
found to be used by pupils. Similarly, all teachers had received training for TLM at<br />
the BRCs. A large majority of schools have reported about sharing of good<br />
practices.<br />
7. EGS & AIE<br />
The district reveals an outlay of Rs.20.500 lakh, out of which 86.80 per cent has<br />
been spent. This may be considered as adequate progress.<br />
From the DPO data it is seen that the district had started all the 11 sanctioned<br />
RBC (Chinnara Angala), 1 Ashakirana (including I previous year’s) and 86 NRBC.<br />
However, the 3 sanctioned tent schools have not been started, which rather<br />
reflects poor planning. The proposed 120 HBE has also been started. There are<br />
also 341 children covered under SED. While the enrolment in RBC (CA) reveals<br />
accomplishment of the target, there is slight shortfall in Ashakirana with a<br />
difference of 7 children. HBE and SED reveal full target accomplishment which<br />
deserves appreciation of the district.<br />
AWP & B FOR 2007-08<br />
90
From the field data it is noticed that one Ashakirana run by Prajgna Counselling<br />
centre, an NGO had 50 children enrolled and during the visit to this centre, all<br />
children excepting 2 boys had gone to school. These two boys had stayed away<br />
due to some sickness. On interacting with these boys, it was noticed that the<br />
facilities offered at the centre for both lodging and boarding were quite<br />
satisfactory and even the learning levels of these boys were fairly satisfactory.<br />
The centre also made provisions for providing academic support to these children.<br />
The centre had adequate number of staff and they all seemed to be satisfied with<br />
their work and emoluments.<br />
Subsequent visits to schools to assess the learning levels of these mainstreamed<br />
children, it is quite pleasing to note that by and large all of them had fairly<br />
satisfactory level of learning competencies.<br />
8. CHILDREN WITH SPECIAL NEEDS<br />
6250 children were covered with an outlay of Rs. 75.0 lakh. 86.1 per cent of<br />
this amount has been utilized so far revealing very satisfactory progress.<br />
From the DPO data it is seen that the district had identified 6250 CWSN, out of<br />
which 4153 have been enrolled, which works out to 66.5 per cent. The shortfall of<br />
more than 25.0 per cent children under this intervention needs to be explained.<br />
The number of CWSN provided with assistive devices is found to be 596. 21<br />
resource teachers have been identified and 1 NGOs is found to be collaborating.<br />
572 children out of these have been provided with HBE support.<br />
From the field data, it is noted that in 40.0 per cent of the schools, CWSN<br />
children had attended the medical camp. In these schools, 10 children from 11<br />
schools were found eligible to receive assistive devices. From out of these<br />
children, 7 children had received the aids. The remaining 3 had not received the<br />
aids due to installation problem and lack of proper understanding of the mobility<br />
device. Only in 2 schools, there was problem in use of hearing aid. Further, in<br />
88.0 per cent of the schools, there was a ramp built as per requirements. In 34.0<br />
per cent of the schools had 29 severely disabled children enrolled under home<br />
based support. The attendance among the CWSN on the day of visit was more<br />
than 90.0 per cent.<br />
9. NATIONAL PROGRAMME FOR EDUCATION OF<br />
GIRLS AT ELEMENTARY LEVEL (NPEGEL)<br />
There is no NPEGEL in the district.<br />
AWP & B FOR 2007-08<br />
91
10. KASTURBA GANDHI BALIKA VIDYALAYA<br />
(KGBV)<br />
There is no KGBV in the district.<br />
11. DISTRICT INFORMATION SYSTEM FOR<br />
EDUCATION (DISE)<br />
The district reveals an outlay of Rs. 88.34 for MIS, out of which 50.0 per cent has<br />
been spent so far.<br />
From the DPO data it is seen that all aspects relating to EMIS are in place.<br />
From the field data it is seen that all sample schools except one school had<br />
received data capture formats in time and all teachers had received training in<br />
this regard. All schools reported about 5% data verification by the BRCs/CRCs.<br />
12. RESEARCH AND EVALUATION<br />
The district records 52.80 per cent fund utilization under this, which may be<br />
considered inadequate. Under innovative activity also, there is inadequate<br />
progress as the district reveals fund utilisation to the extent of 33.35 per cent<br />
only.<br />
13. FUNCTIONING OF VEC<br />
Excellent progress is seen with 100.0 per cent fund utilization.<br />
No details are available in the DPO data.<br />
From the field data it is seen that all schools except one school had SDMC in place<br />
as per norms. These schools also were in possession of the SDMC guidelines.<br />
There was regular monthly meeting of the SDMCs in these schools. over 90.0 per<br />
cent of the schools revealed attendance in SDMC meetings between 51-100.0 per<br />
cent. In the remaining schools, the attendance ranged between 10 to less than<br />
50.0 per cent. More than 75.0 per cent of the schools reported about 50 to 100.0<br />
AWP & B FOR 2007-08<br />
92
per cent attendance of women members in the SDMC meetings. Close to 50.0 per<br />
cent of the schools reported about all SDMC members having undergone training.<br />
Over 30.0 per cent of the schools reported about 50 to 80 per cent of the<br />
members having undergone training. Majority of the members expressed good<br />
opinion about the training.<br />
14. STAFFING AT STATE AND DISTRICT LEVEL<br />
With regard to staffing at the DPO, all are in place excepting two FDCs. Similarly<br />
at the BRCs, except one, all coordinators are in place. However, 4 BRPs (HS) and<br />
5 BRPs (PS)3 BRPs are vacant in BRCs and in CRCs, there are 14 vacancies.<br />
15. MID-DAY MEAL SCHEME<br />
All schools served variety of hot cooked food under mid-day meal. The schools<br />
also displayed daily menu list. Schools also reported about greens and vegetables<br />
being part of the MDM, although not regularly. The number of schools, which<br />
served same menu was negligible. In general all children took mid day meal. As<br />
per records of the school, only less than 30.0 per cent of the schools revealed<br />
some minor differences in the number of children enrolled, attended and took<br />
MDM. These differences were quite small and single digit. There was almost<br />
concurrence in the numbers based on the head count and as revealed in the<br />
MDM registers. Even there was not much of a difference between the number of<br />
children who took MDM on the day of visit and on the previous day thereby<br />
suggesting consistency in the MDM beneficiary statistics. In fact it was noticed<br />
that in some of the schools, the excess food was again served in the evening<br />
during remedial teaching programmes. Sometimes, some of the children also<br />
packed and carried MDM home.<br />
All schools reported about receiving the food grains on time regularly. The food<br />
grains were delivered to schools. About 8 schools reported about not having<br />
sufficient buffer stock. Except two schools, all other schools received cooking cost<br />
well in advance. In times of delay either the HM or the SDMC met the cost. There<br />
was no discrimination of any kind with regard to caste and gender either during<br />
serving of the food or in seating arrangement. A little over 10.0 per cent of the<br />
schools reported about not being able to adhere to the menu. All children<br />
expressed satisfaction with respect to quantity and quality of the food served<br />
under MDM. Pleasantly all schools provided micronutrients and deworming<br />
regularly. All schools were seen to maintain health card for children. All schools<br />
cooked food in the school itself. More than 95 % of the schools had sufficient<br />
number of staff for cooking MDM. Most of them were drawn from SHGs and<br />
belonged to disadvantaged communities. While all cooks received Rs.800/- p.m.<br />
the assistants received between Rs.400-500 p.m. the remuneration was received<br />
regularly. All schools used gas for cooking MDM. All schools had potable water for<br />
drinking. The general environment of cooking and eating MDM was clean and<br />
safe. All children are found to take MDM in orderly manner and were also found to<br />
be encouraged with respect to personal hygiene and water conservation. While in<br />
30.0 per cent of the schools the SDMC/panchayats participated in the MDM<br />
AWP & B FOR 2007-08<br />
93
programme many times, in 66.0 per cent of the remaining schools, they were<br />
found to participate only occasionally.<br />
16. ADDITIONAL ITEMS CHECKED DURING SCHOOL<br />
VISITS BY MI<br />
From the sample schools from the field, it is noticed that the total working days<br />
ranged from 226 to 236. The average of the same was found to be 230. Over<br />
72.0 per cent of the schools had good building, another 22.0 per cent had<br />
partially good building and in only one school the building was not good. All<br />
schools had clean environment. More than 95.0 per cent of the schools have good<br />
classrooms with adequate light, ventilation and blackboard. However, while 62.0<br />
per cent of the schools had adequate play ground facility, another 26.0 per cent<br />
of the schools have small play ground and another 10.0 per cent of the schools<br />
have no play ground at all. Over 82.0 per cent of the schools have TLM and<br />
another 16.0 per cent of the schools have insufficient TLMs. Over 60.0 per cent of<br />
the schools have insufficient play equipment. However large majority of the<br />
schools let children use them.<br />
Over 92.0 per cent of the schools had organized health camp. In 22.0 per cent of<br />
the schools, there was low attendance problem for which efforts are made by the<br />
SDMC to visit homes of such children and providing all incentives to them. There<br />
was continuous and comprehensive evaluation system in place and grading<br />
system was being adopted for pupils assessment. About 12 schools reported<br />
about under and over aged children. There were more underaged than overaged<br />
children. 5 schools reported about children leaving the school in the past six<br />
months and 3 schools reported about these children joining other schools. Overall<br />
rapport between pupils and teachers was quite good.<br />
REMEDIAL TEACHING<br />
The district had planned remedial teaching for 13,392 children with an outlay of<br />
Rs. 66.960 lakhs. There is inadequate progress with 61.0 per cent utilization.<br />
During the visit, it was noticed that the remedial teaching was in full swing after<br />
the school hours. It was reported by the school, that all children were involved in<br />
the remedial programme within the given budget and there was full cooperation<br />
from the parents. Similarly teachers seemed to be seriously engaged in this<br />
activity.<br />
BRC<br />
The district reveals excellent progress with 98.3 per cent fund utilization<br />
AWP & B FOR 2007-08<br />
94
CRC<br />
The district reveals excellent progress with almost 100.0 per cent fund utilization.<br />
SSA OVERALL TOTAL<br />
The district had an overall allocation of Rs. 2218.676 lakh allocation for the year<br />
2008-09. Out of this, Rs.1757.852 lakh has been spent so far accounting for close<br />
to 80.0 per cent, which may be considered quite satisfactory.<br />
The district is a special focus district (SFD) during the year 2008-09.<br />
Under this, the district has focused on SSA activities relating to minority<br />
community (Muslims). It is seen that the district had initiated activities<br />
through release of a public notification in press calling for NGOs<br />
participation for mainstreaming girls from muslim communities.<br />
Accordingly, two NGOs, Zamait Ullah Falah and VALORED were<br />
identified to undertake innovative activities in this direction. From the<br />
field data it is noticed that a total amount of Rs.12.25 lakh was released<br />
to carry out activities in all the 7 blocks in the district. The activities that<br />
were organized under this intervention included awareness campaigns<br />
for religious and community leaders, mother and fathers. In addition,<br />
seminar relating to minority children was organized at block level and<br />
also a field study of the minority children were also undertaken. Special<br />
awareness campaigns for muslim girl children were also organized at the<br />
block level. In Mangalore taluk, a 12 month RBC has also been started.<br />
AWP & B FOR 2007-08<br />
***********<br />
95
1 23003 2924 DAKSHINA KANNADA<br />
DAKSHINA KANNADA DISTRICT<br />
292402 BELTHANGADY GLPS, BENGILA<br />
2 23010 2924 DAKSHINA KANNADA 292402 BELTHANGADY GUPS, ANIYOOR<br />
3 23038 2924 DAKSHINA KANNADA 292402 BELTHANGADY GUPS, KORANJA<br />
GLPS, KANIYOOR<br />
4 23045 2924 DAKSHINA KANNADA 292402 BELTHANGADY KASABA<br />
GUPS,<br />
5 23056 2924 DAKSHINA KANNADA 292402 BELTHANGADY KASHIPATNA<br />
6 23082 2924 DAKSHINA KANNADA 292402 BELTHANGADY GLPS, KUNTINI<br />
GUPS, ELANEERU<br />
7 23091 2924 DAKSHINA KANNADA 292402 BELTHANGADY GUTHYADKA<br />
8 23104 2924 DAKSHINA KANNADA 292402 BELTHANGADY GUPS, UMBETTU<br />
GLPS,<br />
9 23118 2924 DAKSHINA KANNADA 292402 BELTHANGADY SOOLABETTU<br />
GUPS,<br />
10 23135 2924 DAKSHINA KANNADA 292402 BELTHANGADY PANDIJEVALYA<br />
11 23150 2924 DAKSHINA KANNADA 292402 BELTHANGADY GUPS, KEMMATE<br />
GUPS,<br />
12 23178 2924 DAKSHINA KANNADA 292402 BELTHANGADY SARALIKATTE<br />
13 23710 2924 DAKSHINA KANNADA 292404 PUTTUR GUPS, AITHOOR<br />
14 23717 2924 DAKSHINA KANNADA 292404 PUTTUR GUPS, ARIYADKA<br />
15 23729 2924 DAKSHINA KANNADA 292404 PUTTUR GUPS, BAJATHUR<br />
G.L.P SCHOOL<br />
16 23743 2924 DAKSHINA KANNADA 292404 PUTTUR AMAI<br />
17 23749 2924 DAKSHINA KANNADA 292404 PUTTUR GUPS, MITHADKA<br />
GUPS,<br />
18 23752 2924 DAKSHINA KANNADA 292404 PUTTUR BETTAMPADY<br />
19 23764 2924 DAKSHINA KANNADA 292404 PUTTUR GLPS, IDYADKA<br />
GUPS,<br />
20 23765 2924 DAKSHINA KANNADA 292404 PUTTUR GOLITHATTU<br />
21 23779 2924 DAKSHINA KANNADA 292404 PUTTUR GUPS, MURA<br />
22 23791 2924 DAKSHINA KANNADA 292404 PUTTUR GLPS, HOSTHOTA<br />
23 23795 2924 DAKSHINA KANNADA 292404 PUTTUR GMUPS, KEYYURU<br />
24 23796 2924 DAKSHINA KANNADA 292404 PUTTUR GUPS, THEGGU<br />
25 23798 2924 DAKSHINA KANNADA 292404 PUTTUR GLPS, ETTIYADKA<br />
GUPS,<br />
26 23807 2924 DAKSHINA KANNADA 292404 PUTTUR ONTHRADKA<br />
27 23822 2924 DAKSHINA KANNADA 292404 PUTTUR GUPS, KONAJE<br />
28 23833 2924 DAKSHINA KANNADA 292404 PUTTUR GLPS, VALYA<br />
29 23837 2924 DAKSHINA KANNADA 292404 PUTTUR GMUPS, KAVU<br />
GUPS,<br />
30 23840 2924 DAKSHINA KANNADA 292404 PUTTUR MADANNURU<br />
GUPS,<br />
31 23849 2924 DAKSHINA KANNADA 292404 PUTTUR ALANTHADKA<br />
32 23863 2924 DAKSHINA KANNADA 292404 PUTTUR GUPS, PADNUR<br />
GLPS,<br />
33 23870 2924 DAKSHINA KANNADA 292404 PUTTUR CHENNAVARA<br />
GUPS,<br />
34 23877 2924 DAKSHINA KANNADA 292404 PUTTUR KUMARAMANGALA<br />
GUPS,<br />
35 23910 2924 DAKSHINA KANNADA 292404 PUTTUR KUTTINOPINADKA<br />
GLPS, SANJAYA<br />
36 23925 2924 DAKSHINA KANNADA 292404 PUTTUR NAGAR<br />
37 23934 2924 DAKSHINA KANNADA 292405 SULLIA GLPS, NIDUBE<br />
AWP & B FOR 2007-08<br />
96
38 23935 2924 DAKSHINA KANNADA 292405 SULLIA<br />
GUPS,<br />
DEVARAKANA<br />
GUPS,<br />
39 23949 2924 DAKSHINA KANNADA 292405 SULLIA KANTHAMANGALA<br />
GMUPS,<br />
40 23967 2924 DAKSHINA KANNADA 292405 SULLIA ARANTHODU<br />
41 23968 2924 DAKSHINA KANNADA 292405 SULLIA GLPS, BILIYAR<br />
GUPS,<br />
42 23983 2924 DAKSHINA KANNADA 292405 SULLIA DEVACHALLA<br />
43 23989 2924 DAKSHINA KANNADA 292405 SULLIA GLPS, SEVAJE<br />
44 23999 2924 DAKSHINA KANNADA 292405 SULLIA GUPS, VALALAMBE<br />
45 24015 2924 DAKSHINA KANNADA 292405 SULLIA GUPS, KENYA<br />
46 24019 2924 DAKSHINA KANNADA 292405 SULLIA GLPS, MOOVAPPE<br />
GUPS,<br />
47 24025 2924 DAKSHINA KANNADA 292405 SULLIA BANGLEGUDDE<br />
GUPS, MITHADKA<br />
48 24043 2924 DAKSHINA KANNADA 292405 SULLIA MARKANJA<br />
49 24058 2924 DAKSHINA KANNADA 292405 SULLIA GUPS, PERUVAJE<br />
50 24059 2924 DAKSHINA KANNADA 292405 SULLIA GLPS, GOONADKA<br />
GLPS,<br />
51 24071 2924 DAKSHINA KANNADA 292405 SULLIA KODIYALABAILU<br />
AWP & B FOR 2007-08<br />
97
SSA Monitoring of Udupi District of<br />
Karnataka: A Report<br />
AWP & B FOR 2007-08<br />
Prepared by<br />
Dr. M.D.Usha Devi<br />
ISEC, Bangalore<br />
Submitted to<br />
Ministry of Human Resource Development<br />
Government of India<br />
2009<br />
Preface<br />
The present monitoring report relating to Udupi District of Karnataka is an<br />
outcome of the task assigned by the Ministry of Human Resource Development,<br />
Government of India, and the task accomplished by the Institute for Social and<br />
98
Economic Change, (ISEC) Bangalore for monitoring progress and implementation<br />
of SSA activities in Karnataka.<br />
The task required visiting two blocks in the district as sample blocks<br />
covering 33 schools, four BRCs and five CRCs along with capturing activities<br />
under Out of School Strategies and civil works. The monitoring task has been<br />
accomplished satisfactorily with the cooperation extended by the State Project<br />
Office, the District Project Office and the sub-district office functionaries and the<br />
project team members. In particular, Sri. N. Shivaprakash, Dy.PC of Udupi district<br />
and his SSA team who extended excellent support in the field at various stages of<br />
this work deserve special word of appreciation and thanks from us. The<br />
coordinator is indeed thankful to the MHRD for having given this wonderful<br />
opportunity to visit different districts, understand the implementation of SSA<br />
across the blocks in the district and to prepare reports based on the analysis of<br />
the field data captured. Our thanks are also due to the State Project Director,<br />
Director (SSA Programmes), programme officers from the state project office,<br />
SSA Mission, GoK and all those who have provided excellent cooperation in this<br />
endeavour.<br />
The coordinator is also thankful to the Director, ISEC for extending full<br />
support to carryout the SSA monitoring task. The entire project team deserves<br />
the appreciation for the professional support rendered at various stages in this<br />
huge monitoring task.<br />
The final report is prepared keeping in view the terms of reference given<br />
by the MHRD. It is hoped that the readers of this report would get a picture of<br />
how Udupi district is performing in implementing SSA programme.<br />
Project Team<br />
AWP & B FOR 2007-08<br />
99<br />
M. D. Usha Devi<br />
Coordinator,<br />
MHRD/GoI SSA<br />
Monitoring<br />
Karnataka<br />
Position in the Project<br />
1 Dr. M.D.Usha Devi Coordinator & MHRD Team Lead<br />
Member, Udupi District<br />
2 Mr. Datta Saraf<br />
Desk Officer, Udupi District
3 Sri. P. Mahadeviah<br />
AWP & B FOR 2007-08<br />
100<br />
Field Officer, Udupi District<br />
4 Sri. Gurudas Field Investigator, Baiandoor Block<br />
5 Sri. Krishna Field Investigator, Udupi Block
Preface<br />
Project Team<br />
Content page<br />
Chapter 2: Methodology Used:<br />
AWP & B FOR 2007-08<br />
Contents<br />
Chapter 1: District Profile and Historical Background<br />
2.1 Sampling Design<br />
2.2 Tools for Data Collection<br />
2.3 Strategies for Field Data Collection<br />
Chapter 3: Review of AWP&B and Analysis of Field Data<br />
101
DISTRICT PROFILE<br />
AWP & B FOR 2007-08<br />
CHAPTER 1<br />
Udupi is a newly bifurcated district from DAKSHINA KANNADA. Which come into<br />
existence on 01-07-1998. It is located in the South Western part of Karnataka<br />
having Dakshina Kannada in the South, Uttara Kannada in the North, Shimoga<br />
and Chikamagalur in the East and Arabian Sea in the West as its borders. The<br />
district has a coastal belt of about 110 K.M. N.H. 17 passes through the coastal<br />
line, which connects the state with Kerala and Maharastra.<br />
Udupi is well known in India for its famous Sri Krishna temple. It is also<br />
known for hotel business, education, banking, communication, transport, etc.<br />
Udupi City :<br />
Udupi City, the district center is famous for lord Sri Krishna Temple and Ashta<br />
Mathas. It is also a commercial and educational center. Malpe is the biggest<br />
fishing labour of Karnataka and one of the important business centres which is<br />
about 6 kms from Udupi city.<br />
Manipal :<br />
Manipal is well known for its educational institutions and medical facilities.<br />
Kasturba Hospital and Medical college attracts hundreds of students from abroad.<br />
Manipal University of Manipal is having a number of educational institutions.<br />
Kollur :<br />
Kollur is famous for Sri Mookambika Temple, which is a holy place for Hindus. It<br />
was established by Sri Shankaracharya, the Adwaitha philosopher. Now it attracts<br />
thousands of pilgrims from allover the country.<br />
Karkala :<br />
A Taluk Centre and it is famous for Gomateshwara statue. Nitte is one of the<br />
important education centres of the district which is very nearer to Karkala.<br />
Maravanthe, Kaup, St. Mary's Island, Malpe Vadabandeshwara, Attur Church,<br />
Barkur are the important places of tourism.<br />
102
Climate and Occupation:<br />
There is a heavy rainfall during monsoon i.e., between June and September. The<br />
district receives an average rainfall of about 4000mm. Perspiration is a common<br />
phenomenon during summer because of high humidity. Winter is not too cold<br />
here. The Agriculture is one of the important occupations of the people. Paddy,<br />
Sugarcane, Coconut, Areca nut are the some important crops. Fishing is another<br />
important occupation of the people. The people of Udupi are also known for their<br />
banking and hotel business. Sugar Factory, Tiles and Bricks factories, Cashew nut<br />
factories are the small industries.<br />
Some great persons of the District:<br />
Madhwacharya, a great Dwaitha Philosopher was born in this district, who<br />
established Asta Mathas of Udupi. In the field of literature Udupi gets top<br />
position. Dr. Kota Shivarama Karanth and Dr. U.R. Ananthamurthy are the two<br />
famous Jnanapeeth Awardees. Gopalakrishna Adiga, is a great poet of the<br />
district.<br />
Prof. U.R. Rao one of the greatest scientists of the country belongs to this district.<br />
Ex. LokSabha Speaker Justice K.S. Hegde, Ex. Minister of Central Cabinet T.A. Pai<br />
are the great political leaders of our district. In the film industries Shyam<br />
Benegal, B.V. Karanth are the names of this district. Prakash Padukone, a<br />
famous Badminton player belongs to this district.<br />
Yakshagana is one of the folk arts of the district attracts thousands of people.<br />
Yakshagana melas (Troups) travel in various foreign countries and is praised by<br />
them.<br />
Kannada, Tulu, Konkani are the languages of the district. Billavas, Mogaveeras,<br />
Bunts, Brahmins are the prominent communities. Christians and Muslims are also<br />
in significant number. There are backward communities like Koragas, Kudubis,<br />
Schedule caste and Schedule tribes etc. The people of Udupi are forward in<br />
literacy, and they are peace loving and hard workers.<br />
In Udupi district public awareness about the importance of education leads to a<br />
high literacy rate, voluntary enrollment and also retention. There is a lot of<br />
encouragement for education by the community leaders, voluntary organizations,<br />
AWP & B FOR 2007-08<br />
103
Taluk<br />
NGO’s, Sri Krishna Math, Sri Kshetra Dharmastala, Sri Kshetra Kollur and many<br />
individual personalities.<br />
Table 1.10 Details of Villages, Hoblies ,Village Panchayaths and<br />
Municipalities:<br />
No of<br />
Village<br />
s<br />
No of<br />
Hobalies<br />
AWP & B FOR 2007-08<br />
No of<br />
Village<br />
Panchayat<br />
s<br />
104<br />
No of<br />
Municipalities<br />
No of<br />
ward<br />
s<br />
No of<br />
Habitatio<br />
ns<br />
No of<br />
M.L.A.<br />
Seats<br />
Kundapura<br />
Udupi<br />
99<br />
106<br />
3<br />
4<br />
56<br />
61<br />
1<br />
2<br />
9<br />
47<br />
768<br />
818<br />
2<br />
3<br />
1<br />
Karkala 50 2 29 1 6 777 1 -<br />
Total 255 9 146 4 62 2363 6 1<br />
Area<br />
Source: Statistical Department<br />
The above table shows that there are 255 villages, 146 village panchayaths, 9 hobalis,<br />
2 municipalities, 1 town panchayath and 1 city municipalities in the district.<br />
DISTRICT DEMOGRAPHY:<br />
Density of<br />
Population<br />
Table 1.11 The Taluk wise area and Density of the District is as<br />
below:<br />
Kundapura Udupi Karkala Total<br />
1559.72 sq.<br />
K.M.<br />
929.24 sq.<br />
kms<br />
1072.37 sq. kms<br />
242 570 192 287<br />
3880.00 sq.<br />
kms<br />
Udupi district has only three taluks viz,- Kundapura, Udupi and Karkala and total area<br />
of the district is 3575 sq. kms. The density of population is high in coastal area. The<br />
district has some forest areas, hilly and western ghat areas in the eastern part of<br />
Karkala and Kundapura taluks. The district has a long coastal belt in the western part<br />
i.e. of about 120 Kms of length. So fishing is the main occupation of the people of the<br />
coastal area. In the eastern part of the district, agriculture is the main occupation.<br />
Sugar factory, tile factories, cashew factories are some of the small industries.<br />
Table 1.12 Taluk wise Population as per 2001 Census:<br />
Taluk Male Female Total<br />
No<br />
of<br />
M.P.<br />
Seat<br />
s
Kundapura 174463 202909 377372<br />
Udupi 250345 277206 527551<br />
Karkala 96733 107838 204571<br />
Total 521541 587953 1109494<br />
Source: 2001 Census<br />
1200000<br />
1000000<br />
800000<br />
600000<br />
400000<br />
200000<br />
POPULATION COMPARISON 1991-2001<br />
0<br />
486409<br />
521541<br />
AWP & B FOR 2007-08<br />
551690<br />
587953<br />
105<br />
1038099<br />
Male Female Total<br />
1109494<br />
1991<br />
2001<br />
Though Udupi taluk is the smallest, it is densely populated because of urban area<br />
and coastal area. In Kundapur and Karkala, because of hilly and forest areas in<br />
the eastern part the density of population is less. When we study the decadal<br />
population growth of the district between 1991 and 2001, it shows that there is a<br />
slow growth of population compared to other districts of the state.<br />
The sex ratio is 1,130 females per 1000 males as per 2001 census. As per<br />
1991 census, the population of Udupi district was 10,38,099. 71395 population<br />
increased in 10 years. The annual population growth rate is 0.68%. The<br />
population growth rate of the state is 2.19%. Udupi district stands first in the<br />
state with least population growth rate.<br />
Table 1.13 Comparison of District Population with the Population of State and<br />
Country:<br />
Taluk<br />
2001<br />
Male Female Total<br />
1991<br />
Male Female Total<br />
Udupi (in Lakh) 5.21 5.87 11.09 4.86 5.54 10.37<br />
Karnataka (in<br />
Lakh)<br />
268.99 259.52 528.51 229 220.70 449.70<br />
India (in Lakh) 5312.77 4957.38 10270.15 4375.98 4063.33 8439.31<br />
Source: 2001 Census and 1991 Census
Literacy Profile:<br />
Taluk<br />
AWP & B FOR 2007-08<br />
Table 1.14 Taluk wise Literacy Rate of the District- 1991<br />
Census<br />
Literates Literacy Rate<br />
Male Female Total Male Female Total<br />
Kundapura 106506 91124 197630 79.06% 56.83% 66.98%<br />
Udupi 176619 166755 343374 86.06% 72.06% 78.80%<br />
Karkala 62410 62481 124891 83.44% 70.24% 76.29%<br />
Total 345535 320360 665895 83.58% 66.64% 74.47%<br />
Source: 2001 Census<br />
Table 1.15 Taluk wise Literacy Rate of the District- 2001<br />
Census<br />
Taluk Literates Literacy Rate<br />
Male Female Total Male Female Total<br />
Kundapura 129943 124017 254960 84.50% 68.20% 75.70%<br />
Udupi 198869 195898 394767 91.20% 79.80% 85.10%<br />
Karkala 74613 74965 149578 87.10% 76.20% 81.30%<br />
Total 403425 395880 799305 88.20% 75.20% 81.27%<br />
100.00%<br />
80.00%<br />
60.00%<br />
40.00%<br />
20.00%<br />
0.00%<br />
83.58%<br />
88.20%<br />
Source: 2001 Census<br />
LITERACY RATE COMPARISON-1991-2001<br />
66.64%<br />
75.20%<br />
106<br />
74.47%<br />
81.27%<br />
Male Female Total<br />
1991<br />
2001<br />
Taluk wise literacy rate of 1991 and 2001 shows the increase of literacy in each<br />
taluk and in both genders. In Kundapur literacy rate increased from 66.98% to<br />
75.70%, In Udupi from 78.87% to 85.10%. and in Karkala from 76.29% to<br />
81.30%. Total increase of literacy rate in the district is from 74.47% to 81.20%.<br />
The school facilities available in the district and awareness among the public
about the importance of education are the main causes for high literacy rate. Still<br />
there is a significant difference of 12% in literacy rate between male and female<br />
population. So it is the responsibility of the community to take care of the girl<br />
education.<br />
As per Census report 2001 it is noticed that following villages have more than<br />
15% SC population<br />
AWP & B FOR 2007-08<br />
SC Population in a village<br />
Block Village name ST %<br />
Brahmavara KELARKALABETTU 15.72<br />
Byndoor HALLIHOLE 15.00<br />
Karkala PADUKUDOOR 18.26<br />
Karkala RENJALA 16.93<br />
Karkala MUDAR 16.13<br />
Karkala KADTHALA 15.83<br />
Kundapura HESKATHOOR 17.42<br />
Kundapura KALAVARA 17.23<br />
Kundapura HALNAD 16.19<br />
Kundapura KEDOOR 15.58<br />
Udupi AMBALPADY 18.45<br />
And it is noticed that following villages have more than 15% ST population<br />
ST Population in a village<br />
Block Village name<br />
ST %<br />
Brahmavara HERADI 32.20<br />
Brahmavara HOSOOR 25.57<br />
Brahmavara HALUVALLI 24.09<br />
Brahmavara CHERKADY 21.58<br />
Brahmavara KUKKEHALLI 16.81<br />
Brahmavara AROOR 15.86<br />
Brahmavara 38 KALTHUR 15.73<br />
Brahmavara BELLAMPALLI 15.07<br />
Byndoor YELJITH 24.87<br />
Byndoor KOLLUR 21.20<br />
Byndoor JADKAL 21.05<br />
Byndoor EDMOGE 18.33<br />
Byndoor KAMALASHILE 17.74<br />
Karkala KABBINALE 22.28<br />
Kundapura AMASEBAILU 24.30<br />
Kundapura KULANJE 21.42<br />
Udupi ARTHRADI 15.88<br />
107
Out of these 17 villages in Yeljith, Kollur, Jadkal, Edmoge, Kamalashile, Kabbinale<br />
and Arthradi the identified STs belong to the minor tribe, i.e., Koragas,<br />
Malekudiyas and Hasalas. Amasebailu is a Naxal probe area. Therefore a special<br />
focus has been given in these areas.<br />
Educational Profile<br />
Udupi is one of the educationally forward districts in the state. From<br />
Anganawadies to universities and from basic education to highly professional<br />
educational institutions are functioning in the district. These institutions made the<br />
district stand first in the academic field. A brief educational profile is given below.<br />
Name of the blocks<br />
Educational institutions<br />
AWP & B FOR 2007-08<br />
Table 1..16<br />
Kundapura Byndoor Brahmavara Udupi Karkala Total<br />
Primary school (govt) 62 94 38 14 66 274<br />
Higher Primary school<br />
(govt)<br />
70 91 59 46 84 350<br />
Primary school (aided) 2 1 7 6 3 19<br />
Higher primary school<br />
(aided)<br />
22 11 70 67 40 210<br />
Higher school 35 26 46 59 35 201<br />
P.U colleges 15 8 11 19 9 62<br />
T.TI 2 1 1 2 2 8<br />
B.ED colleges 0 0 0 1 0 1<br />
Polytechnic college 0 0 1 3 0 4<br />
Medical college 0 0 1 0 0 1<br />
Engineering college 1 0 1 0 1 3<br />
First grade college 4 1 6 7 4 22<br />
Total 213 233 241 224 244 1155<br />
Source:DDPI office& DEO<br />
ACESSS:<br />
Block<br />
Total No. of<br />
habitations<br />
Table 1.17Primary Access Ratio by Habitation<br />
No. of habitations<br />
which have primary<br />
schools within 1<br />
K.M.<br />
108<br />
Ratio<br />
No. of habitations<br />
which have U.P.S.<br />
within 3 K.M.<br />
Ratio<br />
Kundapur 376 370 98.40 369 98.13<br />
Byndoor 392 390 99.49 356 90.81<br />
Brahmavara 406 389 95.81 389 95.81<br />
Udupi 412 412 100.00 411 99.75<br />
Karkala 777 774 99.61 774 99.61<br />
Total 2363 2335 98.81 2299 97.27<br />
Source : 2006 children census
The above table reveals the ratio of total habitations and number of habitations<br />
that have primary schools within 1 km and number of habitations that have upper<br />
primary schools within 3 km. Udupi block has achieved 100% of primary access<br />
ratio. Byndoor and Karkala have achieved in 99.49% and 99.61% respectively<br />
and Brahamavara block has to achieve 4.19% to reach the 100% access ratio.<br />
Because of scattered habitations and some habitations are existing on the<br />
foothills of Western Ghat where opening of upper primary schools are not feasible<br />
as per present norms of SSA yet to reach the school accession . To achieve this<br />
goal in AWP&B-2007-08, 12 months Bridge course , 4 Months Seasonal Bridge<br />
Cource and Tent schools are proposed to provide the education in such<br />
habitations. Both physical and financial facilities will be provided to those centers<br />
and a better primary access ratio will be maintained.<br />
School Access Ratio by Child Population<br />
Block<br />
Total child<br />
population of<br />
all habitation<br />
6-10 11-14<br />
Table 1.18<br />
6-10 child<br />
population having<br />
Primary school<br />
within 1 K.M.<br />
Access<br />
Ratio<br />
%<br />
11-14 children<br />
population<br />
having U.P.S.<br />
within 3 K.M.<br />
Access<br />
Ratio %<br />
Kundapur 14307 9159 13270 100 9088 100<br />
Byndoor 16543 11490 15838 100 11106 100<br />
Brahmavara 18754 11974 17523 100 12155 100<br />
Udupi 18194 11333 16903 100 11597 100<br />
Karkala 16119 10202 14774 100 10227 100<br />
Total 83917 54158 78308 100 54173 100<br />
Source: 2006 children census<br />
This access ratio is prepared for the habitations more than 100 for primary school<br />
and 200 for Upper Primary School. But lot many number of habitations which<br />
have populations less than 60 are having no access with in the prescribed<br />
distance. Udupi district has five Educational Blocks. Viz., Kundapura, Byndoor,<br />
Brahmavara ,Udupi, and Karkala. At the block level there is a Block Education<br />
Officer (BEO) who looks after the educational administration.<br />
Table 1.19 showing Blockwise access to schools in the District as on 30-<br />
09-2006<br />
AWP & B FOR 2007-08<br />
109
Sl.<br />
No Block<br />
AWP & B FOR 2007-08<br />
LPS UPS ECCE<br />
Govt<br />
Social<br />
Welfare<br />
Local body<br />
Aided<br />
Unadided<br />
Others<br />
110<br />
Total<br />
Govt<br />
Social<br />
Welfare<br />
1 Kundapura 60 2 - 2 8 0 70 69 1 - 22 12 0 104 0 11 222<br />
2 Byndoor 92 1 - 1 6 1 101 90 0 - 11 9 1 111 0 10 144<br />
3 Brahmavara 38 0 - 7 7 0 52 58 1 - 70 13 0 142 0 18 255<br />
4 Udupi 14 0 - 6 4 0 26 45 1 - 67 21 0 135 0 31 252<br />
5 Karkala 65 1 - 3 11 0 80 83 0 - 40 9 1 132 0 10 214<br />
Total 269 4 - 19 37 1 329 345 3 - 210 64 2 624 0 80 1087<br />
Source:DDPI office& DEO<br />
The above table reveals the total number of school functioning in the district<br />
Kundapura ,Byndoor and Karkala blocks have more number of Govt schools<br />
whereas Udupi and Brahamvara blocks have more aided and unaided schools<br />
.Govt schools are more in rural areas than in urban areas . There is 614 Govt<br />
schools and 5 schools belongs to social welfare , 5 other schools like Ashrama. So<br />
in totally there is 624 schools will come under Govt schools .There is no single<br />
teacher school in district<br />
210<br />
UPPER PRIMARY SCHOOLS<br />
64<br />
19<br />
345<br />
LOWER PRIMARY SCHOOLS<br />
37<br />
269<br />
GOVT<br />
AIDED<br />
UNAIDED<br />
GOVT<br />
AIDED<br />
UNAIDED<br />
Local body<br />
Aided<br />
Unadided<br />
Others<br />
Govt. HPS - 51.6 %<br />
Aided HPS - 34.13%<br />
Un Aided HPS - 9.45%<br />
Govt. LPS - 82.0%<br />
Aided LPS - 10.97%<br />
Un Aided LPS - 5.63%<br />
Total<br />
Aid<br />
Unaid<br />
AWCs
Sl. No.<br />
Blockwise details of school teachers:<br />
Block<br />
Sanctioned posts<br />
AWP & B FOR 2007-08<br />
Table 1.20 Blockwise details of school teachers<br />
Teachers in position<br />
Male<br />
Female<br />
Total<br />
% of female<br />
Teachers<br />
111<br />
Vacant posts<br />
Private Aided<br />
school Teachers<br />
Male<br />
Female<br />
Total<br />
% of female<br />
Teachers<br />
Private Unaided<br />
school Teachers<br />
Male<br />
Female<br />
Total<br />
% of female<br />
Teachers<br />
1 Kundapura 656 256 506 762 66.4 154 83 68 151 45.03 22 110 132 83.33<br />
2 Byndoor 906 197 371 568 65.3 88 45 21 66 31.82 23 41 64 64.06<br />
3 Brahmavara 505 254 297 471 63.9 34 245 170 415 40.96 32 181 213 84.98<br />
4 Udupi 341 131 192 323 59.4 18 141 232 373 62.20 32 228 260 87.69<br />
5 Karkala 646 205 346 546 63.3 100 103 100 203 49.26 32 94 126 74.60<br />
Total 3054 1043 1617 2660 60.7 394 617 591 1208 48.92 795 654 795 82.26<br />
Source:DDPI office& DEO<br />
The above table reveals the teachers position in Govt., Aided and Unaided schools<br />
of the district. 60.7% teachers are female. The posts for SC and ST categories<br />
remains as backlog because of insufficient number of candidates as SC/ST<br />
population in this district is comparatively low. Process of redeployment of excess<br />
teachers is under process. 107 teachers are newly recruited.Out of 394 vacant<br />
post 137 post were shifted to the other district and 150 posts are vacant . There<br />
is no single teacher school in this district.<br />
Block<br />
No of<br />
Sanctioned<br />
Posts<br />
Table 1.21 Pupil-Teacher Ratio:-<br />
No of<br />
Enrolled<br />
pupils in<br />
class<br />
1-7 (Govt.<br />
Schools)<br />
Kundapura 656 14796<br />
Byndoor 906 20448<br />
Brahmavara 505 11267<br />
Udupi 341 7551<br />
Karkala 646 14764<br />
Total 3054 68826<br />
Working<br />
Teachers<br />
568 26:1<br />
762 27:1<br />
471 24:1<br />
323 23:1<br />
546 27:1<br />
2660 26:1<br />
P.T.R<br />
(working)<br />
P.T.R<br />
(sanctioned)<br />
23:1<br />
23:1<br />
22:1<br />
22:1<br />
23:1<br />
23:1
The above table shows the blockwise picture of pupil teacher ratio. When we<br />
consider sanctioned posts the P.T.R. is 23:1. If we consider teachers in position<br />
for P.T.R., the P.T.R. is 26:1. So, there is no demand for teachers’ recruitment in<br />
this district.<br />
The pupil teacher ratio seems to be quite low. The two main reasons for<br />
these abnormal projections are mentioned below. The first and foremost reason is<br />
the success in achieving small family norms. The annual birth rate is just 6.9<br />
which is almost 1 /3 of that of the state which is 17.86 and of the country is 17.84.<br />
The second reason is scattered population. We do not find habitations having<br />
large populations. 50% of the habitations are with population less than 200.<br />
Therefore enrolment in the schools is naturally low. There are 224 primary<br />
schools having enrolment less than 60 and 122 UPS with enrolment less than<br />
140. But it is mandatory to maintain 2 teachers in all primary schools and one<br />
teacher per class in UPS. So the PTR is naturally low.<br />
Teacher Classroom Ratio:<br />
There are 2449 class rooms in the district .Out of which 508 rooms are major<br />
repairable rooms .Constructions of this buildings are made out of mud.Hence all<br />
the major repairable classrooms are to be displanted .Therefore these major<br />
repairable class rooms are considered as building less .And during the year<br />
2007-08 budget provision is made for construction of 508 class rooms in places<br />
which have to be displanted.<br />
In addition to this most of the HPS do not have separate HM’s rooms . Since<br />
there are number of programs like Akshara Dasoha ,Radio Program ,Edusat<br />
Program are running the schools all together .That means class programs are<br />
running in one class room in very congestive.Hence a separate room to H.M is<br />
needed for the HM. So 130 HM’s rooms are proposed during the year 2007-08.<br />
BLOCKS SANCTIONED<br />
Table 1.22<br />
NO.CLASS ROOM TEACHER CLASSROOM<br />
POST<br />
RATIO<br />
Kundapura 656 467 1:0.71<br />
Byndoor 906 686 1:0.75<br />
Brahmavara 505 409 1:0.80<br />
Udupi 341 330 1:0.99<br />
Karkala 646 557 1:0.86<br />
Total 3054 2449 1:0.82<br />
Drinking water and toilet facilities:<br />
AWP & B FOR 2007-08<br />
112
Drinking water and toilets are of top priority. It is our duty to ensure pure and<br />
safe drinking water to all the children as well as toilets. Toilet and water facilities<br />
are provided in various other schemes like ARWSP, NGY, Swatchchgrama Jala<br />
Nirmala Yojana Total sanitation compaign and Swarnajala. We are confident we<br />
have provided toilet and drinking water facilities to all the schools both for boys<br />
and girls separately.<br />
Block<br />
AWP & B FOR 2007-08<br />
LPS<br />
Table 1.23<br />
UPS<br />
Having<br />
No. of<br />
drinking<br />
Schools<br />
water<br />
%<br />
No. of<br />
Schools<br />
113<br />
Having<br />
drinking<br />
water<br />
Kundapura 132 116 87.88 71 66 92.96<br />
Byndoor 185 133 71.89 89 74 83.15<br />
Udupi North 97 87 89.69 59 58 98.31<br />
Udupi South 60 57 95.00 46 44 95.65<br />
Karkala 150 139 92.67 83 80 96.39<br />
Total 624 532 85.26 353 322 92.53<br />
Source: EMIS as on 30-09-2006 and DPO<br />
Block<br />
Table1.24 showing availability of common toilet facilities:<br />
LPS UPS<br />
No. of<br />
Schools<br />
Having<br />
Toilet<br />
%<br />
No. of<br />
Schools<br />
Having<br />
Toilet<br />
Kundapura 132 106 80.30 71 61 85.92<br />
Byndoor 185 150 81.08 89 73 82.02<br />
Udupi North 97 81 83.51 59 50 84.75<br />
Udupi South 60 51 85.00 46 40 86.96<br />
Karkala 150 121 80.67 83 69 83.13<br />
Total 624 509 81.57 348 293 84.20<br />
Source: EMIS 2005-06 and DPO<br />
Block<br />
Table1.25 showing availability of girls toilet facilities:<br />
LPS UPS<br />
No. of<br />
Schools<br />
Having<br />
Toilet<br />
%<br />
No. of<br />
Schools<br />
Having<br />
Toilet<br />
%<br />
Kundapura 132 100 75.76 71 59 83.10<br />
Byndoor 185 99 53.51 89 67 75.28<br />
Udupi North 97 78 80.41 59 53 89.83<br />
Udupi South 60 53 88.33 46 45 97.83<br />
%<br />
%
Electricity:<br />
Karkala 150 111 74.00 83 67 80.72<br />
Total 624 441 70.67 348 291 83.62<br />
Source: EMIS as on 30-09-2006 and DPO<br />
Electricity is a must in school as more emphasis is given to educational<br />
technology. To watch Keli Kali and Edusat programmes electricity is a primary<br />
necessity. So this year it is being planned to provide electricity to 147 schools.<br />
Block<br />
AWP & B FOR 2007-08<br />
Table1.25 showing Schools having Electricity<br />
LPS UPS<br />
No. of<br />
Schools<br />
Having<br />
Electricity %<br />
114<br />
No. of<br />
Schools<br />
Having<br />
Electricity %<br />
Kundapura 132 109 82.58 71 70 98.59<br />
Byndoor 185 132 71.35 89 84 94.38<br />
Udupi North 97 87 89.69 59 59 100.00<br />
Udupi South 60 56 93.33 46 44 95.65<br />
Karkala 150 134 89.33 83 82 98.80<br />
Total 624 518 83.01 348 339 97.41<br />
Source: EMIS as on 30-09-2006 and DPO<br />
Block<br />
Table1.27 showing Schools not having Electricity<br />
LPS UPS<br />
No. of<br />
Schools<br />
Not<br />
Having %<br />
Electricity<br />
No. of<br />
Schools<br />
Not<br />
Having %<br />
Electricity<br />
Kundapura 132 23 17.42 71 1 1.41<br />
Byndoor 185 53 28.65 89 5 5.62<br />
Udupi North 97 10 10.31 59 0 0.00<br />
Udupi South 60 4 6.67 46 2 4.35<br />
Karkala 150 16 10.67 83 1 1.20<br />
Total 624 106 16.99 348 9 2.59<br />
Compound Wall facilities:<br />
Source: EMIS as on 30-09-2006 and DPO<br />
Compound Walls arealso necessary to save the public property and protect the<br />
children from accidents in road margins. It is advised in schools, which lie in the
forest areas or located in the cities. Hence this year 100mtrs per school<br />
compound wall construction provision has been proposed.<br />
LPS<br />
Table 1.28 showing schools having compound wall<br />
UPS<br />
Block<br />
No. of<br />
Schools<br />
Having<br />
Compound %<br />
No. of<br />
Schools<br />
Having<br />
Compound %<br />
Kundapura 132 22 16.67 71 17 23.94<br />
Byndoor 185 12 6.49 89 9 10.11<br />
Udupi North 97 16 16.49 59 13 22.03<br />
Udupi South 60 12 20.00 46 11 23.91<br />
Karkala 150 21 14.00 83 15 18.07<br />
Total 624 83 13.30 348 65 18.68<br />
AWP & B FOR 2007-08<br />
Table1.29 showing schools not having compound wall<br />
LPS UPS<br />
Block<br />
No. of<br />
Schools<br />
Having<br />
Compound %<br />
No. of<br />
Schools<br />
Having<br />
Compound %<br />
Kundapura 132 110 83.33 71 54 76.06<br />
Byndoor 185 173 93.51 89 80 89.89<br />
Udupi North 97 81 83.51 59 46 77.97<br />
Udupi South 60 48 80.00 46 35 76.09<br />
Karkala 150 129 86.00 83 68 81.93<br />
Total 624 541 86.70 348 283 81.32<br />
Table 1.30 - I to V<br />
Sl.No Block<br />
1 Kundapur<br />
2 Byndoor<br />
Gross Enrolment Ratio (G.E.R.) :-<br />
Child Population 6-<br />
10 as on Feb 2006<br />
115<br />
I-V (30-9-2006)<br />
Enrollment GER<br />
Boys Girls Tot Boys Girls Tot Boys Girls Tot<br />
All 7322 6985 14307 7697 7354 15051 105.1 105.2 105.2<br />
SC 561 519 1080 560 537 1097 99.8 103.4 101.5<br />
ST 314 313 627 347 318 665 110.5 101.5 106.0<br />
All 8516 8027 16543 8588 8135 16723 100.8 101.3 101.0<br />
SC 500 510 1040 523 514 1034 104.6 100.7 100.00<br />
ST 578 504 1082 585 520 1105 101.2 103.1 102.12<br />
All 9559 9195 18754 9718 9190 18908 101.1 100.0 100.82<br />
SC 699 802 1501 790 898 1688 113.0 111.9 112.45<br />
3 Udupi North ST 677 663 1340 678 671 1348 100.1 101.2 100.59<br />
All 9216 8978 18194 9304 9255 18856 100.9 103.0 103.63<br />
SC 628 623 1251 726 711 1437 115.6 114.1 114.86<br />
4 Udupi South ST 399 423 817 409 453 902 102.5 107.0 110.40<br />
All 8257 7862 16119 8667 8223 16890 104.9 104.5 104.78<br />
SC 912 872 1784 1089 994 2083 119.4 113.9 116.76<br />
5 Karkala ST 677 608 1285 689 669 1358 101.7 110.0 105.68
Total<br />
Table 1.31 - I to VIII<br />
Sl.<br />
No Block<br />
1 Kundapur<br />
2 Byndoor<br />
3<br />
4<br />
Udupi<br />
North<br />
Udupi<br />
South<br />
5 Karkala<br />
Total<br />
Table 1.32 - VI to VIII<br />
Sl.<br />
No Block<br />
1 Kundapur<br />
2 Byndoor<br />
3 Udupi North<br />
AWP & B FOR 2007-08<br />
All 42870 41047 83917 43974 42157 86428 102.5 102.7 102.9<br />
SC 3300 3313 6613 3688 3654 7339 111.7 110.2 110.9<br />
ST 3245 2511 5151 2708 2631 5378 119.8 107.8 104.4<br />
Source: Children Census 2006 and E.M.I.S. 2006<br />
Child Population<br />
6-13as on Feb 2006<br />
I-VIII (30-9-2006)<br />
Enrollment GER<br />
Boys Girls Tot Boys Girls Tot Boys Girls Tot<br />
All 11814 11552 23366 12519 11972 24491 105.96 103.63 104.8<br />
SC 892 854 1746 951 875 1826 106.61 102.45 104.58<br />
ST 526 483 1009 596 496 1092 113.30 102.69 108.22<br />
All 14476 13557 28033 14733 14349 29082 101.77 105.84 103.74<br />
SC 818 808 1626 865 861 1726 105.74 106.55 106.15<br />
ST 885 855 1729 892 856 1748 100.79 100.11 101.09<br />
All 15632 15096 30728 15886 15185 31071 101.62 100.58 101.11<br />
SC 1147 1226 2373 1259 1294 2553 109.7 105.5 107.58<br />
ST 1106 1092 2198 1142 1139 2281 103.2 104.3 103.77<br />
All 15015 14509 29524 15386 15060 30446 102.4 103.7 103.12<br />
SC 970 1015 1985 984 1020 2004 101.1 100.4 100.95<br />
ST 661 675 1336 684 681 1365 103.4 100.8 102.17<br />
All 13771 13053 26824 13888 13774 27664 100.8 105.5 103.13<br />
SC 1537 1417 2954 1573 1424 2997 102.3 100.4 101.45<br />
ST 1102 1028 2130 1108 1050 2158 100.5 102.1 101.31<br />
All 70708 67767 138475 64250 61120 125392 110.0 105.4 110.4<br />
SC 5364 5320 10684 5108 4868 11106 105.0 109.2 103.9<br />
ST 4287 4122 8409 4361 4222 8644 101.2 102.4 102.3<br />
Source: Children Census 2006and E.M.I.S. 2006<br />
Child Population<br />
11-13as on Feb VI-VIII (30-9-<br />
2006<br />
2006) Enrollment GER<br />
Boys Girls Tot Boys Girls Tot Boys Girls Tot<br />
All 4592 4567 9159 5645 5251 10896 122.9 114.9 118.9<br />
SC 333 335 668 393 341 734 118.0 101.7 104.1<br />
ST 212 170 382 220 178 398 103.7 104.7 104.1<br />
All 5960 5530 11490 6314 5681 11995 105.9 102.7 104.3<br />
SC 318 311 629 319 312 629 100.3 100.3 100<br />
ST 307 340 647 350 374 724 114.0 110.0 111.9<br />
All 6073 5901 11974 7157 6400 13557 117.8 108.4 113.2<br />
SC 448 424 872 500 450 950 111.6 106.1 108.9<br />
ST 429 429 858 430 430 860 100.2 100.2 100.2<br />
4 Udupi South All 5802 5531 11333 6601 6023 12624 113.7 113.4 111.3<br />
116
5 Karkala<br />
Total<br />
AWP & B FOR 2007-08<br />
SC 342 392 734 428 415 843 125.1 105.5 114.8<br />
ST 262 252 514 285 273 558 108.7 108.3 108.5<br />
All 5514 4688 10202 6290 5535 11825 114.0 118.0 115.9<br />
SC 625 545 1170 710 551 1261 108.3 101.1 107.7<br />
ST 425 420 845 440 423 863 103.5 100.7 102.1<br />
All 27941 26217 54158 32007 28890 60897 114.5 110.1 112.4<br />
SC 2066 2007 4073 2261 2022 4283 109.4 100.7 105.1<br />
ST 1635 1611 3246 1624 1528 3152 100.6 102.9 102.9<br />
Source: Children Census 2006 and E.M.I.S. 2006<br />
The above tables show block wise, gender wise and social groupwise gross<br />
enrollment ratio in class 1 to 5, 6-8 and 1-8. In all cases enrollment is higher<br />
than the school age population in all blocks. This is because of voluntary<br />
admission in the age group of 5 to 6 and overage students in higher classes. The<br />
overall G.E.R. in class 1 to 5 is 102.9, 6 to 8 is 110.4 and in 1 to 8 is 112.4.<br />
Table1.33 Net Enrolment Ratio (N.E.R):<br />
NET ENROLMENT RATIO (CLASS 1 to 5)<br />
Block<br />
Enrolment 1-5<br />
(age group 6-10)<br />
117<br />
School Age Population<br />
(6-10)<br />
Net Enrolment<br />
Ratio(NER) (%)<br />
Boys Girls Total Boys Girls Total Boys Girls Total<br />
Kundapura 7697 7354 15051 7619 7288 14307 98.9 99.1 99.0<br />
Byndoor 8588 8135 16723 8516 8027 16543 99.1 98.6 98.8<br />
Udupi north 9718 9190 18908 9559 9195 18754 98.3 99.9 99.1<br />
Udupi south 9216 8978 18194 9304 9255 18856 99.0 97.0 98.0<br />
Karkala 8667 8223 16890 8657 8162 16119 99.8 99.2 99.5<br />
Total 43884 41880 85766 42870 41047 83917 99.02 98.76 98.88<br />
Source: Children Census 2006 and E.M.I.S. 2006<br />
Table1.34<br />
NET ENROLMENT RATIO (CLASS1 to 8)<br />
Block<br />
Enrolment 1-8 (age<br />
group 6-13)<br />
School Age Population<br />
(6-13)<br />
Net Enrolment Ratio(NER)<br />
(%)<br />
Boys Girls Total Boys Girls Total Boys Girls Total<br />
Kundapura 12519 12772 24491 12814 12552 23366 97.6 98.2 97.9<br />
Byndoor 14733 14349 29082 14476 13557 28033 98.2 94.4 96.3<br />
Udupi north 15886 15185 31071 15632 15096 30728 98.4 99.4 98.9<br />
Udupi south 15386 15060 30446 15015 14509 29524 97.5 96.3 96.9<br />
Karkala 13888 13774 27664 13771 13653 26824 99.1 99.1 96.9<br />
Total 64250 61120 125392 70708 67767 138475 98.16 97.48 97.79<br />
Source: Children Census 2006 and E.M.I.S. 2006<br />
Table1.35
NET ENROLMENT RATIO (CLASS 6 to 8)<br />
Block<br />
Enrolment 6-8<br />
(age group 11-13)<br />
AWP & B FOR 2007-08<br />
School Age Population<br />
(11-13)<br />
118<br />
Net Enrolment Ratio(NER)<br />
(%)<br />
Boys Girls Total Boys Girls Total Boys Girls Total<br />
Kundapura 5645 5251 10896 4592 4567 9159 98.0 98.8 98.4<br />
Byndoor 6314 5681 11995 5960 5530 11490 95.0 97.3 96.15<br />
Udupi north 7157 6400 13557 6073 5901 11974 94.8 92.2 94.0<br />
Udupi south 6601 6023 12624 5802 5531 11333 97.8 92.0 94.9<br />
Karkala 6290 5535 11825 5514 4688 10202 97.6 99.6 98.6<br />
Total 32007 28890 60897 27941 26217 54158 96.64 95.9 96.4<br />
Source : Children Census 2006 and E.M.I.S. 2006<br />
The above three tables show blockwise and genderwise net enrolment ratio in<br />
class 1 to 5, 6 to 8 and 1 to 8. In all cases the school age population is higher<br />
than the actual enrolment of that age group in all blocks. The overall N.E.R. in<br />
class 1 to 5 is 98.88, 6 to 8 is 97.79 and in 1 to 8 is 96.4. The N.E.R. of all blocks<br />
is almost similar. In this district N.E.R. is high due to public awareness about the<br />
importance of education.<br />
QUALITY IMPROVEMENT:<br />
Baseline assessment:<br />
Baseline assessment was made in the district in order to assess the present<br />
status of education. This work was done by the faculties of College of Teachers<br />
Education, Mangalore under the direction of DSERT. Fifty primary schools of the<br />
district were selected through random selection.<br />
Examination was conducted to the students of first, third and sixth standard.<br />
School schedule, teacher schedule and student schedule of class 3 rd were<br />
prepared by the selected field workers. The complete process has been<br />
computerized and the further process is under progress at DSERT. The result of<br />
the baseline assessment reveals the present educational standard of class 1 st 3 rd<br />
and 6 th . It indicates the improvements to be taken. The classwise and<br />
subjectwise results of the district are given in the following tables.<br />
Primary Education Development Indicator:
For every 10,000 population of the age group 6 to 13, 972 teachers are<br />
in position in the district. The teacher pupil ratio is 1:23 for working and 1:26 for<br />
sanctioned posts.<br />
Appointments in Project Institutions:<br />
Teachers :<br />
23 new primary schools have been opened during the project period from 2001-<br />
2005 and 8 EGS have been converted into new primary schools in the year 2006<br />
.So 32 new primary school have provided with school building and 62 new<br />
teachers are recruited . These teachers salary is being paid by the SSA.<br />
CRC :<br />
There are 42 Cluster Resource Centres in the district. 42 Cluster Resource<br />
Persons are working. All the CRPs who have completed 3 years of service at CRCs<br />
will be replaced by the newly selected CRPs.In udupi block due to non availability<br />
of prescribed qualified teachers all 7 crc posts are filled on deputation .Dyring the<br />
year 2007-08 eductional blosks such as Byndoor and Bramhavara have been<br />
provided 14 CRC foe each block.So with this totally 70 CRCare working in the<br />
district.<br />
BRC :<br />
AWP & B FOR 2007-08<br />
Table1.36<br />
Block working<br />
2007-08<br />
Provision<br />
Kundapura 7 -<br />
Byndoor 7 14<br />
Brahmavara 7 14<br />
Udupi 7 -<br />
Karkala 14 -<br />
Total 42 28<br />
There are 3 Block Resource Centres and 15 BRPs and 3 BRCCs are in the district<br />
out of which two BRCC’s posts are vacant(udupi & karkalla). For time being the<br />
senior BRP is incharge of the concerned block.All the BRPs who have completed 3<br />
years of service at BRCs will be replaced by the newly selected BRPs.It is planned<br />
to provide two more BRC s for the educational blocks.<br />
Vacancy Position<br />
Taluk Highschool Highschool Total<br />
119
(Arts) (Science)<br />
Kundapura - - -<br />
Udupi - 1 1<br />
Karkala 1 1 2<br />
Total 1 2 3<br />
Out of school children:<br />
Children census held in Feb 2006 it revealed that there are 505 children are out<br />
of school. Out of these 44 are physically challenged and they cannot attened to<br />
school of their own and remaining 461 children.Out of 461 children 274 children<br />
are brought in to the mainstream through various programs like special<br />
enrollment drive. And out of 187 children 103 children by mistake double<br />
entered. In that 83 children 63 children are migrated to their own district. So only<br />
21 children are still remaining as out of school.<br />
The real problem arises from immigration of laborers from North-East Karnataka<br />
districts. They come for begging during Ganesha festivals and Mahanavarathri<br />
and will remain in this district for about 4 months. Some of them come in search<br />
of employment during the month of November and go back during March and<br />
April. These children have to be brought to the educational arena through tent<br />
schools, EGS or some other means. In our out of school strategy all efforts are<br />
being made to school these children. So it looks very abnormal to provide funds<br />
under out of school strategies where there are a little number of out of school<br />
children.<br />
Number of Schools with Pupil teacher ratio :<br />
In general pupil teacher ratio is very low in our district. But the distribution of<br />
teachers is not even in all schools. There are schools having PTR more than 40.<br />
This is mainly because of the reason that large number of LPS have less than40<br />
strength and HPS with less than 80 strength. Therefore we cannot rule out the<br />
need of the additional teachers by just looking into the PTR of the district.<br />
Block<br />
40 >50 >60 >80<br />
Kundapura' 128 4<br />
Byndoor 172 5 1 7<br />
Brahmavara 91 2 4<br />
Udupi 58 2<br />
AWP & B FOR 2007-08<br />
Pupil teacher ratio<br />
120<br />
Teacher<br />
less
Karkala 133 3 3 10<br />
Total 583 14 4 23<br />
AWP & B FOR 2007-08<br />
121
AWP & B FOR 2007-08<br />
CHAPTER 2: Methodology<br />
In this chapter, the methodology employed by the monitoring team for<br />
data collection from the field has been described under three sections namely<br />
sampling design, tools for data collection and strategies for field data collection.<br />
The same is given in the foregoing sections.<br />
2.1 Sampling Design: As per the requirement of the TOR of the MHRD (GOI)<br />
a 5% sample of schools has to be covered for field data capturing in each district<br />
so as to represent both formal and alternative and innovative types. In order to<br />
do this, the monitoring team has employed a multi-stage, representative and<br />
systematic random sampling design based on the criteria of number, distribution<br />
of blocks and category of schools.<br />
In the first stage, 5% sample of schools was worked out for each district<br />
from out of the total number of government formal primary schools (both<br />
Lower Primary Schools and Higher Primary Schools) in the district. This gave the<br />
total number of schools that need to be covered for field visits.<br />
In the second stage, the blocks were selected from the district based on<br />
their geographical location in the district. In every district the sample size for<br />
blocks has been restricted so as to cover a minimum of 50% as it was not<br />
possible to include all the blocks for purpose of field data collection due to<br />
constraints of time, resource and quality output. However care has been taken to<br />
include blocks which are located away from the district head quarter as well as<br />
those which are within the district head quarter.<br />
In the third stage, after selecting the block, the 5% sample schools<br />
selected for the district was distributed among the sample blocks selected for field<br />
visits. The distribution was done proportionately as per the number of schools<br />
present in each of the blocks. Further the distribution has been done for both<br />
categories of Lower and Higher primary schools in the block separately. Thus the<br />
final number of schools that needed to be selected from each block and each<br />
category of primary schools in the district was obtained by this exercise.<br />
In the fourth stage, the actual schools for visit were selected. This was<br />
done using the EMIS school list data obtained from the State Project Office,<br />
Karnataka. The schools were selected from out of the list using systematic<br />
122
Name<br />
of<br />
blocks<br />
selected<br />
sampling technique so as to ensure not only unbiased selection, but also true<br />
representativeness. Thus in the final list of schools selected, care was taken to<br />
see that it included minority schools as well as EGS upgraded types.<br />
Alternative Innovative Education: In line with the requirement of the TOR by<br />
the MHRD(GOI), it was necessary to include alternative innovative education<br />
strategies in the 5% sample coverage for field monitoring. However, the<br />
monitoring team has considered this as an additional sample component over and<br />
above the 5% sample of formal schools selected in each district. Thus an<br />
additional number of 5-8 schools under this category in every district covering all<br />
types such as Residential Bridge course(RBC), NRBC (Non-Residential Bridge<br />
Course), Tent school, Mobile School, Seasonal Migration Residential School,<br />
KGBV, NPEGEL, Home based etc,. has been covered. The number of schools<br />
covered under this type is presented in the table in each of the district reports.<br />
BRC/CRC: As per the TOR by the MHRD (GOI), a minimum of 5 CRCs and 5<br />
BRCs was also to be covered in each district for SSA field monitoring. Thus from<br />
each district, 5 CRCs and 5 BRCs have been selected to capture the field data. So<br />
far as selecting the BRCs, all the sample blocks have been covered. In case of<br />
number of sample blocks selected in the district is less than five, the BRCs in the<br />
other blocks (non-sampled) have been selected on the basis of purposive<br />
randomness so as to make it 5. However, if the district had less than 5 BRCs, all<br />
the available number of BRCs has been covered including the non-sampled<br />
blocks. Similarly for selecting the 5 CRCs, a purposive random sampling<br />
technique has been used and the selection has largely been done from the<br />
sample blocks owing to the presence of sufficient number of CRCs in each block.<br />
The number of BRCs/CRCs covered is presented in the table in each of the district<br />
reports. Thus the overall sample size selected for Udupi district is given in the<br />
following table.<br />
No. of Schools<br />
Selected<br />
LP<br />
S<br />
AWP & B FOR 2007-08<br />
Table 2.1: Sample Size Selected in Udupi District<br />
HPS Total<br />
Baiando<br />
or<br />
10 13 23<br />
Udupi 2 8 10<br />
Total<br />
Tent<br />
School<br />
RBC NPEG<br />
EL<br />
123<br />
Alternative Schools<br />
Home<br />
based<br />
schoo<br />
l<br />
Mobil<br />
e<br />
Schoo<br />
l<br />
EGS<br />
KGB<br />
V<br />
1 - - 3 - - -<br />
BRC CRC<br />
12 21 33 1 - - 3 - - - 5 5
2.2 Tools for Data Collection: As required by the TOR, for the purpose of<br />
monitoring field level data, it was necessary to collect data from different sources<br />
such as formal schools, alternative innovative education schools, CRCs, BRCs,<br />
District Project Office (DPO) and the State Project Office (SPO). This necessitated<br />
development of different kinds of tools for collecting comprehensive datasets,<br />
both in quantitative and qualitative kinds from the field. As has been mentioned<br />
earlier the field staff was oriented to collect the data using techniques such as<br />
questioning, interviewing and observing during their visits to schools. Besides,<br />
the data were also required to be gathered from several records, registers and<br />
documents maintained in the schools. Therefore, the school schedule, in<br />
particular has been designed in such a way that it lends itself for using variety of<br />
techniques while collecting data from different sources. Specific instructions have<br />
been inserted at appropriate places in the schedule to prompt the field<br />
investigator not only to collect the required data but also for using different<br />
techniques for the same.<br />
In all, five different data capture formats have been developed by the<br />
monitoring team, based on the tool given by the MHRD. The designing of these<br />
formats involved several meetings of the monitoring team members as these<br />
have been developed through participatory workshop modes. These<br />
meetings/workshops were held both at RIE, Mysore and Institute for Social and<br />
Economic Change, Bangalore. An unique feature of these formats is that they<br />
attempt to capture every single data unit specified by the TOR be it from the<br />
school, alternative school, CRC, BRC, DPO or the SPO. Further, the MS Excel<br />
design used for developing the tool renders itself for smooth data keying in and<br />
developing analysis format for data consolidation at the block, district and the<br />
state levels as required. While the individual items in the field level data capture<br />
formats from the formal schools and the alternative innovative education schools<br />
(herein referred to as school schedule) have been rendered into regional<br />
language (Kannada), all other schedules have been retained in English language.<br />
A copy of each of the same is enclosed with the report under annexure.<br />
Description of Tools: As mentioned earlier, five different data capture formats<br />
have been developed by the monitoring team. The same is described hereunder.<br />
School Schedule: The school schedule includes main items such as opening of<br />
new schools, civil works, free text books, school grant, teacher and teacher<br />
training, teaching-learning material, children with special needs, DISE, SDMC,<br />
AWP & B FOR 2007-08<br />
124
mid-day meals and other items such as enrolment, attendance, school health<br />
check up, evaluation scheme, school environment and facilities, co-curricular<br />
activities, learning attainments etc,. Under each one of these main items there<br />
were several sub-items, which attempted to capture specific details pertaining to<br />
the main item. In addition, the school schedule also included a master table<br />
format seeking enrolment and attendance each, class-wise, sex-wise and<br />
category-wise (general, SC, ST).<br />
The SPO Schedule : The SPO schedule includes items relating to opening of new<br />
schools, civil works, free text books, school grants, teacher and teacher training,<br />
teaching-learning materials, EGS,AIE, NRBC, RBC, children with special needs,<br />
NPEGEL, KGBV, DISE, SDMC, staffing pattern and position. Under each one of<br />
these main items there were several sub-items, which attempted to capture<br />
specific details pertaining to the main item.<br />
The DPO Schedule: The DPO schedule includes items relating to opening of<br />
new schools, civil works, free text books, school grants, teacher and teacher<br />
training, teaching-learning materials, EGS, AIE, NRBC, RBC, children with special<br />
needs, NPEGEL, KGBV, DISE, SDMC, Research and Evaluation, staffing and<br />
BRCs,CRCs. Under each one of these main items there were several sub-items,<br />
which attempted to capture specific details pertaining to the main item.<br />
BRC/CRC Schedule: The BRC/CRC schedule includes main items relating to<br />
staffing pattern and position, teacher and teacher training and children with<br />
special needs. Under each one of these main items there were several sub-items,<br />
which attempted to capture specific details pertaining to the main item.<br />
Alternative Innovative Education: Under this category, separate tools have<br />
been developed for each one so as to capture the required data from the field<br />
visits along the lines of the TOR. Each one of them is described herein.<br />
NPEGEL: This schedule includes items relating to model cluster school, gender<br />
sensitive TLM, vocational education, gender empowerment for teachers,<br />
community mobilisation for girls’ education, ECCE, activity documenting format,<br />
frequency of reporting etc,. Under each one of these main items there were<br />
several sub-items, which attempted to capture specific details pertaining to the<br />
main item.<br />
AWP & B FOR 2007-08<br />
125
KGBV: This schedule includes items relating to function, land identification, civil<br />
works, sanctioned and filled in positions, enrolment and provision of facilities<br />
including boarding and lodging arrangements and maintenance of the inmates<br />
etc,. The specific items to elicit further information relating to each one of the<br />
items are also included in the schedule.<br />
RBC/NRBC : This schedule includes items relating to enrolment, attendance,<br />
volunteers, training, mainstreamed children, infrastructure, learning attainment<br />
levels, text books, TLM etc,. the specific questions relating to each one of these<br />
items are also included in the schedule.<br />
Tent/Mobile : The same RBC/NRBC schedule has been used for collecting data<br />
relating to these types of schools with suitable modifications wherever required.<br />
EGS Upgraded: This schedule includes items relating to up gradation, building<br />
construction, civil works, teacher deployment etc,.<br />
Home Based: This schedule includes items relating to child’s profile, volunteer,<br />
education and training, mode of recruitment, monitoring support etc,.<br />
2.3 Strategies for Field Data Collection<br />
Logistic Support from the SPO/DPO: The data collection from the field<br />
involved the support and cooperation of the SSA offices right from the state level<br />
through the district level to the block and sub block levels. As such sufficient<br />
effort was made by the MI in terms of obtaining official procedural sanctions. The<br />
data collection from the field by the MI team was preceded by a meeting with the<br />
SPO followed by the DPO, wherein the offices were apprised with regard to the<br />
kinds and quality of data requirement from the offices/school and the kind of<br />
logistic support to be provided to the monitoring teams during the field visits.<br />
Accordingly, the field visits were planned with prior intimation to the SPO and the<br />
DPO and after ascertaining the availability of the field functionaries for<br />
interaction with the monitoring teams during the field visits as well as for<br />
enabling the monitoring team in smooth data collection from the schools, CRCs,<br />
BRCs, Alternative & Innovative Strategies and the DPO/DIET etc,.<br />
Planning: Data collection was a challenge, as it required covering 5% of the<br />
actual number of schools in a district. As the task involved collection of data at<br />
AWP & B FOR 2007-08<br />
126
three levels, i.e., at the state level (SPO), at District level (DPO) and at school<br />
level, the needed information was first segregated at three levels. The tools<br />
meant for data collection at state level and district levels were kept separately<br />
and the tools to be used at school level were printed in tune with the number<br />
required in every district.<br />
A separate meeting was held at Bangalore to train the field officers in<br />
understanding the requirements of data collection activity. Apart from this they<br />
were also taken to a school to actually show how different information will have<br />
to be sought and recorded. Thus, the field officers were adequately trained in the<br />
task of data collection work. This was necessary as they had the responsibility of<br />
training field level functionaries whom these field officers eventually appointed.<br />
Personnel Involved: Since the field work involved working in at least for 50<br />
working days, and covering 5% of the actual schools in every district, the<br />
monitoring institutes had no option but to appoint field functionaries. They<br />
included the following. For every district, the following was planned.<br />
Monitoring Institute to Coordinate Data Collection Work<br />
One Field Officer<br />
AWP & B FOR 2007-08<br />
One Desk Officer<br />
Four to Eight Field Investigators Per District Depending on the Number<br />
and Spread of School Coverage<br />
Method: The method of data collection at state, district and sub district levels<br />
varied. At the state level, the SPO was requested to facilitate the work of<br />
providing data from the state office. Similarly, cooperation was sought to gather<br />
data from the district and sub-district offices through issue of official circulars and<br />
orders. Concerned data capture formats were sent to these offices to collect the<br />
required data. Wherever possible the soft copies of the formats were sent to<br />
offices and the data were procured in soft copy formats by the MI. Efforts were<br />
also made to obtain data from the DIETs as they were also involved in SSA<br />
activities for the district.<br />
127
Data Quality Assurance Measure: In order to ensure quality in the datasets<br />
that were intended to be collected, all necessary precautions were kept in mind.<br />
For instance, in the inner cover page, a provision has been made where, the<br />
headmaster of the school will sign the booklet along with his seal and the field<br />
investigator also signs, after the school data are recorded. Apart from this, the<br />
data collected were physically checked, discussed and only then were received by<br />
the field officer from the field investigators. Again the monitoring institute did a<br />
sample check of some booklets and compared it with the list of sampled schools<br />
to check for any deviation. After ensuring that there was no deviation from the<br />
originally drawn set of sampled schools, they were accepted as completed work<br />
and made available to keying in into the computer.<br />
Keying in: The verified booklets were accepted for computer keying in. All the<br />
school data were keyed in. They were compiled and district profiles were<br />
prepared after integrating the data collected from the school, from the district,<br />
from the state, apart from BRCs and CRCs.<br />
Consolidation and Tabulation: Once the district profiles were developed, the<br />
consolidation work got over and the collected data were tabulated. The tabulated<br />
facts and figures became the basis for generation of the present report.<br />
Facilitating Report Writing: The basic TOR of MHRD, GOI has been the basis<br />
for undertaking the work and logically, the report also must be able to respond to<br />
the issues raised in the TOR. The tabulation and integration of information drawn<br />
from the state level, district level and sub district levels enabled and facilitated<br />
report writing work.<br />
AWP & B FOR 2007-08<br />
XXXXXXXX<br />
128
CHAPTER 3: REVIEW OF AWP&B AND ANALYSIS OF FIELD DATA<br />
1. OPENING OF SCHOOLS (BOTH PRIMARY &<br />
UPPER PRIMARY SCHOOLS)<br />
As revealed from the AWP&B, the district had 3 new primary schools under spill<br />
over in the year 2008-09. Under this component, six regular new teachers’ salary<br />
has an approved outlay of Rs.1.440 lakhs. There is no expenditure under this as<br />
the teachers are yet to be recruited.<br />
From the DPO data it is noticed that 3 schools have been opened during the year<br />
for which land has been identified and funds released to the SDMCs.<br />
2. CIVIL WORKS<br />
240 civil works reveals an outlay of Rs. 404.8 lakh. There is adequate progress<br />
with 73.0 per cent of the money already being spent.<br />
From the DPO data it is seen that there are 3 new schools and 95 additional<br />
classrooms in the current year. Out of these all except 3 additional classrooms<br />
reveal civil works progress at various stages.<br />
From the field data, it is seen that the 2 schools in the sample reveal<br />
construction work at various stages. One of them reveal foundation and another<br />
one reveals progress upto lintel level. In all these cases, the SDMC has received<br />
both technical training and guidelines for civil works. The technical committee is<br />
in place to supervise the quality of covil works and are also seen to visit the sites<br />
as per schedule, and the SDMCs have maintained separate accounts relating to<br />
all aspects of civil works. Overall the quality of civil works is found to be quite<br />
satisfactory.<br />
3. TEXT BOOKS<br />
41706 children are covered under this scheme with an outlay of Rs. Rs.35.99<br />
lakh. All the money has been spent revealing excellent progress.<br />
AWP & B FOR 2007-08<br />
129
3. TEXT BOOKS<br />
41706 children are covered under this scheme with an outlay of Rs. Rs.35.99<br />
lakh. All the money has been spent revealing excellent progress.<br />
From the DPO data, however, it is seen that 22,475 children in primary schools<br />
have received text books. The difference needs explanation.<br />
From the field data it is seen that 6 schools reveal non receipt of text books in<br />
more than one class and more than 10 students in these schools had not<br />
received text books. By and large the OOS children who were mainstreamed in<br />
these schools had joined school late and hence not received text books.<br />
4. SCHOOL GRANTS<br />
There is excellent progress with 100.0 per cent utilization.<br />
From the DPO data it is seen that a total of 1414 schools had received grant,<br />
which included 855 primary and 559 higher primary schools. The grant was<br />
released in the month of May itself along with guidelines.<br />
From the field data, it is seen that all 33 schools had received school grant, which<br />
was generally found to be used for repairs, furniture purchase, painting, drinking<br />
water, electricity bill payment, plumbing work etc,. In about 2 schools, the<br />
amount was used for Pratibha karanji, which calls for explanation.<br />
5. TEACHERS AND TEACHER TRAINING<br />
Teachers’ salary (recurring) under this had an outlay of Rs. 212.85 lakhs out of<br />
which Rs.170.48 lakh have been spent upto January. Thus utilization is to the<br />
tune of 80.09 per cent, which may be considered quite satisfactory.<br />
The district had a target of 5352 teachers to be trained under in-service training<br />
for an outlay of Rs.74.928 lakhs. The utilization is seen to the extent of 38.08<br />
per cent, which may be considered far less than adequate progress.<br />
From the DPO data it is seen that 4550 out of 5352 teachers were trained under<br />
in-service. Although, 6 new teachers were were proposed to be trained under 30<br />
days induction, the district had not been able to do the same.<br />
AWP & B FOR 2007-08<br />
130
From the field data it is seen that overall more than 97.0 per cent of the schools<br />
have teachers in position. None of the teachers were absent in any of the sample<br />
schools on the day of visit. Over 75.0 per cent of the teachers had undergone inservice<br />
training at the DIET and BRCs. More than 96% reported about giving<br />
feedback to the training programme and over 95.0 percent of teachers reported<br />
that the training was effective. The training covered all curricular subjects.<br />
However, teachers expressed the need for more training in English, Maths,<br />
Science, Hindi, Computers, Yoga, administration, gender etc.<br />
6. TEACHING LEARNING MATERIAL (TLM) GRANT<br />
The district had an outlay of Rs.26.76 lakhs for 5352 teachers in primary and<br />
upper primary schools. Out of this, 85.01 per cent has been utilized.<br />
The DPO data concurs with the above statistics with respect to TLM grant.<br />
From the field data, it is seen that excepting in one school, in all schools all<br />
eligible teachers had received TLM grant. In one school, the amount received<br />
was less than Rs.500/-. All teachers had utilized the grant as per guidelines and<br />
in 48.5 per cent of the schools, the TLM was displayed in the class, while in the<br />
remaining, it was kept separately in the classroom. In all the schools, it was<br />
found to be used by pupils. Similarly, more than 80.0 per cent of teachers had<br />
received training for TLM at the BRCs. A large majority of schools have reported<br />
about sharing of good practices.<br />
7. EGS & AIE<br />
The district reveals an outlay of Rs.32.78 lakh, out of which little over 78.0 per<br />
cent has been spent. This may be considered adequate progress. However, the<br />
tent school and the SED reveal no progress.<br />
From the DPO data it is seen that under OOS, the district has planned for 69<br />
children under HBE along with the previous year 268 children, one feeder school<br />
and transportation for 190 children.<br />
8. CHILDREN WITH SPECIAL NEEDS<br />
AWP & B FOR 2007-08<br />
131
1595 children were covered with an outlay of Rs. 19.14 lakh. The entire amount<br />
has been utilized so far revealing excellent progress.<br />
From the DPO data it is seen that the district had identified 6498 in the current<br />
year, all of whom were enrolled in schools. Out of these CWSN 911 have been<br />
provided with assistive devices. 14 resource teachers have been identified and 2<br />
NGOs are collaborating. 337 children out of these have been provided with HBE<br />
support.<br />
From the field data, it is noted that in 69.7 schools, CWSN children had attended<br />
medical camp. In these schools, 45 children had attended medical camp. Out of<br />
them 14 were identified to receive assistive devices. From out of these children<br />
10 had received aids and appliances. The aids received included hearing aid,<br />
spectacles, wheel chair and MR kit. Three schools reported about not receiving<br />
the aid due to ‘parents not interested’ and problems relating to further medical<br />
examination. Only one school reported about problem in using the wheel chair<br />
due to lack of proper road. Further, more than 72.0 % of the sample schools had<br />
a ramp built as per requirements. 7 schools out of the 33 sample schools<br />
revealed severely disabled children enrolled under home based support. There<br />
was satisfactory attendance among the CWSN in the sample schools.<br />
9. NATIONAL PROGRAMME FOR EDUCATION OF<br />
GIRLS AT ELEMENTARY LEVEL (NPEGEL<br />
There is no NPEGEL in the district.<br />
10. KASTURBA GANDHI BALIKA VIDYALAYA<br />
(KGBV)<br />
There is no KGBV in the district.<br />
11. DISTRICT INFORMATION SYSTEM FOR<br />
EDUCATION (DISE)<br />
The district reveals an outlay of Rs. 54.379 for MIS, out of which more than 61.0<br />
per cent has been spent so far. This may be considered just adequate progress.<br />
The LEP component under this which includes Nali-Kali provisions and MP3<br />
Players for Urdu schools has not been utilized at all.<br />
From the DPO data it is seen that all aspects relating to EMIS are in place.<br />
AWP & B FOR 2007-08<br />
132
From the field data it is seen that all sample schools except one had received data<br />
capture formats in time and all teachers had received training in this regard. All<br />
schools reported about 5% data verification by the BRCs/CRCs.<br />
12. RESEARCH AND EVALUATION<br />
The district records 51.0 per cent fund utilization under this, which may be<br />
considered as unsatisfactory. Even under innovative activity, there is inadequate<br />
progress with only 32.66 per cent fund utilization. This is a cause of concern.<br />
From the DPO data, it is noticed that all proposed researches have been<br />
sanctioned and all sanctioned during the previous year have been completed.<br />
13. FUNCTIONING OF VEC<br />
Excellent progress is seen with 100.0 per cent fund utilization.<br />
From the DPO data it is seen that the district has constituted 624 SDMCs as per<br />
required norms. All of them have been given guidelines. Overall 68.74 per cent<br />
of the members had received training.<br />
From the field data it is seen that all schools had SDMC in place as per norms.<br />
These schools also were in possession of the SDMC guidelines. There was regular<br />
monthly meeting of the SDMC. Only 9 schools revealed all members attending the<br />
meetings. In other schools, the attendance was around 70.0 per cent. More than<br />
55% schools reported about 100.0 percent attendance among women members<br />
in the SDMC meetings. Large majority of the schools (67.6%) had about 20-30%<br />
of the members who had undergone SDMC training. The SDMC in general<br />
contributed to upkeeping of school environment and overseeing teachers’ and<br />
students’ attendance. In one school the SDMC appointed an honorary teacher.<br />
14. STAFFING AT STATE AND DISTRICT LEVEL<br />
With regard to staffing, it is noticed that while the DPO has all staff in place, there<br />
are vacancies in BRCs and CRCs. While BRCs indicated 7 vacancies, the CRCs<br />
indicated as many as 18 vacancies. This is a sad reflection as it directly impacts<br />
monitoring of quality of education in schools.<br />
15. MID-DAY MEAL SCHEME<br />
AWP & B FOR 2007-08<br />
133
By and large all schools served variety of hot cooked food under mid-day meal.<br />
The schools also displayed daily menu list. The number of schools, which served<br />
same menu was negligible. In general all children took mid day meal with the<br />
exception of one or two who either went home to have lunch or brought packed<br />
lunch. As per records of the school, only less than 30.0 per cent of the schools<br />
revealed some minor differences in the number of children enrolled, attended<br />
and took MDM. There was almost concurrence in the numbers based on the head<br />
count and as revealed in the MDM registers. Even there was not much of a<br />
difference between the number of children who took MDM on the day of visit and<br />
on the previous day thereby suggesting consistency in the MDM beneficiary<br />
statistics. In fact it was noticed that in some of the schools, the excess food<br />
remained was again served in the evening during remedial teaching<br />
programmes. Sometimes, some of the children also packed and carried MDM,<br />
when it was in excess. Schools also reported about greens and vegetables being<br />
part of the MDM. However, greens were occasionally used and some common<br />
vegetables grown in the region like brinjal, cucumber and tomato were usually<br />
cooked in the sambar.<br />
All schools reported about receiving the food grains on time regularly. More than<br />
90 per cent of the schools reported about having sufficient buffer stock. Except<br />
two schools, all other schools received cooking cost well in advance. In times of<br />
delay either the HM or the SDMC met the cost. There was no discrimination of<br />
any kind with regard to caste and gender either during serving of the food or in<br />
seating arrangement. About 85 per cent of the schools were able to adhere to the<br />
menu. More than 95.0 per cent of the children expressed satisfaction with respect<br />
to quantity and quality of the food served under MDM. Pleasantly all schools<br />
provided micronutrients and deworming regularly. All schools cooked food in the<br />
school itself. More than 95 % of the schools has sufficient number of staff for<br />
cooking MDM. Most of them were drawn from SHGs. While all cooks received<br />
Rs.800/- p.m. the assistants received between Rs.400-500 p.m. the<br />
remuneration was received regularly. More than 90.0 per cent of the schools used<br />
gas for cooking MDM. All schools has potable water for drinking. The general<br />
environment of cooking and eating MDM was clean and safe. All children are<br />
found to take MDM in orderly manner and were also found to be encouraged for<br />
personal hygiene and water conservation. While in 40.0 per cent of the schools<br />
the SDMC/panchayats participated in the MDM programme many times, in 60 per<br />
cent of the remaining schools, they were found to participate only occasionally.<br />
16. ADDITIONAL ITEMS CHECKED DURING SCHOOL<br />
VISITS BY MI<br />
From the sample schools from the field, it is noticed that the total working days<br />
ranged from 226 to 235. The average of the same was found to be 230. over<br />
70.0 per cent of the schools had good building, close to 25.0 per cent had<br />
partially good building and in only one school the building was not good. All<br />
schools had clean environment. More than 95.0 per cent of the schools have good<br />
classrooms with adequate light, ventilation and blackboard. However, while 63.3<br />
per cent of the schools had adequate play ground facility, another 18.2 per cent<br />
of the schools have small play ground and an equal per cent of the schools have<br />
no play ground at all. Over 81.0 per cent of the schools have TLM and another<br />
12.0 per cent of the schools have insufficient TLMs. Only 27.3 per cent of the<br />
AWP & B FOR 2007-08<br />
134
schools have insufficient play equipment. However large majority of the schools<br />
let children use them.<br />
Over 93.0 per cent of the schools had organized health camp. Only 3 schools out<br />
of the 33 have low attendance for which efforts are made to visit homes of such<br />
children and providing all incentives to them. There was continuous and<br />
comprehensive evaluation system in place and grading system was being adopted<br />
for pupils assessment. Only 3 schools reported about under and over aged<br />
children. 3 schools reported about children leaving the school in the past six<br />
months and 2 schools reported about these children joining other schools. Overall<br />
rapport between pupils and teachers was quite good.<br />
REMEDIAL TEACHING<br />
The district had planned remedial teaching for 5929 children with an outlay of Rs.<br />
29.645 lakhs. There is adequate progress with more than71.0 per cent utilization.<br />
During the visit, it was noticed that the schools had engaged children in remedial<br />
teaching after school hours on a regular basis.<br />
BRC<br />
The district reveals adequate progress with 75.45 per cent fund utilization<br />
CRC<br />
The district reveals adequate progress with more than 77.0 per cent fund<br />
utilization.<br />
SSA OVERALL TOTAL<br />
The district had an overall allocation of Rs. 1321.957 lakh allocation for the year<br />
2008-09. Out of this, Rs.963.034 lakh has been spent so far accounting for more<br />
than 72.0 per cent, which may be considered fairly satisfactory.<br />
AWP & B FOR 2007-08<br />
***********<br />
135
AWP & B FOR 2007-08<br />
136
UDUPI DISTRICT (L.P.S.)<br />
GLPS RAMANA KODLU -<br />
Department of<br />
1 UDUPI 291604 BYNDOOR BELLAL<br />
AJRI<br />
Education<br />
Department of<br />
2 UDUPI 291604 BYNDOOR GOLIHOLE GLPS GOLIHOLE URDU<br />
Education<br />
Department of<br />
3 UDUPI 291604 BYNDOOR GOLIHOLE GLPS HOSERI<br />
Education<br />
GLPS KADALI HOSOOR -<br />
Department of<br />
4 UDUPI 291604 BYNDOOR HOSOOR<br />
HOSOOR<br />
Education<br />
GLPS MEKKE, JADKAL -<br />
Department of<br />
5 UDUPI 291604 BYNDOOR JADKAL<br />
JADKAL<br />
Education<br />
Department of<br />
6 UDUPI 291604 BYNDOOR KERADI GLPS HALADI KERADI<br />
Education<br />
GLPS NAGUR KANNADA<br />
Department of<br />
7 UDUPI 291604 BYNDOOR KIRIMANJESHWARA 576250<br />
Education<br />
Department of<br />
8 UDUPI 291604 BYNDOOR NAVUNDA GLPS MASKI 576224<br />
Education<br />
GLPS KOTEBAGILUTALLURU<br />
Department of<br />
9 UDUPI 291604 BYNDOOR TALLUR<br />
576216<br />
Education<br />
GLPS HULKADIKE -<br />
Department of<br />
10 UDUPI 291604 BYNDOOR YELJITH<br />
YELAJETH<br />
Education<br />
Department of<br />
11 UDUPI 291602 UDUPI BADAGABETTU 80 GLPS RAJEEVANAGARA<br />
Education<br />
Department of<br />
12 UDUPI 291602 UDUPI KUDI GLPS KUDI - KUDI<br />
Education<br />
GLPS MANIPURA -<br />
Department of<br />
13 UDUPI 291602 UDUPI MANIPURA<br />
MANIPURA<br />
Education<br />
GLPS PADUBETTU<br />
Department of<br />
14 UDUPI 291602 UDUPI PERNANKILA PERNANKILA<br />
U B M C AIDED HPS<br />
Education<br />
15 UDUPI 291602 UDUPI SANTHOOR<br />
SANTHURU Pvt. Aided<br />
Department of<br />
16 UDUPI 291602 UDUPI UDUPI UA GLPS KARAMBALLI 576119<br />
Education<br />
AWP & B FOR 2007-08<br />
137
AWP & B FOR 2007-08<br />
UDUPI DISTRICT (H.P.S.)<br />
1 UDUPI 291604 BYNDOOR BELLAL<br />
GHPS BELLALA 576233 -<br />
BELLAL Department of Education<br />
2 UDUPI 291604 BYNDOOR GOLIHOLE GHPS ARESHIROOR 576214<br />
GHPS GUJJADY 576247 -<br />
Department of Education<br />
3 UDUPI 291604 BYNDOOR GUJJADI<br />
GUJJADI<br />
GHPS SULUGODU -<br />
Department of Education<br />
4 UDUPI 291604 BYNDOOR HALLIHOLE<br />
HALLIHOLE Department of Education<br />
5 UDUPI 291604 BYNDOOR HEROOR GHPS RAGIHAKLU 576224<br />
GHPS IDURUKUNJNADI<br />
Department of Education<br />
6 UDUPI 291604 BYNDOOR IDURKUNNADI 576233<br />
GHPS MOGERI 576219 -<br />
Department of Education<br />
7 UDUPI 291604 BYNDOOR KERGAL<br />
KERGAL<br />
GHPSKUNDABARANDADI<br />
Department of Education<br />
8 UDUPI 291604 BYNDOOR KUNDABARANDADI 576235 -<br />
GHPS NUJADY I 576233 -<br />
Department of Education<br />
9 UDUPI 291604 BYNDOOR NOOJADI<br />
NOOJAD<br />
GHPS KOTEBAGILU<br />
Department of Education<br />
10 UDUPI 291604 BYNDOOR PADUVARI<br />
PADUVARI Department of Education<br />
11 UDUPI 291604 BYNDOOR THAGGARSE GHPS THAGGARSE Department of Education<br />
12 UDUPI 291604 BYNDOOR YADTHARE GHPS MUDDODI 576214 Department of Education<br />
13 UDUPI 291604 BYNDOOR YELJITH GHPS YELAJITH Department of Education<br />
14 UDUPI 291602 UDUPI HEJAMADI GHPS HEJAMADI - KODI<br />
GHPS MALLARU GENERAL -<br />
Department of Education<br />
15 UDUPI 291602 UDUPI MALLAR<br />
MALLARU Department of Education<br />
16 UDUPI 291602 UDUPI PANGALA GHPS PANGALA - PANGALA<br />
GHPS SANTHURU KOPLA -<br />
Department of Education<br />
17 UDUPI 291602 UDUPI SANTHOOR<br />
SANTHOOR<br />
U B M C AIDED HPS<br />
Department of Education<br />
18 UDUPI 291602 UDUPI SANTHOOR<br />
SANTHURU Pvt. Aided<br />
19 UDUPI 291602 UDUPI UDUPI UA GMHPS VOLAKADU Department of Education<br />
20 UDUPI 291602 UDUPI YENAGUDDE GHPS ACHHADA - Department of Education<br />
138
AWP & B FOR 2007-08<br />
YENAGUDDE<br />
139
AWP & B FOR 2007-08<br />
140