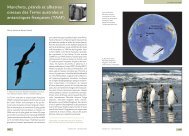
Isotopic signatures, foraging habitats and trophic ... - Cebc - CNRS
Isotopic signatures, foraging habitats and trophic ... - Cebc - CNRS
Isotopic signatures, foraging habitats and trophic ... - Cebc - CNRS

You also want an ePaper? Increase the reach of your titles
YUMPU automatically turns print PDFs into web optimized ePapers that Google loves.
160 Coral Reefs (2011) 30:155–165<br />
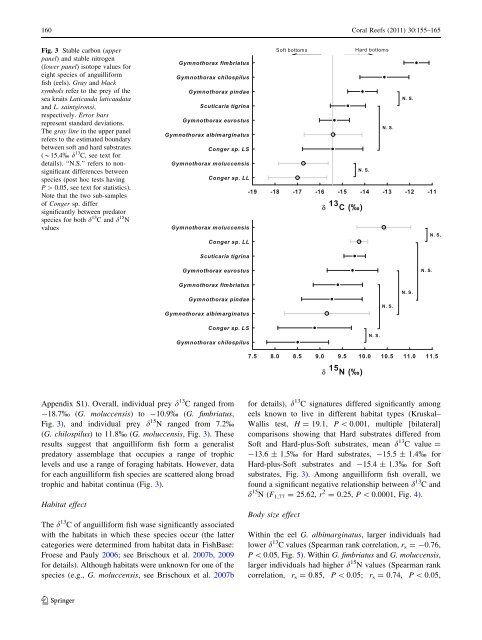
Fig. 3 Stable carbon (upper<br />
panel) <strong>and</strong> stable nitrogen<br />
(lower panel) isotope values for<br />
eight species of anguilliform<br />
fish (eels). Gray <strong>and</strong> black<br />
symbols refer to the prey of the<br />
sea kraits Laticauda laticaudata<br />
<strong>and</strong> L. saintgironsi,<br />
respectively. Error bars<br />
represent st<strong>and</strong>ard deviations.<br />
The gray line in the upper panel<br />
refers to the estimated boundary<br />
between soft <strong>and</strong> hard substrates<br />
(*15.4% d 13 C, see text for<br />
details). ‘‘N.S.’’ refers to nonsignificant<br />
differences between<br />
species (post hoc tests having<br />
P [ 0.05, see text for statistics).<br />
Note that the two sub-samples<br />
of Conger sp. differ<br />
significantly between predator<br />
species for both d 13 C <strong>and</strong> d 15 N<br />
values<br />
Appendix S1). Overall, individual prey d 13 C ranged from<br />
-18.7% (G. moluccensis) to -10.9% (G. fimbriatus,<br />
Fig. 3), <strong>and</strong> individual prey d 15 N ranged from 7.2%<br />
(G. chilospilus) to 11.8% (G. moluccensis, Fig. 3). These<br />
results suggest that anguilliform fish form a generalist<br />
predatory assemblage that occupies a range of <strong>trophic</strong><br />
levels <strong>and</strong> use a range of <strong>foraging</strong> <strong>habitats</strong>. However, data<br />
for each anguilliform fish species are scattered along broad<br />
<strong>trophic</strong> <strong>and</strong> habitat continua (Fig. 3).<br />
Habitat effect<br />
The d 13 C of anguilliform fish wase significantly associated<br />
with the <strong>habitats</strong> in which these species occur (the latter<br />
categories were determined from habitat data in FishBase:<br />
Froese <strong>and</strong> Pauly 2006; see Brischoux et al. 2007b, 2009<br />
for details). Although <strong>habitats</strong> were unknown for one of the<br />
species (e.g., G. moluccensis, see Brischoux et al. 2007b<br />
123<br />
for details), d 13 C <strong>signatures</strong> differed significantly among<br />
eels known to live in different habitat types (Kruskal–<br />
Wallis test, H = 19.1, P \ 0.001, multiple [bilateral]<br />
comparisons showing that Hard substrates differed from<br />
Soft <strong>and</strong> Hard-plus-Soft substrates, mean d 13 C value =<br />
-13.6 ± 1.5% for Hard substrates, -15.5 ± 1.4% for<br />
Hard-plus-Soft substrates <strong>and</strong> -15.4 ± 1.3% for Soft<br />
substrates, Fig. 3). Among anguilliform fish overall, we<br />
found a significant negative relationship between d 13 C <strong>and</strong><br />
d 15 N(F1,77 = 25.62, r 2 = 0.25, P \ 0.0001, Fig. 4).<br />
Body size effect<br />
Within the eel G. albimarginatus, larger individuals had<br />
lower d 13 C values (Spearman rank correlation, rs =-0.76,<br />
P \ 0.05, Fig. 5). Within G. fimbriatus <strong>and</strong> G. moluccensis,<br />
larger individuals had higher d 15 N values (Spearman rank<br />
correlation, rs = 0.85, P \ 0.05; rs = 0.74, P \ 0.05,