INTERPRETATION OF AXIAL PILE LOAD TEST RESULTS FOR ...
INTERPRETATION OF AXIAL PILE LOAD TEST RESULTS FOR ...
INTERPRETATION OF AXIAL PILE LOAD TEST RESULTS FOR ...

Create successful ePaper yourself
Turn your PDF publications into a flip-book with our unique Google optimized e-Paper software.
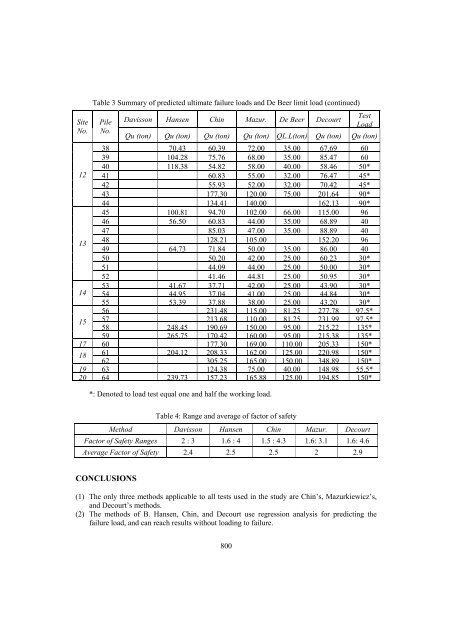
Site<br />
No.<br />
Table 3 Summary of predicted ultimate failure loads and De Beer limit load (continued)<br />
Pile<br />
No.<br />
Davisson Hansen Chin Mazur. De Beer Decourt<br />
800<br />
Test<br />
Load<br />
Qu (ton) Qu (ton) Qu (ton) Qu (ton) QL.L(ton) Qu (ton) Qu (ton)<br />
38 70.43 60.39 72.00 35.00 67.69 60<br />
39 104.28 75.76 68.00 35.00 85.47 60<br />
40 118.38 54.82 58.00 40.00 58.46 50*<br />
12 41 60.83 55.00 32.00 76.47 45*<br />
42 55.93 52.00 32.00 70.42 45*<br />
43 177.30 120.00 75.00 201.64 90*<br />
44 134.41 140.00 162.13 90*<br />
45 100.81 94.70 102.00 66.00 115.00 96<br />
46 56.50 60.83 44.00 35.00 68.89 40<br />
47 85.03 47.00 35.00 88.89 40<br />
13<br />
48<br />
49 64.73<br />
128.21<br />
71.84<br />
105.00<br />
50.00 35.00<br />
152.20<br />
86.00<br />
96<br />
40<br />
50 50.20 42.00 25.00 60.23 30*<br />
51 44.09 44.00 25.00 50.00 30*<br />
52 41.46 44.81 25.00 50.95 30*<br />
14<br />
53<br />
54<br />
41.67<br />
44.95<br />
37.71<br />
37.04<br />
42.00<br />
41.00<br />
25.00<br />
25.00<br />
43.90<br />
44.84<br />
30*<br />
30*<br />
55 53.39 37.88 38.00 25.00 43.20 30*<br />
56 231.48 115.00 81.25 277.78 97.5*<br />
15 57<br />
58 248.45<br />
213.68<br />
190.69<br />
110.00<br />
150.00<br />
81.25<br />
95.00<br />
231.99<br />
215.22<br />
97.5*<br />
135*<br />
59 265.75 170.42 160.00 95.00 215.38 135*<br />
17 60 177.30 169.00 110.00 205.33 150*<br />
18 61<br />
62<br />
204.12 208.33<br />
305.25<br />
162.00<br />
165.00<br />
125.00<br />
150.00<br />
220.98<br />
348.89<br />
150*<br />
150*<br />
19 63 124.38 75.00 40.00 148.98 55.5*<br />
20 64 239.73 157.23 165.88 125.00 194.85 150*<br />
*: Denoted to load test equal one and half the working load.<br />
Table 4: Range and average of factor of safety<br />
Method Davisson Hansen Chin Mazur. Decourt<br />
Factor of Safety Ranges 2 : 3 1.6 : 4 1.5 : 4.3 1.6: 3.1 1.6: 4.6<br />
Average Factor of Safety 2.4 2.5 2.5 2 2.9<br />
CONCLUSIONS<br />
(1) The only three methods applicable to all tests used in the study are Chin’s, Mazurkiewicz’s,<br />
and Decourt’s methods.<br />
(2) The methods of B. Hansen, Chin, and Decourt use regression analysis for predicting the<br />
failure load, and can reach results without loading to failure.