INTERPRETATION OF AXIAL PILE LOAD TEST RESULTS FOR ...
INTERPRETATION OF AXIAL PILE LOAD TEST RESULTS FOR ...
INTERPRETATION OF AXIAL PILE LOAD TEST RESULTS FOR ...

You also want an ePaper? Increase the reach of your titles
YUMPU automatically turns print PDFs into web optimized ePapers that Google loves.
Table 1 Load increment-Time<br />
<strong>LOAD</strong> INCREMENT, % <strong>OF</strong> DESIGN <strong>LOAD</strong> 25 50 75 100 125 150<br />
Times, hours 1 1 1 3 3 12<br />
<strong>PILE</strong> <strong>LOAD</strong> <strong>TEST</strong>S DATA<br />
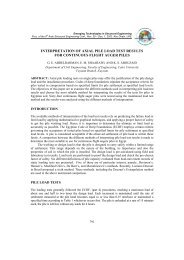
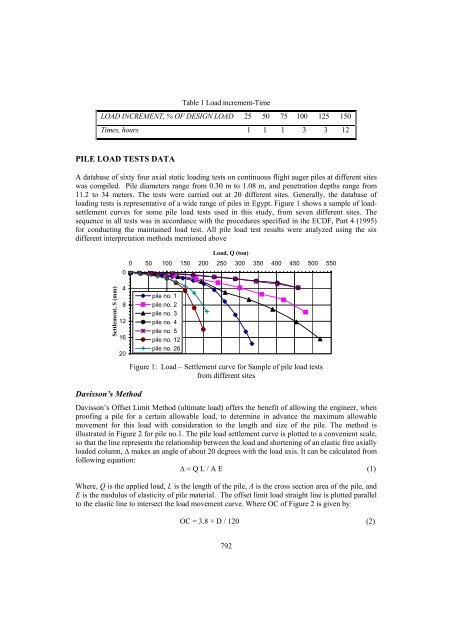
A database of sixty four axial static loading tests on continuous flight auger piles at different sites<br />
was compiled. Pile diameters range from 0.30 m to 1.08 m, and penetration depths range from<br />
11.2 to 34 meters. The tests were carried out at 20 different sites. Generally, the database of<br />
loading tests is representative of a wide range of piles in Egypt. Figure 1 shows a sample of loadsettlement<br />
curves for some pile load tests used in this study, from seven different sites. The<br />
sequence in all tests was in accordance with the procedures specified in the ECDF, Part 4 (1995)<br />
for conducting the maintained load test. All pile load test results were analyzed using the six<br />
different interpretation methods mentioned above<br />
Settlement, S (mm)<br />
Load, Q (ton)<br />
0 50 100 150 200 250 300 350 400 450 500 550<br />
0<br />
4<br />
8<br />
12<br />
16<br />
20<br />
Davisson’s Method<br />
pile no. 1<br />
pile no. 2<br />
pile no. 3<br />
pile no. 4<br />
pile no. 5<br />
pile no. 12<br />
pile no. 26<br />
Figure 1: Load – Settlement curve for Sample of pile load tests<br />
from different sites<br />
Davisson’s Offset Limit Method (ultimate load) offers the benefit of allowing the engineer, when<br />
proofing a pile for a certain allowable load, to determine in advance the maximum allowable<br />
movement for this load with consideration to the length and size of the pile. The method is<br />
illustrated in Figure 2 for pile no.1. The pile load settlement curve is plotted to a convenient scale,<br />
so that the line represents the relationship between the load and shortening of an elastic free axially<br />
loaded column, ∆ makes an angle of about 20 degrees with the load axis. It can be calculated from<br />
following equation:<br />
∆ = Q L / A E (1)<br />
Where, Q is the applied load, L is the length of the pile, A is the cross section area of the pile, and<br />
E is the modulus of elasticity of pile material. The offset limit load straight line is plotted parallel<br />
to the elastic line to intersect the load movement curve. Where OC of Figure 2 is given by:<br />
OC = 3.8 + D / 120 (2)<br />
792