Spatio-spectral encoding of fringes in optical long ... - GSU Astronomy
Spatio-spectral encoding of fringes in optical long ... - GSU Astronomy
Spatio-spectral encoding of fringes in optical long ... - GSU Astronomy

You also want an ePaper? Increase the reach of your titles
YUMPU automatically turns print PDFs into web optimized ePapers that Google loves.
A&A 531, A110 (2011)DOI: 10.1051/0004-6361/201116976c○ ESO 2011<strong>Astronomy</strong>&Astrophysics<strong>Spatio</strong>-<strong>spectral</strong> <strong>encod<strong>in</strong>g</strong> <strong>of</strong> <strong>fr<strong>in</strong>ges</strong> <strong>in</strong> <strong>optical</strong> <strong>long</strong>-basel<strong>in</strong>e<strong>in</strong>terferometryExample <strong>of</strong> the 3T and 4T recomb<strong>in</strong><strong>in</strong>g mode <strong>of</strong> VEGA/CHARAD. Mourard 1 , Ph. Bério 1 ,K.Perraut 2 ,R.Ligi 1 ,A.Blazit 1 ,J.M.Clausse 1 ,N.Nardetto 1 ,A.Spang 1 , I. Tallon-Bosc 3 ,D. Bonneau 1 , O. Chesneau 1 ,O.Delaa 1 ,F.Millour 1 ,P.Stee 1 , J. B. Le Bouqu<strong>in</strong> 2 , T. ten Brummelaar 4 , C. Farr<strong>in</strong>gton 4 ,P. J. Goldf<strong>in</strong>ger 4 , and J. D. Monnier 51 Laboratoire Fizeau, OCA/UNS/CNRS UMR6525, Parc Valrose, 06108 Nice Cedex 2, Francee-mail: denis.mourard@oca.eu2 UJF-Grenoble 1/CNRS-INSU, Institut de Planétologie et d’Astrophysique de Grenoble (IPAG) UMR 5274, 38041 Grenoble, France3 UCBL/CNRS CRAL, 9 avenue Charles André, 69561 Sa<strong>in</strong>t Genis Laval Cedex, France4 CHARA Array, Mount Wilson Observatory, 91023 Mt Wilson CA, USA5 University <strong>of</strong> Michigan, Ann Arbor, Michigan 48109-1090 MI, USAReceived 29 March 2011 / Accepted 9 May 2011ABSTRACTContext. One <strong>of</strong> the ma<strong>in</strong> challenges <strong>of</strong> <strong>optical</strong> stellar <strong>in</strong>terferometers is to <strong>in</strong>crease the number <strong>of</strong> telescopes <strong>in</strong> the recomb<strong>in</strong><strong>in</strong>g unitto provide a larger number <strong>of</strong> measurements and an improved imag<strong>in</strong>g capability. At the same time there is a need to preserve thespectroscopic capabilities, which leads to complex recomb<strong>in</strong><strong>in</strong>g schemes that may <strong>in</strong>hibit development.Aims. We describe the possibilities <strong>of</strong> comb<strong>in</strong><strong>in</strong>g the spatial and <strong>spectral</strong> <strong>encod<strong>in</strong>g</strong> <strong>of</strong> <strong>fr<strong>in</strong>ges</strong> for the design <strong>of</strong> more compact beamcomb<strong>in</strong>ers and for m<strong>in</strong>imiz<strong>in</strong>g the number <strong>of</strong> pixels that must be read.Methods. We establish the formalism <strong>of</strong> the spatio-<strong>spectral</strong> fr<strong>in</strong>ge <strong>encod<strong>in</strong>g</strong>, discuss general applications, and describe an implementation<strong>in</strong> the 3T/4T observ<strong>in</strong>g mode <strong>of</strong> the VEGA (Visible spEctroGraph and polArimeter) <strong>in</strong>strument <strong>in</strong>stalled at the coherent focus<strong>of</strong> the CHARA Array located on Mt Wilson <strong>in</strong> California. We f<strong>in</strong>ally present the science cases made possible by this <strong>in</strong>strumentalimplementation <strong>in</strong> the case <strong>of</strong> VEGA/CHARA.Results. We demonstrate the <strong>in</strong>terest <strong>in</strong> implement<strong>in</strong>g an optimized spatio-<strong>spectral</strong> <strong>encod<strong>in</strong>g</strong> <strong>of</strong> <strong>fr<strong>in</strong>ges</strong> <strong>in</strong> a multi-telescope beamcomb<strong>in</strong>er. On-sky results, obta<strong>in</strong>ed with the 3T mode <strong>of</strong> the VEGA comb<strong>in</strong>er are presented. At visible wavelengths and with thehectometric basel<strong>in</strong>es <strong>of</strong> CHARA, sub-mas stellar diameters could be determ<strong>in</strong>ed with a precision <strong>of</strong> a few percent with a <strong>spectral</strong>resolution <strong>of</strong> 5000. Our first estimates <strong>of</strong> closure phase show that accuracies better than 1 degree can be achieved.Conclusions. The first on-sky results obta<strong>in</strong>ed with the 3T-4T VEGA <strong>in</strong>strument us<strong>in</strong>g spatio-<strong>spectral</strong> fr<strong>in</strong>ge <strong>encod<strong>in</strong>g</strong> show thevalidity <strong>of</strong> us<strong>in</strong>g this pr<strong>in</strong>ciple <strong>in</strong> the design <strong>of</strong> future complex beam comb<strong>in</strong>ers.Key words. <strong>in</strong>strumentation: <strong>in</strong>terferometers – <strong>in</strong>strumentation: spectrographs – methods: data analysis – stars: fundamentalparameters1. IntroductionS<strong>in</strong>ce the study <strong>of</strong> Labeyrie (1975), <strong>optical</strong> <strong>in</strong>terferometry hasbeen developed with spectroscopic capabilities to both relax thecoherenc<strong>in</strong>g limits <strong>of</strong> white-light observations and <strong>in</strong>crease theaccessible scientific <strong>in</strong>formation. Comb<strong>in</strong><strong>in</strong>g <strong>spectral</strong> capabilitieswith <strong>in</strong>terferometric measurements has led to important applications<strong>in</strong> stellar physics, such as the k<strong>in</strong>ematical analysis<strong>of</strong> circumstellar environments or the chromatic study <strong>of</strong> stellarsurfaces (Chiavassa et al. 2010). The need to comb<strong>in</strong>e morethan two telescopes is <strong>of</strong> the utmost importance to achieve ahigher spatial resolution analysis and permit accurate image reconstruction.A challenge is therefore to be able to comb<strong>in</strong>ethree, four, or more telescopes and preserve the spectroscopiccapacities as much as possible so as to achieve polychromaticimag<strong>in</strong>g <strong>of</strong> stellar surfaces and/or environments. Interferometricbeam-comb<strong>in</strong>ation can follow co-axial or multi-axial <strong>optical</strong> approaches.In the latter case and for more than two telescopes,it is mandatory to optimize the detector pixel number whilerespect<strong>in</strong>g both <strong>spectral</strong> and spatial sampl<strong>in</strong>g <strong>of</strong> fr<strong>in</strong>ge patterns.One way <strong>of</strong> satisfy<strong>in</strong>g this condition is to comb<strong>in</strong>e spatio-OPD(<strong>optical</strong> path difference) cod<strong>in</strong>g <strong>of</strong> <strong>spectral</strong>ly dispersed <strong>fr<strong>in</strong>ges</strong>as orig<strong>in</strong>ally suggested for a space <strong>in</strong>terferometer (Vakili &Koechl<strong>in</strong> 1989). These authors demonstrated by means <strong>of</strong> a numericalsimulation the possibility <strong>of</strong> retriev<strong>in</strong>g the different highfrequency <strong>in</strong>formation even <strong>in</strong> the case <strong>of</strong> a l<strong>in</strong>ear redundant configuration.In 2006, Le Bouqu<strong>in</strong> & Tatulli (2006) studied the possibilityand efficiency <strong>of</strong> reduc<strong>in</strong>g the number <strong>of</strong> pixels <strong>in</strong> thecase <strong>of</strong> multi-axial s<strong>in</strong>gle mode <strong>in</strong>terferometry through a partiallyredundant output pupil configuration.The Center for High Angular Resolution <strong>Astronomy</strong>(CHARA) <strong>of</strong> the Georgia State University operates an <strong>optical</strong><strong>in</strong>terferometric array located at the Mount Wilson Observatorythat consists <strong>of</strong> six one meter telescopes placed <strong>in</strong> pairs a<strong>long</strong>the arms <strong>of</strong> a Y-shaped array. It yields 15 basel<strong>in</strong>es rang<strong>in</strong>gfrom 34 to 331 m. Operat<strong>in</strong>g <strong>in</strong> the near-<strong>in</strong>frared with CLASSIC(ten Brummelaar et al. 2005), CLIMB (Sturmann et al. 2010),FLUOR (Coude du Foresto et al. 2003), and MIRC (Monnieret al. 2008), and <strong>in</strong> the visible with PAVO (Ireland et al. 2008)Article published by EDP Sciences A110, page 1 <strong>of</strong> 9
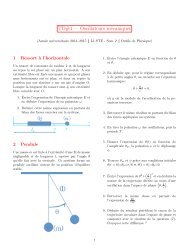
A&A 531, A110 (2011)and VEGA (Mourard et al. 2009), the CHARA array allows amaximum angular resolution <strong>of</strong> 1.3 and 0.3 ms <strong>of</strong> arc <strong>in</strong> the Kand V band, respectively. The VEGA spectrograph is designed tosample the visible band from 0.45 to 0.85 μm with <strong>spectral</strong> resolutions<strong>of</strong> 1700, 5000, and up to 30 000. It is equipped with twophoton count<strong>in</strong>g detectors that simultaneously study two different<strong>spectral</strong> bands at high and medium <strong>spectral</strong> resolution. Thepr<strong>in</strong>ciple and performance <strong>of</strong> VEGA, <strong>in</strong> its two telescope mode,has been presented <strong>in</strong> Paper I (Mourard et al. 2009). Fr<strong>in</strong>ges withthree and four telescopes were obta<strong>in</strong>ed <strong>in</strong> 2010.This paper aims to present a way <strong>of</strong> comb<strong>in</strong><strong>in</strong>g more thantwo telescopes <strong>in</strong> a dispersed fr<strong>in</strong>ge mode and discuss <strong>in</strong>itialon-sky results <strong>in</strong> 3T and 4T mode <strong>of</strong> VEGA as an example.Section 2 expla<strong>in</strong>s the pr<strong>in</strong>ciple <strong>of</strong> the spatio-<strong>spectral</strong> <strong>encod<strong>in</strong>g</strong><strong>of</strong> <strong>fr<strong>in</strong>ges</strong>. Section 3 is devoted to the application <strong>of</strong> this pr<strong>in</strong>cipleto VEGA 3T/4T mode and to possible future <strong>in</strong>struments. Wealso present the first measurements obta<strong>in</strong>ed with VEGA <strong>in</strong> 3Tmode and show the way <strong>in</strong> which we compute closure phase estimators<strong>in</strong> this multi-mode/multi-telescope/multi-lambda beamcomb<strong>in</strong>er. F<strong>in</strong>ally <strong>in</strong> Sect. 4 we present some <strong>of</strong> the new sciencecases made possible by the use <strong>of</strong> this new observ<strong>in</strong>g mode.2. Pr<strong>in</strong>ciple <strong>of</strong> optimized spatio-<strong>spectral</strong> <strong>encod<strong>in</strong>g</strong><strong>of</strong> <strong>fr<strong>in</strong>ges</strong>In the case <strong>of</strong> <strong>in</strong>terferometers based on dispersed fr<strong>in</strong>ge mode,the pupils are l<strong>in</strong>early recomb<strong>in</strong>ed <strong>in</strong> a direction perpendicularto the <strong>spectral</strong> dispersion. Non-redundant l<strong>in</strong>ear reconfigurationsare usually chosen (AMBER, Petrov et al. 2007;orMIRCMonnier et al. 2008) to easily separate the <strong>fr<strong>in</strong>ges</strong> com<strong>in</strong>g fromdifferent pairs <strong>of</strong> telescopes. In this section, we develop a generalformalism describ<strong>in</strong>g dispersed fr<strong>in</strong>ge <strong>in</strong>terferograms andwe expla<strong>in</strong> how redundant pupil reconfigurations could be usedwithout los<strong>in</strong>g any <strong>in</strong>formation.2.1. Formalism <strong>of</strong> the spatio-<strong>spectral</strong> <strong>encod<strong>in</strong>g</strong>Assum<strong>in</strong>g that the flux <strong>of</strong> each beam is identical, the <strong>in</strong>tensity <strong>of</strong>the <strong>in</strong>terferogram can be written as⎛I(x,y) = ni(x,y) ⎜⎝ 1 + 2 n∑γ i cos [ ] ⎞ 2πσχ i + φ <strong>in</strong>⎟⎠ , (1)i=1where (x,y) represents the pixels <strong>in</strong> the image plane, i(x,y)representsthe image <strong>of</strong> an <strong>in</strong>dividual pupil, n is the number <strong>of</strong> basel<strong>in</strong>es,σ is the wave number, χ i is the <strong>optical</strong> path difference(hereafter OPD) <strong>of</strong> basel<strong>in</strong>e i and γ i and φ i are, respectively,the modulus and phase <strong>of</strong> the complex fr<strong>in</strong>ge visibility for thebasel<strong>in</strong>e i, andχ i is a function <strong>of</strong> x and y that will be quantified<strong>in</strong>Eq.(4).Figure 1 shows a simulated <strong>in</strong>terferogram <strong>in</strong> thedispersed fr<strong>in</strong>ge mode.The direction <strong>of</strong> dispersion is parallel to the x axis such thatwe haveλ = ax, (2)where a is proportional to the dispersion coefficient <strong>of</strong> the dispersiveoptics.We assume that the <strong>spectral</strong> bandwidth (total width Δλ) issmall with respect to the wavelength λ. Denot<strong>in</strong>g λ 0 as the center<strong>of</strong> the <strong>spectral</strong> band (correspond<strong>in</strong>g to the pixel x 0 ), one canwrite for any wavelength <strong>of</strong> the <strong>spectral</strong> band λ = λ 0 + a(x − x 0 ).Thus we could writeσ = 1 λ ≈ 1 ()a(x − x0)1 − ≈ 2σ 0 − ax , (3)λ 0 λ 0 λ 2 0Fig. 1. Simulated <strong>in</strong>terferogram <strong>in</strong> the dispersed fr<strong>in</strong>ge mode.Observations with four telescopes.where λ 0 is the center <strong>of</strong> the <strong>spectral</strong> band.Assum<strong>in</strong>g a direction <strong>of</strong> dispersion perpendicular to theremapped pupil separation, the <strong>optical</strong> path difference χ i couldbe written as a function <strong>of</strong> y only. Therefore, we haveχ i = χ 0 i− b i y, (4)where χ 0 iis the OPD at the center <strong>of</strong> the image and b i depends onthe pupil separation for basel<strong>in</strong>e i and the distance to the imageplane. Substitut<strong>in</strong>g Eqs. (2)−(4) <strong>in</strong>to Eq. (1)givesI(x,y) ≈ ni(x,y)⎛× ⎜⎝ 1 + 2 n∑⎡γ i cos ⎢⎣2π ( χ 0 i − b i y ) ⎛ ⎜⎝2σ 0 − ax ⎞ ⎞⎟⎠ + φnλ 2 i⎤⎥⎦ ⎟⎠ ,i=10(5)which could also be written, us<strong>in</strong>g Eq. (3)fortheterm<strong>in</strong>y,asI(x,y) ≈ ni(x,y)⎛× ⎜⎝ 1+ 2 n∑⎛⎞⎞γ i cos ⎜⎝4πχ 0 <strong>in</strong>σ 0 + φ i −2π aχ0 iλ 2 x − 2πb i σy⎟⎠⎟⎠ .i=10(6)The Fourier transform FT(I)(u,v) <strong>of</strong> such a fr<strong>in</strong>ge pattern showspeaks at high frequencies. As shown <strong>in</strong> Mourard et al. (2009),we estimate the energy <strong>of</strong> these high frequency peaks <strong>in</strong> order toestimate the squared visibility. FT(I)(u,v) can be written asFT(I)(u,v) = nFT(i)(u,v) ⊗ P(u,v) (7)whereP(u,v) ≈ 1 + 1 n∑γ i e i[φ i+4πχ 0 i σ0] δ(u − aσ 2 0nχ0 i )δ(v + b iσ)+ 1 ni=1n∑γ i e −i[φ i+4πχ 0 i σ0] δ(u + aσ 2 0 χ0 i )δ(v − b iσ). (8)i=1If we take <strong>in</strong>to account the sampl<strong>in</strong>g <strong>of</strong> the image, the coord<strong>in</strong>ates<strong>of</strong> the high frequency peaks <strong>in</strong> pixels are(Up,i , V p,i)≈(aσ20χ 0 i Δx, −b iσΔy ) , (9)where (Δx, Δy) represents the total field <strong>in</strong> the source image. Thef<strong>in</strong>al expression <strong>of</strong> (U pi , V pi )is( )Upi , V pi ≈⎛⎜⎝ χ0 i Δλ , − b ⎞iΔy⎟⎠ · (10)λλ 2 0This expression is identical to the one given by Koechl<strong>in</strong> et al.(1996) for the case <strong>of</strong> two telescopes.A110, page 2 <strong>of</strong> 9
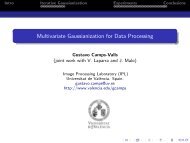
D. Mourard et al.: <strong>Spatio</strong>-<strong>spectral</strong> <strong>encod<strong>in</strong>g</strong> <strong>of</strong> <strong>fr<strong>in</strong>ges</strong> <strong>in</strong> <strong>optical</strong> <strong>long</strong>-basel<strong>in</strong>e <strong>in</strong>terferometryimportant condition for a correct implementation <strong>of</strong> the spatio<strong>spectral</strong><strong>encod<strong>in</strong>g</strong> as:N ch ≥∼ 2 ∗ N. (13)Fig. 2. Schematic representation <strong>of</strong> a simple 3T non-redundant (left)andredundant (right) l<strong>in</strong>ear configuration for a dispersed fr<strong>in</strong>ge <strong>in</strong>strument.For each case, we show the pupil plane at the entrance <strong>of</strong> the spectrographand the 2D Modulation Transfer Function (MTF). By add<strong>in</strong>g an<strong>optical</strong> path difference (δ) on one <strong>of</strong> the pupil <strong>in</strong> the redundant case, onecan separate the fr<strong>in</strong>ge signals <strong>in</strong> the MTF plane despite the redundancy.2.2. Constra<strong>in</strong>ts for V 2 measurementsIn the case <strong>of</strong> non-redundant reconfigurations, the separation betweentwo pupils is unique regardless <strong>of</strong> the number <strong>of</strong> telescopes(see Fig. 2)b i b j ∀i j. (11)The high frequency peaks <strong>of</strong> FT(I)(u,v) are formed at differentspatial frequencies <strong>in</strong> the v direction so that the <strong>fr<strong>in</strong>ges</strong> couldbe locked onto the zero OPD for each basel<strong>in</strong>e (U pi = 0). Inthe case <strong>of</strong> redundant pupil reconfigurations, the pupil separationbetween two pupils can be identical for several basel<strong>in</strong>es(see Fig. 2). Thus high frequency peaks <strong>of</strong> Ĩ(u,v) are formedat the same spatial frequencies <strong>in</strong> the v direction. However, itis possible to separate these peaks <strong>in</strong> the u direction by plac<strong>in</strong>gthe <strong>fr<strong>in</strong>ges</strong> at a different OPD for each basel<strong>in</strong>e. Of course,these OPDs must be small with respect to the coherence lengthto avoid any loss <strong>of</strong> contrast. The idea is to reduce the overall size<strong>of</strong> the optics for 3T operation from 7 ∗ D (non redundant case)to 5 ∗ D and the required number <strong>of</strong> pixels by the same amount.Figure 3 illustrates this redundant pupil reconfiguration pr<strong>in</strong>cipleby show<strong>in</strong>g <strong>spectral</strong> densities <strong>of</strong> VEGA dispersed <strong>fr<strong>in</strong>ges</strong> <strong>in</strong> thecase <strong>of</strong> observations with three and four telescopes. For example<strong>in</strong> the case <strong>of</strong> four telescopes, we can easily see a group <strong>of</strong> threehigh frequency peaks and a group <strong>of</strong> two high frequency peakswith the same coord<strong>in</strong>ates <strong>in</strong> the vertical direction (v direction)but separated <strong>in</strong> the horizontal direction (u direction). The sixthhigh frequency peak, alone at its vertical coord<strong>in</strong>ate, correspondsto the largest output basel<strong>in</strong>e.If we consider the quantity U p <strong>of</strong> Eq. (10), we can easilydeduce a general rule for correctly separat<strong>in</strong>g the different <strong>fr<strong>in</strong>ges</strong>ignals with the same V p spatial frequency. We def<strong>in</strong>e δλ as the<strong>spectral</strong> width <strong>of</strong> an elementary <strong>spectral</strong> channel. Thus, N ch = Δλδλis the number <strong>of</strong> <strong>spectral</strong> channels and l c = λ2δλis the coherencelength <strong>of</strong> the dispersed <strong>fr<strong>in</strong>ges</strong>. We can then writeχ 0 i = U pi∗ l c . (12)N chFor a l<strong>in</strong>ear redundant configuration <strong>of</strong> n telescopes, the firstV p frequency will be shared by (n − 1) basel<strong>in</strong>es and separat<strong>in</strong>gthem <strong>in</strong> the other direction (U p ) is only possible if the number<strong>of</strong> <strong>spectral</strong> channels is larger than the number N <strong>of</strong> telescopes orideally two times the number <strong>of</strong> telescopes to avoid any overlapp<strong>in</strong>gbetween the different fr<strong>in</strong>ge signals. We can then write this2.3. Restor<strong>in</strong>g the <strong>spectral</strong> resolutionAs a consequence <strong>of</strong> the previous formalism, one can see thatcomput<strong>in</strong>g the Modulation Transfer Function on a s<strong>in</strong>gle <strong>spectral</strong>channel will mix all fr<strong>in</strong>ge signals with the same V p frequency.However, the <strong>spectral</strong> resolution could be restored thanks tothe differential analysis <strong>of</strong> data. Comput<strong>in</strong>g the cross-spectrumbetween a small <strong>spectral</strong> channel and the whole <strong>spectral</strong> bandallows one to extract the complex differential visibility as isdone <strong>in</strong> the standard VEGA/CHARA data reduction pipel<strong>in</strong>e(Mourard et al. 2009).Referr<strong>in</strong>g to Eq. (7), we can write, us<strong>in</strong>g the gate functionΠ, the expression <strong>of</strong> the cross spectrum analysis between a large<strong>spectral</strong> channel (Δx) and a narrow one (δx)FT(I Δx ⊗ I δx ) = FT(I Δx ⊗ (I Δx × Π δx )), (14)where the symbol FT <strong>in</strong>dicates the Fourier transformation. Thisexpression can be written asFT(I Δx ⊗ I δx ) = FT(I Δx ) × [FT(I Δx ) ⊗ FT(Π δx )]. (15)It is clear that the convolution <strong>of</strong> FT(I Δx )bythetermFT(Π δx )and then the filter<strong>in</strong>g by the support <strong>of</strong> FT(I Δx ) will mix the<strong>in</strong>formation com<strong>in</strong>g from the different spatio-<strong>spectral</strong> frequenciesu <strong>of</strong> the same spatial frequency v. However, one can placeconstra<strong>in</strong>ts on the width <strong>of</strong> the small <strong>spectral</strong> band so that theeffect <strong>of</strong> FT(Π δx ) is negligible or it is possible to take this effect<strong>in</strong>to account when def<strong>in</strong><strong>in</strong>g the differential visibility estimators.We now consider the simple case <strong>of</strong> a three telescopel<strong>in</strong>ear redundant configuration as shown <strong>in</strong> Fig. 2. This configurationexhibits two spatial frequencies related to the basel<strong>in</strong>es band 2b. If we consider the spatial frequency correspond<strong>in</strong>g tothe basel<strong>in</strong>e b, we have two separate spatio-<strong>spectral</strong> frequenciescorrespond<strong>in</strong>g to the delays χ 0 1,2set for the two redundantbasel<strong>in</strong>es. From Eq. (15), we can calculate the value I 1 and I 2<strong>of</strong> the cross-spectrum at the frequencies [σ 2 0 χ0 1 Δλ, −bσ 0Δy] and[σ 2 0 χ0 2 Δλ, −bσ 0Δy] tobeI 1 = γ 1,Δλ γ 1,δλ e i[φ 1,Δλ−φ 1,δλ ] + γ 1,Δλ γ 2,δλ e i[φ 1,Δλ−φ 2,δλ ] s<strong>in</strong>c(α)I 2 = γ 2,Δλ γ 2,δλ e i[φ 2,Δλ−φ 2,δλ ] + γ 2,Δλ γ 1,δλ e i[φ 2,Δλ−φ 1,δλ ] s<strong>in</strong>c(α) (16)where( πα = πaσ 2 0 χ01− χ2) ( χ 0 0 1 − 2) χ0 ΔxΔxδx = δλ. (17)We note that Δx represents the number <strong>of</strong> pixels <strong>in</strong> the <strong>spectral</strong>direction <strong>of</strong> the large <strong>spectral</strong> band Δλ. These equations showthat at the frequency [σ 2 0 χ0 1 Δλ, −bσ 0Δy], the differential measurement<strong>of</strong> basel<strong>in</strong>e 1 (γ 1,Δλ γ 1,δλ e i[φ 1,Δλ−φ 1,δλ ] ) is corrupted by aterm com<strong>in</strong>g from basel<strong>in</strong>e 2 (γ 1,Δλ γ 2,δλ e i[φ 1,Δλ−φ 2,δλ ] ) but attenuatedby the s<strong>in</strong>c function. The symmetric situation occurs atthe second frequency [σ 2 0 χ0 2 Δλ, −bσ 0Δy]. If we wish to limitthe contam<strong>in</strong>ation between peaks at a level <strong>of</strong> 1%, α should begreater than 100. Therefore, we can def<strong>in</strong>e a constra<strong>in</strong>t on thenarrow <strong>spectral</strong> bandwidth given by100λ 2 0δλ ≥ δλ m<strong>in</strong> =π|χ 0 1 − (18)χ0 2|Δx·λ 2 0A110, page 3 <strong>of</strong> 9
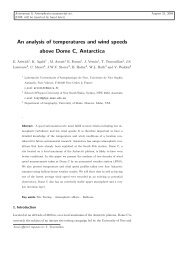
A&A 531, A110 (2011)Fig. 3. <strong>Spatio</strong>-<strong>spectral</strong> densities <strong>of</strong> VEGA dispersed <strong>fr<strong>in</strong>ges</strong> <strong>in</strong> 3T mode (left) with CLIMB used as IR group delay track<strong>in</strong>g and <strong>in</strong> 4T mode (right)with MIRC used as IR group delay track<strong>in</strong>g. Axes correspond to the (u, v) coord<strong>in</strong>ates def<strong>in</strong>ed <strong>in</strong> Eq. (6): u is the horizontal direction, v the verticalone. The three (respectively sic) high-frequency fr<strong>in</strong>ge signals are clearly separated <strong>in</strong> this 2D <strong>spectral</strong> density for the 3T (respectively 4T) mode.This constra<strong>in</strong>t can <strong>in</strong>duce a degradation <strong>of</strong> the actual <strong>spectral</strong>resolution dur<strong>in</strong>g the data process<strong>in</strong>g but this disadvantage canalso be removed by the complete solution <strong>of</strong> the system <strong>of</strong> equationsdescribed <strong>in</strong> Eq. (16). For example, if we compute δλ m<strong>in</strong><strong>in</strong> the case <strong>of</strong> the differential process<strong>in</strong>g presented <strong>in</strong> Sect. 3.5(where λ 0 = 735 nm, |χ 0 1 − χ0 2| = 450 μmandΔx = 1816 px), weobta<strong>in</strong> δλ m<strong>in</strong> = 0.02 nm. This value is well below the medium<strong>spectral</strong> resolution <strong>of</strong> VEGA.Table 1. Optimal characteristics <strong>of</strong> the spatio-<strong>spectral</strong> <strong>encod<strong>in</strong>g</strong> <strong>of</strong> theVEGA-3T/4T modes <strong>in</strong> medium <strong>spectral</strong> resolution.MODE N ch l c (mm) OPD <strong>of</strong>fsets (μm)3T 200 ±1.8 0 -100 +1504T 200 ±1.8 0 -100 +150 +250Notes. The last column <strong>in</strong>dicates the typical OPD <strong>of</strong>fsets for pupils 1-2-3 or 1-2-3-4. The actual implementation could be different, thanks to theresidual cophas<strong>in</strong>g errors between VEGA and the <strong>in</strong>frared <strong>in</strong>struments.2.4. Interest for future spectro-<strong>in</strong>terferometric <strong>in</strong>strumentsWe now consider the case for a possible future dispersed fr<strong>in</strong>genear-<strong>in</strong>frared <strong>in</strong>strument recomb<strong>in</strong><strong>in</strong>g N t = 6 or 8 telescopesand we compare its performance with or without the use <strong>of</strong> thespatio-<strong>spectral</strong> <strong>encod<strong>in</strong>g</strong>. The ma<strong>in</strong> issue is <strong>of</strong> course the smallernumber <strong>of</strong> pixels that have to be read, which leads to a reduction<strong>in</strong> both the readout noise and the total overhead. If we considerthe l<strong>in</strong>ear non-redundant configuration proposed <strong>in</strong> Le Bouqu<strong>in</strong>& Tatulli (2006) for 6 and 8 telescopes, we can calculate thatthe output pupil extends over 36 (respectively 76) times the <strong>in</strong>dividualdiameter for 6 (respectively 8) telescopes. The spatio<strong>spectral</strong><strong>encod<strong>in</strong>g</strong> allows us to reduce these numbers to 12 (respectively16) times the <strong>in</strong>dividual diameter. Thus, the ga<strong>in</strong> <strong>in</strong>the number <strong>of</strong> pixels is 3 (respectively 4.75) <strong>in</strong> 6T (respectively8T) mode.It is clear that follow<strong>in</strong>g recent progresses <strong>in</strong> develop<strong>in</strong>g verylow noise <strong>in</strong>frared detectors, this ga<strong>in</strong> will not be as high but onehas to keep <strong>in</strong> m<strong>in</strong>d that an accurate calculation should also take<strong>in</strong>to account the observ<strong>in</strong>g efficiency that <strong>in</strong>cludes the percentage<strong>of</strong> time on sky versus that on read<strong>in</strong>g the detector. Hence theimplementation <strong>of</strong> this optimized <strong>encod<strong>in</strong>g</strong> will certa<strong>in</strong>ly br<strong>in</strong>gimportant improvements <strong>in</strong> terms <strong>of</strong> limit<strong>in</strong>g magnitude <strong>of</strong> futuremulti-axial <strong>in</strong>struments or fr<strong>in</strong>ge tracker devices.3. On sky validation: VEGA-3T first measurementsand performance3.1. Context <strong>of</strong> VEGAThe VEGA spectrograph (Mourard et al. 2006, 2008) wasorig<strong>in</strong>allydeveloped, <strong>in</strong> terms <strong>of</strong> optics, to accept three beams l<strong>in</strong>earlyarranged <strong>in</strong> a non-redundant way, as presented <strong>in</strong> Fig. 2-left. To preserve the correct sampl<strong>in</strong>g <strong>in</strong> the detector plane, weconsidered add<strong>in</strong>g anamorphosis optics or chang<strong>in</strong>g the magnification,which caused a reduction <strong>in</strong> either the field <strong>of</strong> view orwidth <strong>of</strong> the <strong>spectral</strong> band. Thanks to improved algorithms developedfor photon count<strong>in</strong>g detectors (Blazit et al. 2008), wedemonstrated the possibility <strong>of</strong> simply improv<strong>in</strong>g the spatial resolution<strong>in</strong> the image plane by a factor <strong>of</strong> four through sub-pixellocalization <strong>of</strong> photo-events. By adopt<strong>in</strong>g the new pr<strong>in</strong>ciple <strong>of</strong>spatio-<strong>spectral</strong> <strong>encod<strong>in</strong>g</strong>, it was then possible to simultaneouslyrecomb<strong>in</strong>e not only three telescopes but even four <strong>in</strong> a high redundantmode. The <strong>in</strong>terest lies <strong>in</strong> the huge improvement <strong>in</strong> themeasurement’s output with three squared visibilities and one closurephase <strong>in</strong> 3T mode and six squared visibilities and three <strong>in</strong>dependentclosure phases <strong>in</strong> 4T mode (see Fig. 3).Table 1 presents the ma<strong>in</strong> characteristics <strong>of</strong> VEGA/CHARA3T-4T modes used <strong>in</strong> the medium resolution mode (R = 6000).A110, page 4 <strong>of</strong> 9
D. Mourard et al.: <strong>Spatio</strong>-<strong>spectral</strong> <strong>encod<strong>in</strong>g</strong> <strong>of</strong> <strong>fr<strong>in</strong>ges</strong> <strong>in</strong> <strong>optical</strong> <strong>long</strong>-basel<strong>in</strong>e <strong>in</strong>terferometry-50OPD E1E2 (μm)-75-100-125-1500 100 200 300 400350OPD E2W2 (μm)3253002752500 100 200 300 400250OPD E1W2 (μm)2252001751500 100 200 300 400Block NumberFig. 4. Observation <strong>of</strong> the calibrator star HD 55185 with VEGA withthree telescopes (E1E2W2) at medium <strong>spectral</strong> resolution (Δλ = 30 nmcentered at λ = 735 nm). The track<strong>in</strong>g <strong>of</strong> the <strong>fr<strong>in</strong>ges</strong> is done <strong>in</strong> the near<strong>in</strong>fraredwith the <strong>in</strong>strument CLIMB. Plots represent the OPD residualsmeasured on VEGA data for the three basel<strong>in</strong>es. The OPD estimates aredone each second (50 short exposures <strong>of</strong> 20 ms). Note that, accord<strong>in</strong>g tothe pr<strong>in</strong>ciple described <strong>in</strong> Sect. 2, the <strong>fr<strong>in</strong>ges</strong> are not stabilized aroundnull OPDs. For this specific experiment, we did not used the standardconfiguration as def<strong>in</strong>ed <strong>in</strong> Table 1.3.2. General remarks on the VEGA-3T and -4T observ<strong>in</strong>gmodes3T and 4T operation, especially with CHARA, immediatelyleads to <strong>long</strong> basel<strong>in</strong>es because <strong>of</strong> the telescope configuration.The more compact telescope triplet (S1S2W2) has already abasel<strong>in</strong>e <strong>of</strong> 170 m, which leads to low visibility measurements<strong>in</strong> the visible. The other triplets lead to very <strong>long</strong> basel<strong>in</strong>es <strong>of</strong> upto 200 m and even 330 m. Until mid-2010, we were only ableto stabilize the VEGA coherence through a real-time process<strong>in</strong>g<strong>of</strong> the science data allow<strong>in</strong>g us to correct the <strong>of</strong>fset <strong>of</strong> the delayl<strong>in</strong>es. This mode prevents us, however, from an efficient groupdelaytrack<strong>in</strong>g at the needed rate <strong>of</strong> 0.1 Hz for a visibility below0.3. In 2010, we succeeded <strong>in</strong> observ<strong>in</strong>g with VEGA, whilethe <strong>fr<strong>in</strong>ges</strong> were externally stabilized with the new CHARA <strong>in</strong>frared<strong>in</strong>strument called CLIMB (Sturmann et al. 2010) for 3Toperations, and with MIRC (Monnier et al. 2008) forthefirst4T VEGA light. With these external group delay trackers, wemeasured a typical residual jitter on the <strong>optical</strong> path difference<strong>of</strong> about 5 microns (see Fig. 4), which is well adapted to ourhigh and medium <strong>spectral</strong> resolution modes. For this operation,we <strong>in</strong>troduced differences <strong>in</strong> the <strong>in</strong>ternal <strong>of</strong>fsets between VEGAand CLIMB or MIRC so that <strong>fr<strong>in</strong>ges</strong> are stabilized <strong>in</strong> the <strong>in</strong>fraredaround a null <strong>optical</strong> path difference and around non-null <strong>of</strong>fsets<strong>in</strong> the visible to correctly apply the pr<strong>in</strong>ciple <strong>of</strong> spatio-<strong>spectral</strong><strong>encod<strong>in</strong>g</strong> as described <strong>in</strong> Sect. 2.Fig. 5. Fit <strong>of</strong> a uniform disc model to the squared visibilities measuredwith VEGA on HD 55185. VEGA measurements are plottedwith crosses and error bars and the model is plotted with circle. Themodel corresponds to a uniform disk angular diameter <strong>of</strong> φ HD 55185 =0.474 ± 0.014 mas.<strong>of</strong> HD 55185. We used HD 46487 as a calibrator. The observations<strong>in</strong> 2010 October 16 were performed us<strong>in</strong>g the telescopesE1E2W2 and the group-delay sensor CLIMB, and were<strong>of</strong> medium <strong>spectral</strong> resolution around 735 nm, and consisted <strong>of</strong>400 s <strong>of</strong> total observation time correspond<strong>in</strong>g to 20 000 short exposures<strong>of</strong> 20 ms. In the data reduction, we selected a <strong>spectral</strong>band <strong>of</strong> Δλ = 30 nm centered on λ = 735 nm. We assumedthat the uniform disk (UD) angular diameter <strong>of</strong> the calibrator isφ HD 46487 = 0.18±0.01 mas (estimated value given by SearchCaltool 1 <strong>of</strong> the JMMC, Bonneau et al. 2006a). We used the LitPro 2s<strong>of</strong>tware (Tallon-Bosc et al. 2008) to fit a uniform disc model tothe squared visibilities measured on the three basel<strong>in</strong>es and estimatedand angular diameter <strong>of</strong> HD 55185 (see Fig. 5). We foundφ HD 55185 = 0.474 ± 0.014 mas.We used surface brightness relations to obta<strong>in</strong> an <strong>in</strong>dependentestimate <strong>of</strong> the angular diameter (Kervella et al. 2004). Wefound 0.478 mas and 0.476 mas from (V − R) and(B − V), respectively.Our result is therefore <strong>in</strong> very good agreement withthese photometric estimations.Our determ<strong>in</strong>ation, after conversion <strong>in</strong>to a limb-darkened diameter,is comb<strong>in</strong>ed with the recent determ<strong>in</strong>ation <strong>of</strong> the parallax(8.49 ± 0.17 mas, van Leeuwen 2007) to obta<strong>in</strong> an estimation<strong>of</strong> the effective temperature <strong>of</strong> HD 55185. This leads to9488 ± 163 K, which is coherent for a A2V star. Our result illustratesthe capability <strong>of</strong> VEGA for measur<strong>in</strong>g sub-mas angulardiameters <strong>of</strong> star with a precision <strong>of</strong> a few percent (3% <strong>in</strong> thecase <strong>of</strong> HD 55185) and obta<strong>in</strong> a very reliable estimate <strong>of</strong> effectivetemperature.3.3. Squared visibility estimationMourard et al. (2009) described squared visibility estimations<strong>in</strong> the case <strong>of</strong> observations with two telescopes. In the case <strong>of</strong>three or four telescope observations, we used exactly the sameestimator. hence, we measured the energy <strong>of</strong> each high frequencypeak <strong>of</strong> the power spectrum calibrated by the energy <strong>of</strong> the lowfrequency peak. In the case <strong>of</strong> 3(4) telescopes, we estimated 3(6)squared visibilities.Here, we illustrate the quality <strong>of</strong> observations for three telescopesand the data reduction by deriv<strong>in</strong>g the angular diameter3.4. Closure phase estimationThe problem <strong>of</strong> obta<strong>in</strong><strong>in</strong>g the most reliable estimate <strong>of</strong> the closurephase has been exam<strong>in</strong>ed by a number <strong>of</strong> authors. Cornwell(1987) showed that the closure phase is equal to the phase <strong>of</strong> thebispectrum (or triple product) and Woan & Duffett-Smith (1988)showed that averag<strong>in</strong>g the bispectrum is the best way to estimatethe closure phase if the visibility phases cannot be recovered.1 Available at http://www.jmmc.fr/searchcal2 Available at http://www.jmmc.fr/litproA110, page 5 <strong>of</strong> 9
A&A 531, A110 (2011)Fig. 6. Bispectrum averaged over 250 short exposures <strong>of</strong> 20 ms (observation<strong>of</strong> the calibrator star HD 55185). Left: real part <strong>of</strong> the bispectrum,right: imag<strong>in</strong>ary part <strong>of</strong> the bispectrum.The bispectrum is a complex valued function def<strong>in</strong>ed as:D (3) (u 1 , u 2 ,v 1 ,v 2 ) = Ĩ(u 1 ,v 1 )Ĩ(u 2 ,v 2 )Ĩ ∗ (u 1 + u 2 ,v 1 + v 2 ), (19)where Ĩ(u) is the Fourier transform <strong>of</strong> the fr<strong>in</strong>ge pattern and Ĩ ∗denotes the complex conjugate <strong>of</strong> Ĩ. The argument <strong>of</strong> the bispectrumis the closure phase Δφarg [ D (3) (u 1 , u 2 ,v 1 ,v 2 ) ] =Δφ = θ 12 + θ 23 − θ 13 , (20)where θ ij is visibility phase <strong>of</strong> basel<strong>in</strong>e ij.The dimension <strong>of</strong> the bispectrum is always twice that <strong>of</strong> thepower spectrum. In the case <strong>of</strong> VEGA, the bispectrum will thenbe four dimensional as presented <strong>in</strong> Eq. (19). Because the smallnumber <strong>of</strong> telescopes (three or four) provides only a small number<strong>of</strong> closure triangles, it is only necessary to calculate the bispectrumon a small number <strong>of</strong> po<strong>in</strong>ts. In the case <strong>of</strong> three telescopes,the bispectrum is calculated around (U p1 , U p2 , V p1 , V p2 )as def<strong>in</strong>ed <strong>in</strong> Eq. (10).Figure 6 shows the real and imag<strong>in</strong>ary parts <strong>of</strong> the bispectrumaveraged over 250 short exposures <strong>of</strong> 20 ms around thefrequencies (U p1 , U p2 , V p1 , V p2 ). The averaged bispectrum hasbeen projected on the plane def<strong>in</strong>ed by the axis (u 1 ,v 1 )<strong>in</strong>orderto ease the visualization <strong>of</strong> this four-dimensional function.We show a signal <strong>in</strong> the real part <strong>of</strong> the averaged bispectrumwhereas no signal is present <strong>in</strong> the imag<strong>in</strong>ary part. This is <strong>of</strong>course expected s<strong>in</strong>ce the star is unresolved and therefore theclosure phase is zero.Figure 7 presents closure phase measurements for two calibratorstars (HD 46487 and HD 55185). The observations wereperformed us<strong>in</strong>g three telescopes (E1E2W2) at medium <strong>spectral</strong>resolution. Each estimate corresponds to 5 s <strong>of</strong> observation andto a <strong>spectral</strong> band <strong>of</strong> Δλ = 30 nm centered at λ = 735 nm. Themean and standard deviation <strong>of</strong> both series areΔφ HD 46487 = −0.091 ± 8.499 ◦ ,Δφ HD 55185 = 0.776 ± 5.625 ◦ . (21)No significant bias <strong>in</strong> the closure phase is detected from these estimates.The difference <strong>in</strong> the precision <strong>of</strong> the two sets is relatedto the photon noise, HD 55185 hav<strong>in</strong>g a magnitude m V = 4.14compared to m V = 5.08 for HD 46487. These first estimates <strong>of</strong>closure phase also show that precision better than 1 ◦ ≈ 20 mradcan be achieved with VEGA by averag<strong>in</strong>g phase closure estimatesover several m<strong>in</strong>utes (10 mn for HD 46487 for example).3.5. Differential measurementsSpectro-<strong>in</strong>terferometers such as VEGA permit us to determ<strong>in</strong>ethe differential visibility and phase. These <strong>in</strong>struments have beenClosure Phase (degree)Closure Phase (degree)50250-25HD46487-500 20 40 60 8050250-25HD55185-500 20 40 60 80Block NumberFig. 7. Estimate <strong>of</strong> the closure phase <strong>of</strong> calibrator stars HD 46487 andHD 55185 with VEGA with three telescopes (E1E2W2) at medium<strong>spectral</strong> resolution (Δλ = 30 nm centered at λ = 735 nm) and fr<strong>in</strong>getrack<strong>in</strong>g done with CLIMB. Each estimate corresponds to 5 s <strong>of</strong> observation(250 short exposures <strong>of</strong> 20 ms).<strong>in</strong>tensively used, for example, to study the morphology and k<strong>in</strong>ematic<strong>of</strong> circumstellar environments (Mourard et al. 1989; Berioet al. 1999; Meilland et al. 2007). A data reduction method wasdeveloped to derive these differential measurements for VEGA,which is described <strong>in</strong> detail <strong>in</strong> Mourard et al. (2009) fortwotelescope observations. In the case <strong>of</strong> three or four telescope observations,we use exactly the same method but for each highfrequency peak <strong>of</strong> the cross-spectrum.Here, we address the problem <strong>of</strong> the differential phases <strong>in</strong> thecase <strong>of</strong> three telescope observations. In Fig. 8, we present measurements<strong>of</strong> differential phase for the observations <strong>of</strong> HD 55185(see the description <strong>of</strong> observation <strong>in</strong> Sect. 3.3). We used a referencechannel <strong>of</strong> Δλ 1 = 30 nm centered at λ 1 = 735 nm and aslid<strong>in</strong>g narrow channel <strong>of</strong> Δλ 2 = 0.6 nm. We averaged the crossspectrum<strong>of</strong> 20 000 short exposures <strong>of</strong> 20 ms (correspond<strong>in</strong>g to400 s <strong>of</strong> observation) <strong>in</strong> order to estimate the differential phasewith a good signal to noise ratio (SNR). In theory, the differentialphase curves should be constant and equal to zero regardless<strong>of</strong> the basel<strong>in</strong>e (E1E2, E1W2, or E2W2), s<strong>in</strong>ce the star is verypartially resolved. However, we detect l<strong>in</strong>ear and/or quadratictrends for each basel<strong>in</strong>e. The differential phase is corrupted bythe OPD(χi (λ 1 )Δφ 12,i = θ λ1 ,i − θ λ2 ,i + 2π − χ )i(λ 2 ), (22)λ 1 λ 2where Δφ 12,i is the differential phase for the basel<strong>in</strong>e i, θ λ j ,i is thephase <strong>of</strong> the object at the wavelength λ j for the basel<strong>in</strong>e i, andχ i (λ j ) is the OPD <strong>of</strong> the basel<strong>in</strong>e i. This OPD depends on thewavelength through the chromatism <strong>of</strong> the refractive <strong>in</strong>dex <strong>of</strong> air(Colavita et al. 2004;andCiddor 1996)χ i (λ) = n(λ)L i = (1 + N(λ)) L i = χ i + δχ i (λ), (23)where n(λ) is the refractive <strong>in</strong>dex <strong>of</strong> air, N(λ) represents the chromaticpart <strong>of</strong> n(λ), and L i is the path difference <strong>in</strong> air for thebasel<strong>in</strong>e i. Although CHARA uses vacuum pipes for the beamtransportation, the delay l<strong>in</strong>es are <strong>in</strong> open air, thus the difference<strong>in</strong> the positions <strong>of</strong> delay l<strong>in</strong>es <strong>in</strong>troduced a difference <strong>in</strong> the path<strong>in</strong> air. In Eq. (23), χ i is the static part <strong>of</strong> the OPD as described<strong>in</strong> Sect. 2 and δχ i (λ) is the chromatic OPD. Hence, <strong>in</strong>sert<strong>in</strong>gA110, page 6 <strong>of</strong> 9
D. Mourard et al.: <strong>Spatio</strong>-<strong>spectral</strong> <strong>encod<strong>in</strong>g</strong> <strong>of</strong> <strong>fr<strong>in</strong>ges</strong> <strong>in</strong> <strong>optical</strong> <strong>long</strong>-basel<strong>in</strong>e <strong>in</strong>terferometry60Differential Phase (degree)Differential Closure Phase (degree)40200-20-40-60720 725 730 735 740 745 7506040200-20-40-60720 725 730 735 740 745 750Wavelength (nm)Fig. 8. Top: plots represent the differential phases <strong>in</strong> a narrow <strong>spectral</strong>band <strong>of</strong> 0.6 nm with respect to the wavelength (basel<strong>in</strong>e E1E2 <strong>in</strong> black,E2W2 <strong>in</strong> red, E1W2 <strong>in</strong> green). Bottom: plot represents the differentialclosure phase deduced from the three <strong>in</strong>dividual differential phases.Each estimate corresponds to 400 s <strong>of</strong> observation <strong>of</strong> calibrator starHD 55185 us<strong>in</strong>g VEGA with three telescopes (E1E2W2) at medium<strong>spectral</strong> resolution and fr<strong>in</strong>ge track<strong>in</strong>g done with CLIMB. Individualerror bars are not plotted for clarity. On basel<strong>in</strong>es E1E2 and E2W2, theerrors are at the level <strong>of</strong> 0.5 ◦ , whereas on the basel<strong>in</strong>e E1W2 they arecloser to 5 ◦ .Eqs. (23)<strong>in</strong>to(22)givesΔφ 12,i = θ λ1 ,i − θ λ2 ,i + 2πχ i( 1λ 1− 1 λ 2)+ φ disp,12 , (24)where the dispersive differential phase is( δχi (λ 1 )φ disp,12 = 2π − δχ )i(λ 2 )· (25)λ 1 λ 2Hence, if the <strong>in</strong>terferometer operates <strong>in</strong> vacuum and if the OPDis servo<strong>in</strong>g to zero, the third and fourth terms <strong>in</strong> Eq. (24) disappearand the differential phase depends only on the phase <strong>of</strong>the object. In the case <strong>of</strong> VEGA, the OPDs <strong>of</strong> each basel<strong>in</strong>eare servo<strong>in</strong>g to a non-zero value and the delay l<strong>in</strong>es operate <strong>in</strong>air. Therefore, the differential phases are corrupted by both thestatic OPD and the dispersive differential phase φ disp,12 ,whichexpla<strong>in</strong>s the l<strong>in</strong>ear and/or quadratic trends <strong>of</strong> the curves presented<strong>in</strong> Fig. 8.Extraction <strong>of</strong> the astrophysical signal requires the removal<strong>of</strong> these l<strong>in</strong>ear and/or quadratic trends. This is usually doneby fitt<strong>in</strong>g and subtract<strong>in</strong>g a low-order polynomial function ora model <strong>of</strong> the dispersive differential phase to the differentialphase (Matter et al. 2010). The ma<strong>in</strong> drawback <strong>of</strong> this methodis the loss <strong>of</strong> both the l<strong>in</strong>ear and/or quadratic terms <strong>in</strong> the astrophysicalsignal. For studies <strong>of</strong> circumstellar discs for example,it is not a major problem because the astrophysical signal ismore complex and conf<strong>in</strong>ed only to <strong>spectral</strong> l<strong>in</strong>es. So the neighbor<strong>in</strong>gcont<strong>in</strong>uum could be used to remove the l<strong>in</strong>ear and/orquadratic trends. However, other astrophysical studies, such asb<strong>in</strong>ary stars, require us to measure signatures <strong>in</strong> the differentialphase that are very close to l<strong>in</strong>ear or quadratic trends. In thatcase, the differential phase could not be used directly. We def<strong>in</strong>eda new <strong>in</strong>terferometric observable, which is the differentialclosure phaseΔφ (3)12 =Δφ 12,1 +Δφ 12,2 − Δφ 12,3 . (26)Fig. 9. Sky coverage <strong>of</strong> potential calibrator stars well adapted toVEGA/CHARA <strong>in</strong> 3T/4T mode with CLIMB as external IR group delaytrack<strong>in</strong>g. All these stars have a <strong>spectral</strong> type rang<strong>in</strong>g from O (cross),B (star), A (diamond), to F (triangle).It can easily be shown that this quantity does not depend on theOPD but is the difference <strong>in</strong> the classical closure phase <strong>of</strong> each<strong>spectral</strong> bandΔφ (3)12 =Δφ 1 − Δφ 2 , (27)where Δφ 1 and Δφ 2 are respectively the classical closure phase<strong>of</strong> the reference channel and <strong>of</strong> the narrow channel. Figure 8(bottom plot) illustrates that the l<strong>in</strong>ear and/or quadratic trendsdue to the OPD have disappeared <strong>in</strong> the differential closurephase. The mean <strong>of</strong> the differential closure phase <strong>in</strong> one narrowchannel is Δφ (3)12 = 0.2 ± 11 ◦ all over the <strong>spectral</strong> band <strong>of</strong> 30 nm.4. Discussion <strong>of</strong> possible VEGA/3T-4T sciencecases4.1. 3T-4T operation issuesEven if progress <strong>in</strong> fr<strong>in</strong>ge track<strong>in</strong>g allows fa<strong>in</strong>ter objects to beobserved and/or lower visibilities to be recorded, this requiresf<strong>in</strong>d<strong>in</strong>g calibrators that are bright enough for both the scientific<strong>in</strong>strument and the fr<strong>in</strong>ge tracker. Moreover, us<strong>in</strong>g very <strong>long</strong>basel<strong>in</strong>es makes the choice <strong>of</strong> calibrators much more difficults<strong>in</strong>ce lots <strong>of</strong> them are partially resolved. The calibrators mustalso be close to the scientific targets <strong>in</strong> terms <strong>of</strong> both distanceand <strong>spectral</strong> type to avoid any bias <strong>in</strong> the calibrated <strong>in</strong>terferometricobservables. As an example, we selected calibrators amongthe 9500 stars (decl<strong>in</strong>ation larger than −30 ◦ and magnitude Vbrighter than 7.0) <strong>in</strong> the VEGA <strong>in</strong>ternal catalog by apply<strong>in</strong>g filtersto parameters such as magnitude and diameter so as to fit theVEGA capabilities. Angular diameters were calculated us<strong>in</strong>g aspectrophotometric polynomial law based on the V magnitudeand the (V − K) color <strong>in</strong>dex (Bonneau et al. 2006b). Accord<strong>in</strong>gto the current limit<strong>in</strong>g magnitude, we considered only the starsbrighter than 6.5<strong>in</strong>theV band and brighter than 7 <strong>in</strong> the K band(for CLIMB that performs the group delay track<strong>in</strong>g). We identified1866 potential calibrators <strong>in</strong> all parts <strong>of</strong> the sky with anangular diameter smaller than 0.4 mas provid<strong>in</strong>g a high visibilitymeasurement even on the largest basel<strong>in</strong>es. All <strong>of</strong> them areOBAF stars (Fig. 9). Figure 10 shows the histogram <strong>of</strong> the number<strong>of</strong> calibrators found per regions <strong>of</strong> sky <strong>of</strong> 1h <strong>in</strong> right ascensionand 5 ◦ <strong>in</strong> decl<strong>in</strong>ation.A110, page 7 <strong>of</strong> 9
A&A 531, A110 (2011)significant improvement <strong>in</strong> the stellar atmosphere models (1Dand 3D) <strong>of</strong> all stars.Fig. 10. Number <strong>of</strong> sky regions <strong>of</strong> 1h <strong>in</strong> right ascension and 5 ◦ <strong>in</strong> decl<strong>in</strong>ationas a function <strong>of</strong> exist<strong>in</strong>g calibrators.4.2. Fundamental parametersThanks to direct angular diameter measurements by <strong>optical</strong> <strong>in</strong>terferometrycomb<strong>in</strong>ed with the bolometric flux, it is possibleto derive the fundamental stellar parameters, such as the effectivetemperature, the lum<strong>in</strong>osity, and the stellar radius. The determ<strong>in</strong>ation<strong>of</strong> the angular diameter is based on visibility measurementsthat are directly l<strong>in</strong>ked to the Fourier transform <strong>of</strong> theobject <strong>in</strong>tensity distribution. For a s<strong>in</strong>gle circular star, the visibilitycurve as a function <strong>of</strong> spatial frequency B/λ (where B isthe <strong>in</strong>terferometric basel<strong>in</strong>e and λ is the operat<strong>in</strong>g wavelength)is related to the first Bessel function, and conta<strong>in</strong>s a central lobe,that is almost only sensitive to the size <strong>of</strong> the object, and an everdecreas<strong>in</strong>g series <strong>of</strong> side lobes, separated by nulls, which one observeswith an <strong>in</strong>creas<strong>in</strong>g angular resolution. As a rule <strong>of</strong> thumb,the side lobes are sensitive to limb darken<strong>in</strong>g and atmosphericstructure but consist <strong>of</strong> very low visibilities. With VEGA, be<strong>in</strong>gable to measure very low visibilities will allow us to determ<strong>in</strong>ethe angular diameters <strong>of</strong> stars <strong>of</strong> sub-mas sizes to an accuracybetter than 2% (Mourard et al. 2010). We limit ourselves to starspresent<strong>in</strong>g an angular diameter smaller than 3.0 mas <strong>in</strong> order tobe able to cover both the central lobe and the side lobes <strong>of</strong> thevisibility function.Moreover, us<strong>in</strong>g triplets <strong>of</strong> the <strong>long</strong>est basel<strong>in</strong>es <strong>in</strong> the visibleis a powerful means <strong>of</strong> determ<strong>in</strong><strong>in</strong>g accurate limb darken<strong>in</strong>glaws throughout the HR diagram. Limb darken<strong>in</strong>g is a function<strong>of</strong> the wavelength, and <strong>in</strong> particular limb darken<strong>in</strong>g <strong>in</strong> a given<strong>spectral</strong> l<strong>in</strong>e depends upon the physical location <strong>in</strong> the atmosphere<strong>of</strong> the l<strong>in</strong>e-form<strong>in</strong>g region <strong>of</strong> the element. Thus, an accuratemeasurement <strong>of</strong> the limb-darken<strong>in</strong>g with<strong>in</strong> <strong>spectral</strong> l<strong>in</strong>eswill allow us to study the temperature and density structure <strong>of</strong> theatmosphere, hence the strong <strong>in</strong>terest <strong>in</strong> us<strong>in</strong>g multi-telescopecomb<strong>in</strong>ers operat<strong>in</strong>g with dispersed <strong>fr<strong>in</strong>ges</strong>.For VEGA, by adopt<strong>in</strong>g the same approach used for search<strong>in</strong>gto calibrators and consider<strong>in</strong>g the standard VEGA squaredvisibility measurement accuracy <strong>of</strong> 2% and the CHARA <strong>long</strong>estbasel<strong>in</strong>e (330 m), we have determ<strong>in</strong>ed the m<strong>in</strong>imum measurablediameter for a given accuracy. This corresponds to 0.16 mas(resp. 0.12, 0.075) for a 1% (resp. 2%, 5%) accuracy <strong>in</strong> the angulardiameter determ<strong>in</strong>ation. We have then determ<strong>in</strong>ed that suchlimb-darken<strong>in</strong>g studies will be possible for stars spread overnearly the whole Hertzsprung-Russell diagram (exclud<strong>in</strong>g compactobjects) as illustrated <strong>in</strong> Fig. 11, and will result <strong>in</strong> a very4.3. Towards chromatic imag<strong>in</strong>g <strong>of</strong> stellar surfacesand complex environmentsVisibility measurements close to zero and closure phases aresensitive to departures from circular symmetry (due to stellarspots, for <strong>in</strong>stance). Both the 3T and 4T operations are thereforewell adapted to stellar activity studies and/or spot detectionon stellar surfaces. In various contexts, high angular resolutionmeasurements provided by <strong>optical</strong> <strong>in</strong>terferometry appearsto be very relevant to the study <strong>of</strong> geometrical constra<strong>in</strong>ts onstellar spotty surfaces and to be very complementary to exist<strong>in</strong>gspectro-photometric techniques. As an example, this techniquecan be well suited to the detection <strong>of</strong> spots on exoplanet hoststars and to accurately quantify the stellar noise that can mimicplanetary signals <strong>in</strong> radial-velocity and/or transit methods whensearch<strong>in</strong>g for exoplanets (Lagrange et al. 2010). Provided thathigh <strong>spectral</strong> resolution is coupled to <strong>long</strong>-basel<strong>in</strong>e <strong>in</strong>terferometry,another challenge is to be able to detect and image the abundance<strong>in</strong>homogeneities <strong>of</strong> chemically peculiar stars, which willbe an important step <strong>in</strong> more clearly understand<strong>in</strong>g this peculiarclass <strong>of</strong> objects and the physical processes that occur <strong>in</strong> a stronglarge-scale organized magnetic field.4.4. Other scientific goalsCoupl<strong>in</strong>g high angular resolution to high <strong>spectral</strong> resolution isalso <strong>of</strong> <strong>in</strong>terest for k<strong>in</strong>ematic studies that use emission l<strong>in</strong>es.Be<strong>in</strong>g able to reconstruct velocity-resolved images is a powerfulmeans <strong>of</strong> study<strong>in</strong>g the complex environments <strong>of</strong> hot stars,permitt<strong>in</strong>g us to probe the geometry and k<strong>in</strong>ematics <strong>of</strong> the dustand the gas that surrounds these objects or to provide constra<strong>in</strong>tson the size, the <strong>in</strong>cl<strong>in</strong>ation, or the position angle <strong>of</strong> the circumstellardisks. It could also provide <strong>in</strong>formation about the stellarrotation and the differential rotation for fast rotators (Zorec et al.2011).B<strong>in</strong>ary star study will also greatly benefit from a comb<strong>in</strong>ation<strong>of</strong> high <strong>spectral</strong> and high spatial resolutions. This is <strong>in</strong>deedthe ideal way to achieve accurate measurements <strong>of</strong> mass and lum<strong>in</strong>osity,which are the primary parameters <strong>of</strong> stellar evolutionmodels.F<strong>in</strong>ally, it has been demonstrated that us<strong>in</strong>g <strong>spectral</strong> differentialobservables to reconstruct images greatly improves the quality<strong>of</strong> the reconstructed images, which are then astrometricallyl<strong>in</strong>ked from wavelength-to-wavelength (Millour et al. 2011).5. ConclusionWe have described the pr<strong>in</strong>ciples and the formalism <strong>of</strong> thespatio-<strong>spectral</strong> <strong>encod<strong>in</strong>g</strong> <strong>of</strong> <strong>fr<strong>in</strong>ges</strong>. This mode is well adaptedto multi-axial dispersed fr<strong>in</strong>ge <strong>in</strong>struments for <strong>optical</strong> <strong>long</strong>basel<strong>in</strong>e<strong>in</strong>terferometry and allows us to simultaneously reducethe size <strong>of</strong> the optics to accommodate the beams, decrease thenumber <strong>of</strong> pixels that have to be read to correctly analyze allthe fr<strong>in</strong>ge systems, and <strong>in</strong>crease the SNR and thus the limit<strong>in</strong>gmagnitude <strong>of</strong> these <strong>in</strong>struments.Thanks to the dual <strong>in</strong>strument capabilities <strong>of</strong> the CHARA arrayoperat<strong>in</strong>g system, we have been able to use the visible spectrographVEGA <strong>in</strong> parallel with the <strong>in</strong>frared <strong>in</strong>struments CLIMBand MIRC. A low-frequency group-delay track<strong>in</strong>g <strong>of</strong> <strong>fr<strong>in</strong>ges</strong> <strong>in</strong>the <strong>in</strong>frared has been shown to permit an excellent stabilizationA110, page 8 <strong>of</strong> 9
D. Mourard et al.: <strong>Spatio</strong>-<strong>spectral</strong> <strong>encod<strong>in</strong>g</strong> <strong>of</strong> <strong>fr<strong>in</strong>ges</strong> <strong>in</strong> <strong>optical</strong> <strong>long</strong>-basel<strong>in</strong>e <strong>in</strong>terferometryFig. 11. HR diagrams <strong>of</strong> stars observable with VEGA <strong>in</strong> terms <strong>of</strong> accurate limb darken<strong>in</strong>g measurements. Left: ma<strong>in</strong> sequence stars (lum<strong>in</strong>osityclass V); middle: giant stars (lum<strong>in</strong>osity class III); right: supergiants stars (lum<strong>in</strong>osity class I).<strong>of</strong> the <strong>optical</strong> path difference at the level <strong>of</strong> 5 μm over <strong>long</strong> periods<strong>of</strong> time, an achievement that is ideal for a high <strong>spectral</strong>dispersion <strong>in</strong>strument. Thus, observ<strong>in</strong>g fa<strong>in</strong>t visibilities <strong>in</strong> thevisible becomes easier. It has permitted us to qualify the 3T- and4T-mode <strong>of</strong> the VEGA spectrograph. The current performance<strong>of</strong> these modes has been evaluated <strong>in</strong> this paper, <strong>in</strong> terms <strong>of</strong> bothreliability and precision <strong>in</strong> V 2 , closure phase and differential visibilitymeasurements.F<strong>in</strong>ally we have described the <strong>in</strong>terest<strong>in</strong>g astrophysical programsenabled by the comb<strong>in</strong>ation <strong>of</strong> this orig<strong>in</strong>al <strong>encod<strong>in</strong>g</strong>mode and the particular configuration <strong>of</strong> the CHARA Array.Colavita, M. M., Swa<strong>in</strong>, M. R., Akeson, R. L., Koresko, C. D., & Hill, R. J. 2004,PASP, 116, 876Cornwell, T. J. 1987, A&A, 180, 269Coude du Foresto, V., Borde, P. J., Merand, A., et al. 2003, <strong>in</strong> SPIE Conf. Ser.4838, ed. W. A. Traub, 280Ireland, M. J., Mérand, A., ten Brummelaar, T. A., et al. 2008, SPIE Conf. Ser.,7013, 1Kervella, P., Théven<strong>in</strong>, F., Di Folco, E., & Ségransan, D. 2004, A&A, 426, 297Koechl<strong>in</strong>, L., Lawson, P. R., Mourard, D., et al. 1996, Appl. Opt., 35, 3002Labeyrie, A. 1975, ApJ, 196, L71Lagrange, A., Desort, M., & Meunier, N. 2010, A&A, 512, A38Le Bouqu<strong>in</strong>, J., & Tatulli, E. 2006, MNRAS, 372, 639Matter, A., Vannier, M., Morel, S., et al. 2010, A&A, 515, A69Meilland, A., Stee, P., Vannier, M., et al. 2007, A&A, 464, 59Millour, F., Meilland, A., Chesneau, O., et al. 2011, A&A, 526, A107Monnier, J. D., Zhao, M., Pedretti, E., et al. 2008, SPIE Conf. Ser., 7013Mourard, D., Bosc, I., Labeyrie, A., Koechl<strong>in</strong>, L., & Saha, S. 1989, Nature, 342,520Mourard, D., Blazit, A., Bonneau, D., et al. 2006, SPIE Conf. Ser., 6268, 118Mourard, D., Perraut, K., Bonneau, D., et al. 2008, SPIE Conf. Ser., 7013, 62Mourard, D., Clausse, J. M., Marcotto, A., et al. 2009, A&A, 508, 1073Mourard, D., Tallon, M., Bério, P., et al. 2010, SPIE Conf. Ser., 7734, 11Petrov, R. G., Malbet, F., Weigelt, G., et al. 2007, A&A, 464, 1Sturmann, J., Ten Brummelaar, T., Sturmann, L., & McAlister, H. A. 2010, SPIEConf. Ser., 7734, 104Tallon-Bosc, I., Tallon, M., Thiébaut, E., et al. 2008, SPIE Conf. Ser., 7013, 44ten Brummelaar, T. A., McAlister, H. A., Ridgway, S. T., et al. 2005, ApJ, 628,453Vakili, F., & Koechl<strong>in</strong>, L. 1989, <strong>in</strong> SPIE Conf. Ser. 1130, ed. J.-P. Sw<strong>in</strong>gs, 109van Leeuwen, F. 2007, A&A, 474, 653Woan, G., & Duffett-Smith, P. J. 1988, A&A, 198, 375Zorec, J., Frémat, Y., Domiciano de Souza, A., et al. 2011, A&A, 526, A87Ciddor, P. E. 1996, Appl. Opt., 35, 1566Acknowledgements. We wish to warmly thank Farrokh Vakili for fruitfuldiscussions on the topic <strong>of</strong> this paper and for his cont<strong>in</strong>uous support toVEGA/CHARA.VEGA is a collaboration between CHARA and OCA/LAOG/CRAL/LESIA thathas been supported by the French programs PNPS and ASHRA, by INSU andby the Région PACA. The CHARA Array is operated with support from theNational Science Foundation through grant AST-0908253, the W. M. KeckFoundation, the NASA Exoplanet Science Institute, and from Georgia StateUniversity. This research has made use <strong>of</strong> the Jean-Marie Mariotti CenterSearchCal service 3 .ReferencesBerio, P., Stee, P., Vakili, F., et al. 1999, A&A, 345, 203Blazit, A., Rondeau, X., Thiébaut, E., et al. 2008, Appl. Opt., 47, 1141Bonneau, D., Clausse, J., Delfosse, X., et al. 2006a, A&A, 456, 789Bonneau, D., Clausse, J.-M., Delfosse, X., et al. 2006b, A&A, 456, 789Chiavassa, A., Collet, R., Casagrande, L., & Asplund, M. 2010, A&A, 524, A933 Available at http://www.jmmc.fr/searchcal co-developped byFIZEAU and LAOG, <strong>of</strong> the Jean-Marie Mariotti Center LITpro serviceco-developed by CRAL, LAOG and FIZEAU, and <strong>of</strong> CDSAstronomical Databases SIMBAD and VIZIER 4A110, page 9 <strong>of</strong> 9