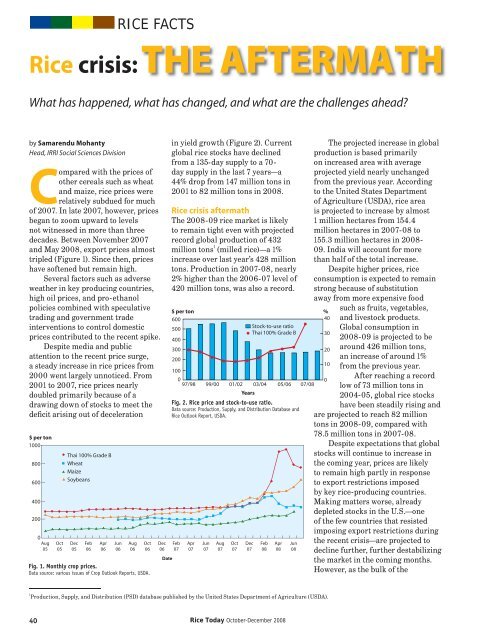
RICE FACTS<strong>Rice</strong> crisis:THE AFTERMATHWhat has happened, what has changed, and what are the challenges ahead?by Samarendu MohantyHead, IRRI Social Sciences DivisionCompared with the prices ofother cereals such as wheatand maize, rice prices wererelatively subdued for muchof 2007. In late 2007, however, pricesbegan to zoom upward to levelsnot witnessed in more than threedecades. Between November 2007and May 2008, export prices almosttripled (Figure 1). Since then, priceshave softened but remain high.Several factors such as adverseweather in key producing countries,high oil prices, and pro-ethanolpolicies combined with speculativetrading and government tradeinterventions to control domesticprices contributed to the recent spike.Despite media and publicattention to the recent price surge,a steady increase in rice prices from2000 went largely unnoticed. From2001 to 2007, rice prices nearlydoubled primarily because of adrawing down of stocks to meet thedeficit arising out of deceleration$ per ton10008006004002000Aug05Oct05Thai 100% Grade BWheatMaizeSoybeansDec05Feb06Apr06Jun06Aug06Oct06Fig. 1. Monthly crop prices.Data source: various issues of Crop Outlook Reports, USDA.Dec06Datein yield growth (Figure 2). Currentglobal rice stocks have declinedfrom a 135-day supply to a 70-day supply in the last 7 years—a44% drop from 147 million tons in2001 to 82 million tons in 2008.<strong>Rice</strong> crisis aftermathThe 2008-09 rice market is likelyto remain tight even with projectedrecord global production of 432million tons 1 (milled rice)—a 1%increase over last year’s 428 milliontons. Production in 2007-08, nearly2% higher than the 2006-07 level of420 million tons, was also a record.$ per ton600500Stock-to-use ratioThai 100% Grade B400300200100097/98 99/00 01/02 03/04 05/06 07/08YearsFig. 2. <strong>Rice</strong> price and stock-to-use ratio.Data source: Production, Supply, and Distribution Database and<strong>Rice</strong> Outlook Report, USDA.Feb07Apr07Jun07Aug07Oct07Dec07Feb08Apr08Jun08The projected increase in globalproduction is based primarilyon increased area with averageprojected yield nearly unchangedfrom the previous year. Accordingto the United States Departmentof Agriculture (USDA), rice areais projected to increase by almost1 million hectares from 154.4million hectares in 2007-08 to155.3 million hectares in 2008-09. India will account for morethan half of the total increase.Despite higher prices, riceconsumption is expected to remainstrong because of substitutionaway from more expensive food%403020100such as fruits, vegetables,and livestock products.Global consumption in2008-09 is projected to bearound 426 million tons,an increase of around 1%from the previous year.After reaching a recordlow of 73 million tons in2004-05, global rice stockshave been steadily rising andare projected to reach 82 milliontons in 2008-09, compared with78.5 million tons in 2007-08.Despite expectations that globalstocks will continue to increase inthe coming year, prices are likelyto remain high partly in responseto export restrictions imposedby key rice-producing countries.Making matters worse, alreadydepleted stocks in the U.S.—oneof the few countries that resistedimposing export restrictions duringthe recent crisis—are projected todecline further, further destabilizingthe market in the coming months.However, as the bulk of the1Production, Supply, and Distribution (PSD) database published by the United States Department of Agriculture (USDA).40 <strong>Rice</strong> <strong>Today</strong> October-December 2008RT7-4 (p24-44)_FA.indd 4010/9/2008 8:28:42 AM
2008 crop enters the market inOctober, prices may soften.Long-term challengesDespite some reassuring supplynumbers for 2008-09, there arehuge uncertainties regarding thesource of future growth in globalrice production. The annual riceyield growth rate has droppedto less than 1% in recent years,compared with 2–3% during theGreen Revolution period of 1967-90.Declining investments inall areas of rice research andinfrastructure development(including irrigation) have beenlargely responsible for such dramaticslowing in yield growth. The same isnot true for many other field cropssuch as maize, soybeans, and cotton,for which increased investmentin the development of improvedvarieties and infrastructure ha<strong>sr</strong>esulted in impressive yield growth.Increasing rice productionthrough area expansion is alsounlikely in most parts of theworld because of water scarcityand competition for land fromnonagricultural uses such asindustrialization and urbanization.World rice area has fluctuatedbetween 145 and 155 million hectaresover the past two decades, withthe current level very close to thehistoric high. It would be prudentto assume that world rice area willremain in or even fall below thi<strong>sr</strong>ange in the next 10 to 15 years.Changing consumption patternsGlobal rice consumption remainsstrong, driven by both populationand economic growth in manyAsian and African countries.This is particularly true for mostcountries in sub-Saharan Africa(SSA), where high populationgrowth combined with changingconsumer preferences is causingrapid expansion in rice consumption.However, global average per-capitarice consumption has been flatfor the last 5 years, with decliningper-capita consumption in somecountries (China, Thailand, SouthKorea, Japan, and Taiwan) offsetby rising per-capita consumptionin others (the United States, India,Vietnam, Myanmar, the Philippines,Bangladesh, and SSA countries).In rapidly growing developingcountries, income growth,urbanization, and other long-termsocial and economic transformationsmean that consumer demandpatterns are likely to move toward theconsumption patterns of developedcountries. A recent analysis bythe International <strong>Rice</strong>Research Institute(IRRI) projects that, asthe standard of living inthe developing countrie<strong>sr</strong>ises in the future, overallper-capita consumptionwill decline slightly from64 kilograms in 2007 to63.2 kilograms in 2020.Among major riceconsumingcountries,both Chinese and Indian000 tons500,000400,000300,000200,000per-capita consumption during thisperiod is projected to decline by4.2 and 3.5 kilograms, respectively(Figure 3). Nevertheless, even withsuch a decline in per-capita ricekilograms120100806020002015200720204020World India ChinaFig. 3. Per-capita rice consumption.consumption, total consumptionin these two countries is projectedto increase by 18 million tonsbecause of population growth.Overall, China’s and India’sshare in total world consumptionis projected to fall from 52% in2007 to 49% in 2020. The declinein per-capita consumption is alsoprojected to continue in Japan,South Korea, Thailand, andTaiwan. For many other countries,including the Philippines, Myanmar,Bangladesh, Malaysia, Saudi Arabia,and many African nations, percapitaconsumption is projected toincrease over the same period. Anincrease in per-capita consumptionis also projected for many developedcountries in North America andthe European Union because ofimmigration and food diversification.Overall, 59 million tons ofadditional milled rice—equivalentto around 89 million tons of paddy(unmilled) rice—will be needed by2020 above the 2007 consumption of422 million tons (Figure 4). However,2020 consumption projections may59 million tons200020022004200620082010201220142016YearFig. 4. Total milled rice consumption.20182020go even higher if prices of other fooditems (livestock products, fruits, andvegetables) remain high, causingslow progress in diet diversificationin developing countries.What does this mean for IRRI?The current crisis serves as a timelywakeup call for governments,multilateral organizations, anddonors to refocus on agriculture.Various national and internationalbodies have called for a secondGreen Revolution to feed theworld in the face of a growingpopulation and shrinking landbase for agricultural uses.Unlike the first Green Revolution,in which productivity growth wasachieved with the introduction ofmodern varieties in tandem withassured irrigation and inputs (suchas fertilizer), and guaranteed prices,the second Green Revolution needsto achieve the same goal in the face ofseveral 21st-century challenges. Thesechallenges include water and landscarcity, environmental degradation,skyrocketing input prices, andglobalized marketplaces. In short, thesecond Green Revolution will have toexpand productivity in a sustainablemanner with fewer resources.<strong>Rice</strong> <strong>Today</strong> October-December 200841RT7-4 (p24-44)_FA.indd 4110/9/2008 8:28:42 AM


