CG-3 Description & Test Results - Scintrex
CG-3 Description & Test Results - Scintrex
CG-3 Description & Test Results - Scintrex
Create successful ePaper yourself
Turn your PDF publications into a flip-book with our unique Google optimized e-Paper software.
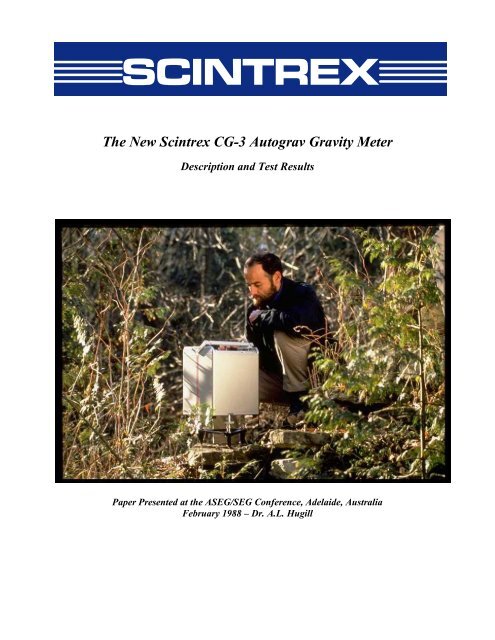
SCINTREXThe New <strong>Scintrex</strong> <strong>CG</strong>3 Autograv Gravity Meter<strong>Description</strong> and <strong>Test</strong> <strong>Results</strong>Paper Presented at the ASEG/SEG Conference, Adelaide, AustraliaFebruary 1988 – Dr. A.L. Hugill
IntroductionCommercially available gravity meters for use on land in the post World War II period have beendominated by two designs: the Worden type of quartz instrument, and the Lacoste and Romberg, with ametal sensor. Both of these were developed to operate without the use of electronics. They rely on thezero length spring concept developed by Lacoste (1934) to obtain high mechanical sensitivity to gravitychanges (astatisation) and to reduce the effect of seismic noise.Although the accuracy of these instruments is adequate for their intended applications, they have severaldeficiencies both from an operational and a manufacturing viewpoint.In normal field use with both instrument types, the operator is required tonull the sensor beam manually by rotating a micrometer screw and then record the reading manually.There are several possible sources of error in this process and a high level of operator skill andexperience is required. Entering thedata into a computer for processing is time consuming and is a further source of potential error.The manufacturing difficulties are significant. Achieving astatisation requires a finely balancedmechanism. Mechanical feedback systems require more precision mechanisms. They also incorporatemechanical feedthroughs into the chamber containing the sensing element, leading to pressuresensitivity problems. Solutions to these further increase the complexity of the system.As well, the adjustments required to effect mechanical temperature compensation in quartz instrumentsdemands an extremely high level of craftsmanship. In the Lacoste and Romberg instruments the problemis reduced by using low temperature coefficient alloys. These however are sensitive to magnetic fieldvariations, making it necessary to shield the sensor.Against this background, <strong>Scintrex</strong> started the development four years ago of a new gravity meter, the<strong>CG</strong>3. The goals of the project were to overcome the operational deficiencies of existing instruments,and to produce a design that was mechanically simple enough to be manufactured on a routineproduction basis, on the assumption that the electronic advances of the thirty to forty years since theinitial development of the Worden and Lacoste instruments could be utilized to achieve these goals.The more specific technological base for the development was the recent introduction of the <strong>Scintrex</strong>IGS general purpose field portable data acquisition/control system; and current developments in theapplication of capacitive displacement transducers and electrostatic feedback to gravity meters (Hugill1984).An instrument conforming to these requirements has successfully been developed, and is presently in thefinal testing stages. This paper describes the <strong>CG</strong>3 gravity meter and its performance in laboratory andfield tests.2
Sensor DesignThe sensing element of the <strong>CG</strong>3 gravity meter (figure 1) is based on a fused quartz elastic system. Thegravitational force on the proof mass is balanced by a spring and a relatively small electrostatic restoringforce. The position of the mass, which is sensed by a capacitive displacement transducer, is altered by achange in gravity. An automatic feedback circuit applies DC voltage to the capacitor plates producing anelectrostatic force on the mass, which brings it back to a null position. The feedback voltage, which is ameasure of the relative value of gravity at the reading site, is converted to a digital signal and thentransmitted to the instrument's data acquisition system for processing, display and storage.Figure 1 <strong>CG</strong>3 Principle of OperationThe inherent strength and excellent elastic properties of fused quartz together with limit stops around theproof mass permit the instrument to be operated without clamping. Further protection is provided by adurable shock mount system attaching the sensor to the housing.The parameters of the gravity sensor and its electronic circuits are chosen so that the feedback voltagecovers a range of over 7000 mGals without resetting. The use of a lownoise electronic design togetherwith a highly accurate autocalibrating analog to digital converter results in a resolution of 0.01 mGal,equipping the gravity meter for both detailed field investigations and large scale regional or geodeticsurveys.The instruments' tilt sensors are also electronic, with a resolution of I arc second. The outputs from thesensors are displayed on high resolution meters on the instrument's front panel and also transmitted tothe data acquisition system where they are displayed and stored. If the instrument is operated on anunstable base, realtime corrections for tilt errors are automatically made overa range of +200 arc seconds.3
Protection from ambient temperature changes is provided by locating the quartz elastic system, theanalog to digital converter, sensitive electronic components and the tilt sensors inside a highstability,two stage, thermostatically controlled environment. There is no mechanical temperature compensation.External temperature changes are reduced by a factor of 105 and small residual effects are corrected insoftware using the output of a sensor located in close thermal contact with the main spring. Theoperating range of the thermostat in the standard instrument is –40°C to +45°C. However, as there is nocritical operating point for the sensor, the upper operating temperature can be set at a higher or lowervalue.The entire gravity sensing mechanism is enclosed in a vacuum chamber. As there are no mechanicalfeedthroughs, excellent isolation from variations in atmospheric pressure is obtained. This extremelystable operating environment for the quartz elastic system allows the longterm drift of the sensor to beaccurately predicted, and realtime software correction reduces it to less than 0.02 mGals/day.The sensor design is mechanically very simple for several reasons. The fine balancing required to obtainastatisation is not needed, as the displacement transducer has sufficient resolution (0.2nm) to detect thebeam position of a nonastatised system, and electronic filtering reduces the effect of seismic noise. Themechanisms, micrometer screws, gearboxes and mechanical feedthroughs associated with mechanicalfeedback systems have been replaced by a voltage applied to the same plates, which form thedisplacement transducer. The temperature control is also accurate enough for the sensor to operatewithout mechanical compensation.PackagingThe housing has been integrated with the carrying case (Fig. 2), so that one unit contains the sensor,supported by shockproof mounts, the data acquisition/control module, and the battery. This designreduces handling and therefore the danger of associated accidents of various kinds, such as upsetting theinstrument with the cable connecting the sensor to the battery. The dimensions are specifically designedto fit under an airline seat. The base of the gravity meter case incorporates a kinematic mounting systemwhich indexes onto the tripod, further increasing instrument stability.4
Figure 2. Integrated HousingThe unit is fully weatherproof. The total weight of the instrument including the battery is 12kg.The housing's modular concept enables the control console to be removed for maintenance or alternativeuse. With the standard <strong>CG</strong>3 Autograv the control console is dedicated to the gravity meter. With theIGS2/<strong>CG</strong>4 version of the instrument a <strong>Scintrex</strong> IGS2 System Control Console is used. This version hasidentical performance to the <strong>CG</strong>3 with respect to gravity measurements but offers additional flexibility.The addition of a proton magnetometer sensor allows gravity and magnetic measurements to be madesimultaneously. When the console is removed, it can be used to perform magnetic, VLF, IP or othermeasurements when equipped with the appropriate sensors.The battery is charged through an external connector without being taken out of the case. Thisconnector is also used with an external power source such as a battery belt for cold weather operation.The standard 5.7Ah leadacid battery has a life of approximately 12 hrs at 25°C. Battery voltage can bemonitored on the instrument display; an alarm sounds when the battery is within 30 minutes of beingdischarged.Control Console and SoftwareThe control console includes a 14key dual function keyboard, a 32character LCD display, themicroprocessor and the solid state memory. It processes and applies corrections to the signals from thesensor, stores data and formats it for outputting, and performs instrument control functions. A menuformat with prompts is used to operate the instrument.The gravity meter has two modes of operation: a field mode and a cycling mode. In field mode, readingsare initiated by the operator. In cycling mode, a series of readings are made automatically with a presetcycle time between each reading. The software function is essentially the same in both modes.5
Prior to the commencement of each reading, a softwarecontrolled procedure calibrates the A/Dconverter, using a highstability internal voltage reference. When the calibration is completed, the A/Dconverter samples the gravity sensor output every second. The individual samples are averaged to filterout seismic noise. The standard deviation of the mean of the samples is displayed in realtime.Corrections for tilts, sensor temperature and longterm drift are made every second during the reading. Astatistical rejection criterion is used to discard any noise spikes. A tide correction is applied at the end ofthe reading. (These last two functions can be disabled from the keyboard.)When a measurement is completed the gravity reading is stored in the memory along with nine othervariables. These are: station number, standard deviation of the mean; tilts (X and Y); sensortemperature; tide correction; reading duration; number of rejected samples; time of start of reading. Allcurrent and stored data can be viewed on the LCD display, using the scroll feature on the keyboard.As well, additional information can be entered at the time of measurement for recording in memory.Eight blocks of data, each containing up to a fivedigit signed number, can be stored with each reading.The standard memory stores up to 420 readings and can be expanded to a maximum of 1260 readings.The memory is protected for several days in the event of battery failure.Other information is also generated and is accessible through the display, including time, date, batteryvoltage and available memory space.The instrument is equipped with an RS232 interface. This enables data from the memory to be accessedthrough a connector on the instrument front panel. Output of selected portions or of the entire contentsof the memory can be obtained in the form of a data listing or as a plot, which can be printed out directlyon to a line printer, transferred to a portable computer or tape recorder or transmitted over a telephoneline to a modem.Header information consisting of survey parameters and instrument constants is shown at the top of eachdata listing (fig. 3). Each gravity reading is located by station number and time. The record of the othervariables facilitates data quality control. For example, the record of tilts indicates if the instrument hasbeen properly levelled; sensor temperature shows if the thermostat is functioning correctly; the standarddeviation of the mean (ERR) and the number of rejections indicate the noise level at the measurementsite.6
Figure 3. Atypical gravity meter listing Units are mGal for gravity, ERR and tide: arcseconds for tilts: mK for temperature. Duration is in seconds.An example of data output as a plot is shown on Fig. 4. Up to two variables can be plotted either as afunction of station number along a survey line in field mode; or as function of time in cycling mode. Theplot scale and offset bias are adjustable for each variable plotted.7
Figure 4. Data Output as a plot. Corrected gravity and tide correction are plotted as a function of time.8
In cycling mode the corrected gravity value is converted to a voltage which is available on the RS232connector. This enables the gravity signal to be continuously monitored on a chart recorder. Output scaleis controlled by the software and the system is autobiasing so that no adjustment is required tobring the recorder into range.Examples of analog records are shown in Figs. 58.Operating ProcedureWhen the instrument is placed on the tripod, the start key is pushed once. This initiates the A/Dconverter calibration procedure and displays the tilt sensor outputs in digital form. When levelling iscompleted, the start key is pushed again. The instrument pauses for two seconds. (This allows anydisturbance to dissipate.) The reading then commences. During the reading, the operator can observegravity, standard deviation of the mean, and reading duration, which are displayed simultaneously andupdated every second. (As the gravity reading is a continuous average of onesecond samples, it willconverge as the reading progresses, and the standard deviation of the mean will also decrease.) Thereading is stopped automatically according to the chosen preset time, or manually by pressing the stopkey when the reading has stabilized sufficiently. (The time required for convergence depends on seismicnoise. In a quiet location, a 20second reading is sufficient.)Pressing the record key stores the reading when the measurement is completed.If the operator does not want to record a reading, pressing the start key again will reset the instrumentfor another reading. Alternatively, more than one reading made with the same coordinates at differenttimes can be stored.If the auto station increment feature has been selected, the next station number is entered automaticallywhen the record key is pressed. Otherwise the instrument prompts for the next station number, which isentered from the keyboard. The instrument is now ready to be moved to another location.Ancillary information, such as tripod height or instrument elevation, must be entered before the recordkey is pressed.<strong>Results</strong> of Laboratory <strong>Test</strong>s<strong>Results</strong> of laboratory tests to determine instrument sensitivity to changes in temperature, pressure andmagnetic field are presented below.Figure 5 shows the results of high and low temperature tests performed on an instrument specified tooperate up to 50°C. In the high temperature test the instrument was set up in cycling mode and aportable oven lowered over it and left there for over 2 hours. The analog output of the gravity meter andthe air temperature close to the instrument were recorded continuously throughout the test. Readings arestable until the temperature reaches 55°C. When the oven is removed the temperature drops rapidly from47°C to 24°C. There is a delayed increase of approximately 0.02 mGal in reaction to this step.9
Figure 5. <strong>Results</strong> of high and low temperature tests. Gravity signal comes directly from the analogoutput of the instrument.10
In the low temperature test the instrument was placed in a test chamber set at –30°C for approximately 4hours. Recording started again as soon as it was removed. The initial readings with the instrument stillcold show an offset of around 0.03mGal. There was no further offset as a result of the 54°C temperatureshock.The pressure sensitivity of the instrument was measured by setting the instrument up in a vacuumchamber with the analog output connected to recorder outside the chamber. The pressure was reducedfrom 1 atm to 0.15 atm and held there for 50 minutes. After some initial noise due to temperaturechanges and pressure sensitivity of the electronic components there was an offset of 0.02 0.03 mGal(fig. 6). A similar response can be seen when the pressure is returned to its initial value.Figure 6. Effect of Pressure ChangeMagnetic field sensitivity was determined by orienting a coil along each of three perpendicular axes andapplying fields of +15 Gauss and 15 Gauss (Fig. 7). The maximum deflection was approximately 0.02mGal.11
Figure 7. Magnetic Field SensitivityIn summary: the temperature sensitivity of the instrument is less than 0.001 mGal/°C, pressuresensitivity is 0.03 mGal/atm and maximum magnetic field sensitivity 0.00013 mGal/Gauss.<strong>Results</strong> of Field <strong>Test</strong>sIn this section the results of representative field tests are presented. Repeatability, linearity and the effectof transport on long term drift rate are discussed.<strong>Results</strong> of a field test performed on a test site located 65 km from the <strong>Scintrex</strong> plant are shown in figure8. Two loops of approximately 20 km were made around the test range with the instrument beingtransported by car over badly corrugated unsealed roads. The largest deviation of a reading from thestation mean was less than 0.02 mGal and the standard deviation of the difference between individualreadings and station means is 0.007 mGal.12
Figure 8. Repeatability – transport on sealed and usealed roadsFigure 9 summarizes the results of two test runs along the OrangevilleOrillia calibration line north ofToronto. This 140 km/120 mGal line was established and is maintained by the Geological Survey ofCanada using Lacoste and Romberg models G and D meters. The linearity for both runs is better than0.015% with the largest difference between repeat readings at any station being approximately .02mGal.Figure 9. <strong>Test</strong> runs on the OrangevilleOrillia Calibration Line13
Figure 10. Effect of transport on drift rate14
ConclusionThe <strong>CG</strong>3 represents several significant advances in gravity meter design. Its microprocessorcontrolledautomatic reading and data acquisition system overcome many of the operational deficiencies of existinginstruments; extensive use of electronics simplifies the mechanical design and standardizes theproduction process. The test results shown above, which demonstrate the high performance capacity ofthe instrument, and the ease of operation, fully vindicate the design approach.Other features of the <strong>CG</strong>3, such as the electronic tilt compensation and the integrated housing, set newstandards for gravity meter design, and indicate the direction of future developments in the field.ReferencesHugill, A.L., 1984, “The design of a gravimeter with automatic readout”. Ph.D. Thesis, FlindersUniversity, Bedford Park, South Australia.LaCoste, L.J.B., 1934, “A new type of long period vertical seismograph”, Physics, 5, pp. 178181.15


