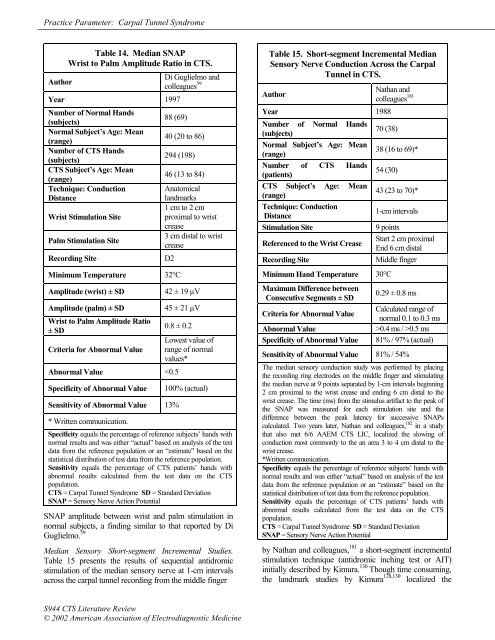
<strong>Practice</strong> <strong>Parameter</strong>: Carpal Tunnel SyndromeTable 14. Median SNAPWrist to Palm Amplitude Ratio in CTS.AuthorDi Guglielmo <strong>and</strong>colleagues 59Year 1997Number <strong>of</strong> Normal H<strong>and</strong>s(subjects)88 (69)Normal Subject’s Age: Mean(range)40 (20 to 86)Number <strong>of</strong> CTS H<strong>and</strong>s(subjects)294 (198)CTS Subject’s Age: Mean46 (13 to 84)(range)Technique: ConductionDistanceWrist Stimulation SitePalm Stimulation SiteRecording SiteMinimum Temperature 32°CAnatomicall<strong>and</strong>marks1 cm to 2 cmproximal to wristcrease3 cm distal to wristcreaseD2Amplitude (wrist) ± SD 42 ± 19 µVAmplitude (palm) ± SD 45 ± 21 µVWrist to Palm Amplitude Ratio± SDCriteria for Abnormal Value0.8 ± 0.2Abnormal Value 0.4 ms / >0.5 ms81% / 97% (actual)Sensitivity <strong>of</strong> Abnormal Value 81% / 54%The median sensory conduction study was performed by placing<strong>the</strong> recording ring electrodes on <strong>the</strong> middle finger <strong>and</strong> stimulating<strong>the</strong> median nerve at 9 points separated by 1-cm intervals beginning2 cm proximal to <strong>the</strong> wrist crease <strong>and</strong> ending 6 cm distal to <strong>the</strong>wrist crease. The time (ms) from <strong>the</strong> stimulus artifact to <strong>the</strong> peak <strong>of</strong><strong>the</strong> SNAP was measured for each stimulation site <strong>and</strong> <strong>the</strong>difference between <strong>the</strong> peak latency for successive SNAPscalculated. Two years later, Nathan <strong>and</strong> colleagues, 182 in a studythat also met 6/6 AAEM CTS LIC, localized <strong>the</strong> slowing <strong>of</strong>conduction most commonly to <strong>the</strong> an area 3 to 4 cm distal to <strong>the</strong>wrist crease.*Written communication.Specificity equals <strong>the</strong> percentage <strong>of</strong> reference subjects’ h<strong>and</strong>s withnormal results <strong>and</strong> was ei<strong>the</strong>r “actual” based on analysis <strong>of</strong> <strong>the</strong> testdata from <strong>the</strong> reference population or an “estimate” based on <strong>the</strong>statistical distribution <strong>of</strong> test data from <strong>the</strong> reference population.Sensitivity equals <strong>the</strong> percentage <strong>of</strong> CTS patients’ h<strong>and</strong>s withabnormal results calculated from <strong>the</strong> test data on <strong>the</strong> CTSpopulation.CTS = Carpal Tunnel Syndrome SD = St<strong>and</strong>ard DeviationSNAP = Sensory Nerve Action Potentialby Nathan <strong>and</strong> colleagues, 181 a short-segment incrementalstimulation technique (antidromic inching test or AIT)initially described by Kimura. 130 Though time consuming,<strong>the</strong> l<strong>and</strong>mark studies by Kimura 128,130 localized <strong>the</strong>S944 CTS <strong>Literature</strong> <strong>Review</strong>© 2002 American Association <strong>of</strong> Electrodiagnostic Medicine
<strong>Practice</strong> <strong>Parameter</strong>: Carpal Tunnel Syndromeabnormality <strong>of</strong> median sensory conduction in most CTSpatients to <strong>the</strong> distal edge <strong>of</strong> <strong>the</strong> carpal ligament, <strong>and</strong> thisfinding has been confirmed by Nathan <strong>and</strong> colleagues, 182White <strong>and</strong> colleagues, 264 Imaoka <strong>and</strong> colleagues, 106 <strong>and</strong>Seror. 226 Because a frequency distribution <strong>of</strong> <strong>the</strong>segmental latency differences in <strong>the</strong> normal subjectsshowed a skewed distribution <strong>of</strong> data, Nathan 181 used acontingency table to evaluate <strong>the</strong> sensitivity <strong>and</strong>specificity <strong>of</strong> 2 different criteria <strong>of</strong> abnormality (0.4 ms<strong>and</strong> 0.5 ms). Although Nathan 181 recommends use <strong>of</strong> <strong>the</strong>0.4 ms criterion <strong>of</strong> abnormality, only <strong>the</strong> 0.5 ms criterionprovides specificity (97%) comparable to <strong>the</strong> o<strong>the</strong>r testspresented in this review.Imaoka <strong>and</strong> colleagues 106 in a study that met 5 <strong>of</strong> <strong>the</strong> 6AAEM CTS LIC, used a special linear grid <strong>of</strong> 9 surfaceelectrodes at 15 mm intervals (a total <strong>of</strong> 8 neighboringpairs <strong>of</strong> electrodes) to record <strong>the</strong> median SNAPsimultaneously across <strong>the</strong> wrist with stimulation <strong>of</strong> <strong>the</strong>median nerve at <strong>the</strong> elbow. With a criterion <strong>of</strong> deviationby 0.6 ms or more from a predicted peak latency valuebased on measurements <strong>of</strong> peak latencies recordedproximal to <strong>the</strong> wrist crease, Imaoka 106 <strong>and</strong> colleagues(1992) reported a specificity <strong>of</strong> 99% compared to normalsubjects (mean + 3 SD) <strong>and</strong> a high test sensitivity (87% inmild CTS).Seror, 226 in a study that met 4 <strong>of</strong> <strong>the</strong> 6 AAEM CTS LIC,used an orthodromic inching test (OIT) with stimulation<strong>of</strong> <strong>the</strong> third digit <strong>and</strong> measuring <strong>the</strong> peak latency <strong>of</strong> <strong>the</strong>SNAP recorded with a bipolar fixed distance (22 mm)surface electrode moved centimeter by centimeter from apoint 4 cm proximal to <strong>the</strong> distal wrist crease to a point 6cm distal to <strong>the</strong> distal wrist crease to provide 11measurements; an abnormality was defined as aconduction delay greater than 0.36 ms based on controlstudies with a range <strong>of</strong> 0.20 to 0.34 ms. Seror 226concluded that most CTS patients can be diagnosed witho<strong>the</strong>r methods <strong>and</strong> that <strong>the</strong> more time consuming“inching” technique is needed to confirm <strong>the</strong> diagnosis inonly about 5% <strong>of</strong> all CTS patients.Seror, 224 in a study that met 4 <strong>of</strong> <strong>the</strong> 6 AAEM CTS LIC,concluded that <strong>the</strong> OIT was superior to <strong>the</strong> AIT because<strong>the</strong> OIT was more sensitive than <strong>the</strong> AIT, <strong>the</strong> stimulationsite <strong>and</strong> intensity was unchanged during <strong>the</strong> study whichensures that <strong>the</strong> same nerve fibers are evaluated, <strong>and</strong> <strong>the</strong>stimulation intensity is less <strong>and</strong> better tolerated by <strong>the</strong>patient compared to AIT.Comparison <strong>of</strong> Carpal Tunnel Segment Median MixedNerve Conduction to More Proximal (Forearm) MixedNerve Conduction or Distal (palm to digit) MedianSensory Nerve Conduction. The possible usefulness <strong>of</strong>comparing CVs <strong>of</strong> different segments <strong>of</strong> <strong>the</strong> same nerveto demonstrate focal conduction slowing to minimizeintersubject variability has been evaluated with mediansensory <strong>and</strong> mixed nerve conduction in CTS patients. Theresults <strong>of</strong> 2 studies that met all 6 AAEM CTS LIC arepresented in Table 16. The first by Scelsa 221 concludedthat comparison <strong>of</strong> <strong>the</strong> median palm to index fingersensory CV to <strong>the</strong> median carpal tunnel mixed nerve CVdemonstrated a sensitivity to detect CTS (87%) that wassignificantly greater than <strong>the</strong> sensitivity (61%) <strong>of</strong>comparison <strong>of</strong> <strong>the</strong> median forearm CV to <strong>the</strong> mediancarpal tunnel CV with similar specificities (98% <strong>and</strong> 96%,respectively). The second by Kuntzer 140 demonstrated anintermediate sensitivity (69%) with similar specificity(99%) by comparison <strong>of</strong> <strong>the</strong> peak latency <strong>of</strong> <strong>the</strong> mixednerve median palm to wrist segment to <strong>the</strong> peak latency<strong>of</strong> <strong>the</strong> median sensory palm to D2 segment. There are also2 studies that meet all 6 AAEM CTS LIC by Padua <strong>and</strong>colleagues 188,189 that described <strong>the</strong> usefulness <strong>of</strong> a ratio <strong>of</strong><strong>the</strong> orthodromic sensory CV for 2 segments <strong>of</strong> <strong>the</strong> mediansensory nerve (D3 to palm/palm to wrist) to diagnoseCTS with high sensitivity: 1996, 98% <strong>and</strong> 1997, 97%.In 1985, Kimura <strong>and</strong> Ayyar 131 reported a 100% incidence<strong>of</strong> abnormalities in CTS patients if <strong>the</strong> ratio <strong>of</strong> <strong>the</strong> medianantidromic sensory CV across <strong>the</strong> wrist to <strong>the</strong> mediansensory CV across <strong>the</strong> forearm was calculated. However,in a study that met 4 <strong>of</strong> <strong>the</strong> 6 AAEM CTS LIC, Rosen 214noted that <strong>the</strong> quotient <strong>of</strong> <strong>the</strong> median antidromic mixednerve CV in <strong>the</strong> carpal tunnel segment to <strong>the</strong> antidromicmedian sensory CV in <strong>the</strong> forearm segment (70%) wasless sensitive than median mixed nerve palm to wristconduction (100%).Buschbacher, 33 in a study <strong>of</strong> 258 normal subjects listed inTable 1, noted that 50% <strong>of</strong> <strong>the</strong> wrist to digit mediansensory peak latency is attributable to <strong>the</strong> wrist-palmsegment, a finding that agrees well with <strong>the</strong> ratio <strong>of</strong> <strong>the</strong>peak latency for <strong>the</strong> 2 segments reported by Kuntzer: 1400.98 ± 0.17 in Table 16.Comparison <strong>of</strong> Median Sensory Nerve Conduction toUlnar or Radial Sensory Nerve Conduction in <strong>the</strong> SameLimb. In <strong>the</strong>ory, <strong>the</strong> biologic variation in speed <strong>of</strong> nerveconduction from person to person due to age <strong>and</strong> geneticdifferences can be controlled by comparison <strong>of</strong> <strong>the</strong> speed<strong>of</strong> nerve conduction in 1 nerve to ano<strong>the</strong>r nerve in <strong>the</strong>same limb. 69,243 This comparison principle underlies <strong>the</strong>basis for development <strong>of</strong> <strong>the</strong> sensory NCSs reported inTables 17, 18, 19, <strong>and</strong> 20.Comparison <strong>of</strong> Median <strong>and</strong> Ulnar Sensory NerveConduction Between Wrist <strong>and</strong> Digit. Table 17presents <strong>the</strong> results <strong>of</strong> a study that met all 6 AAEMCTS LIC by Kuntzer 140 who determined <strong>the</strong> differencebetween <strong>the</strong> median <strong>and</strong> ulnar nerve peak latencymeasurements with orthodromic stimulation (14-cmconduction distance) in CTS patients <strong>and</strong> normalcontrol subjects <strong>and</strong> found <strong>the</strong> percentage <strong>of</strong> CTSpatients with abnormal values was 61%. Stetson, 242 in aMuscle & Nerve Supplement X 2002 S945