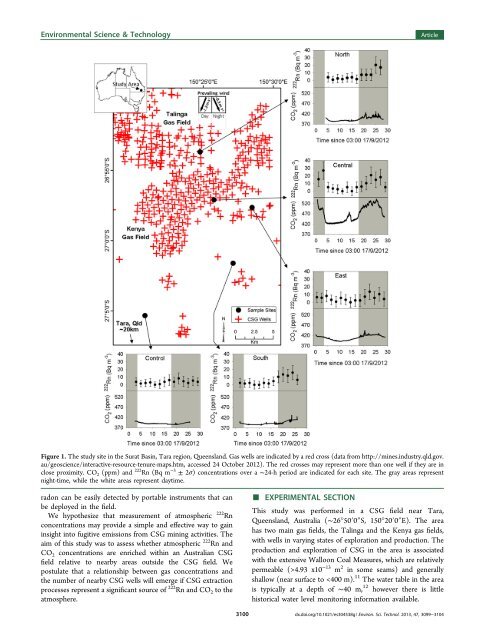
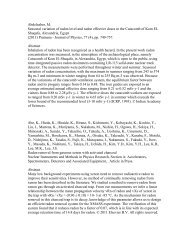
Environmental Science & TechnologyArticleFigure 1. The study site <strong>in</strong> <strong>the</strong> Surat Bas<strong>in</strong>, Tara region, Queensl<strong>and</strong>. Gas wells are <strong>in</strong>dicated by a red cross (data from http://m<strong>in</strong>es.<strong>in</strong>dustry.qld.gov.au/geoscience/<strong>in</strong>teractive-resource-tenure-maps.htm, accessed 24 October 2012). The red crosses may represent more than one well if <strong>the</strong>y are <strong>in</strong>close proximity. CO 2 (ppm) <strong>and</strong> 222 Rn (Bq m −3 ± 2σ) concentrations over a ∼24-h period are <strong>in</strong>dicated for each site. The gray areas representnight-time, while <strong>the</strong> white areas represent daytime.■radon can be easily detected by portable <strong>in</strong>struments that can EXPERIMENTAL SECTIONbe deployed <strong>in</strong> <strong>the</strong> field.We hypo<strong>the</strong>size that measurement <strong>of</strong> atmospheric 222 This study was performed <strong>in</strong> a CSG field near Tara,RnQueensl<strong>and</strong>, Australia (∼26°50′0″S, 150°20′0″E). The areaconcentrations may provide a simple <strong>and</strong> effective way to ga<strong>in</strong><strong>in</strong>sight <strong>in</strong>to fugitive emissions from CSG m<strong>in</strong><strong>in</strong>g activities. Thehas two ma<strong>in</strong> gas fields, <strong>the</strong> Tal<strong>in</strong>ga <strong>and</strong> <strong>the</strong> Kenya gas fields,aim <strong>of</strong> this study was to assess whe<strong>the</strong>r atmospheric 222 Rn <strong>and</strong>with wells <strong>in</strong> vary<strong>in</strong>g states <strong>of</strong> exploration <strong>and</strong> production. TheCO 2 concentrations are enriched with<strong>in</strong> an Australian CSG production <strong>and</strong> exploration <strong>of</strong> CSG <strong>in</strong> <strong>the</strong> area is associatedfield relative to nearby areas outside <strong>the</strong> CSG field. We with <strong>the</strong> extensive Walloon Coal Measures, which are relativelypostulate that a relationship between gas concentrations <strong>and</strong> permeable (>4.93 x10 −13 m 2 <strong>in</strong> some seams) <strong>and</strong> generally<strong>the</strong> number <strong>of</strong> nearby CSG wells will emerge if CSG extraction shallow (near surface to
Environmental Science & TechnologyWe deployed 24-h time-series stations to measure atmospheric222 Rn <strong>and</strong> CO 2 at three locations with<strong>in</strong> <strong>the</strong> gas fields<strong>and</strong> two stations outside <strong>of</strong> <strong>the</strong> gas fields (Figure 1). A gas<strong>in</strong>take was positioned at 2 m above <strong>the</strong> ground at each station.The first station (hereafter referred to as North) was adjacentto an open wheat field approximately 3 km north <strong>of</strong> <strong>the</strong> Kenyagas field <strong>and</strong> to <strong>the</strong> east <strong>of</strong> <strong>the</strong> Tal<strong>in</strong>ga gas field. The second sitewas located on a roadside reserve <strong>in</strong> <strong>the</strong> central part <strong>of</strong> <strong>the</strong>Kenya gas field (Central). The third site was located directlysouth <strong>of</strong> a large water hold<strong>in</strong>g pond <strong>in</strong> <strong>the</strong> Kenya gas field(East). The fourth site was located approximately 3 km south <strong>of</strong><strong>the</strong> Kenya gas field (South). The fifth site was locatedapproximately 8 km from <strong>the</strong> sou<strong>the</strong>rn boundary <strong>of</strong> <strong>the</strong> Kenyagas field (Control). For each site, <strong>the</strong> distance to <strong>the</strong> nearestwell <strong>and</strong> <strong>the</strong> number <strong>of</strong> nearby wells are <strong>in</strong>dicated <strong>in</strong> Table 1.Table 1. Position <strong>and</strong> Proximity <strong>of</strong> Sampl<strong>in</strong>g Sites to CSGWell Heads asitenorthcentraleastsouthcontrollat/long26° 53′S,150° 24′E26° 57′S,150° 25′E26° 57′S,150° 28′E27° 1′S,150° 27′E27° 5′S,150° 20′E∼distance tonearest gas well(m)1(km)wells with<strong>in</strong>2(km)3(km)4(km)60 4 15 27 51500 4 17 36 63250 1 9 19 271500 0 2 5 74400 0 0 0 0a The location <strong>of</strong> well heads was obta<strong>in</strong>ed from www.m<strong>in</strong>es.<strong>in</strong>dustry.qld.gov.au/geoscience/<strong>in</strong>teractive-resource-tenure-maps.htm, accessed24 October 2012.Measurements <strong>of</strong> 222 Rn concentrations were performed us<strong>in</strong>ga commercially available cont<strong>in</strong>uous radon-<strong>in</strong>-air monitor(RAD-7, Durridge Company), with two-hour averag<strong>in</strong>g<strong>in</strong>tervals to ensure acceptable count<strong>in</strong>g statistics. CO 2 measurementswere taken us<strong>in</strong>g two nondispersive <strong>in</strong>frared gasanalysers (Li-cor 820) <strong>and</strong> two nondispersive differential gasanalysers (Li-cor 7000) record<strong>in</strong>g at one m<strong>in</strong>ute <strong>in</strong>tervals.Water vapor was removed from air sample streams us<strong>in</strong>g aDrierite column <strong>in</strong>-l<strong>in</strong>e with <strong>the</strong> analysers. All CO 2 analyserswere calibrated us<strong>in</strong>g 0 <strong>and</strong> 502 ± 10 ppm certified referencegases (Coregas Australia). The uncerta<strong>in</strong>ty <strong>of</strong> <strong>in</strong>dividual CO 2detectors was less than 2%, well below <strong>the</strong> natural variability <strong>in</strong><strong>the</strong> region. For CO 2 concentrations at <strong>the</strong> South site <strong>and</strong> <strong>the</strong>f<strong>in</strong>al 12 h at <strong>the</strong> Control site, CO 2 was measured every fourhours us<strong>in</strong>g a cavity r<strong>in</strong>gdown spectrometer (Picarro G2201-iCRDS). The spectrometer calibration was with<strong>in</strong> 10 ppm <strong>of</strong> <strong>the</strong>Li-cor CO 2 analysers. The radon monitors were calibrated by<strong>the</strong> manufacturer (±5%). A cross-calibration check just beforedeployment resulted <strong>in</strong> agreement with<strong>in</strong> <strong>the</strong> calibrationuncerta<strong>in</strong>ty. Automated wea<strong>the</strong>r stations (Davis Vantage Pro)were deployed on six-meter poles at <strong>the</strong> South <strong>and</strong> Controlsites to determ<strong>in</strong>e w<strong>in</strong>d, temperature <strong>and</strong> humidity fluctuations.To compare averages, one-way ANOVA <strong>and</strong> regressionanalyses were done us<strong>in</strong>g SPSS with p values ≤0.05 consideredsignificant.3101■ArticleRESULTS AND DISCUSSIONTime Series Observations. Calm w<strong>in</strong>ds occurred dur<strong>in</strong>gour experiment. Dur<strong>in</strong>g <strong>the</strong> day, w<strong>in</strong>ds were predom<strong>in</strong>antlyfrom <strong>the</strong> NNE <strong>and</strong> averaged ∼1.2 m s −1 . At night, w<strong>in</strong>d speedsapproached zero. Over <strong>the</strong> 24 h period, temperatures rangedfrom 10 to 25 °C. Humidity ranged from 25% dur<strong>in</strong>g <strong>the</strong> day to90% at night. There was no significant difference <strong>in</strong> <strong>the</strong> averageatmospheric pressure dur<strong>in</strong>g <strong>the</strong> day <strong>and</strong> night (1008.5 ± 3.9mbar <strong>and</strong> 1008.9 ± 1.1 mbar respectively).Concentrations <strong>of</strong> 222 Rn <strong>and</strong> CO 2 followed similar diurnalpatterns with lower concentrations dur<strong>in</strong>g daylight hours(Figure 1). CO 2 concentrations varied from day to night byover 60 ppm at <strong>the</strong> Central site <strong>and</strong> by as little as 5 ppm at <strong>the</strong>Control site. Concentrations <strong>of</strong> 222 Rn <strong>in</strong>creased at night by ∼5fold at <strong>the</strong> Central <strong>and</strong> South sites <strong>and</strong> approximately doubledat <strong>the</strong> Control site. This is probably due to <strong>the</strong> formation <strong>of</strong> atemperature <strong>in</strong>version layer at night, trapp<strong>in</strong>g any emissionscloser to <strong>the</strong> surface <strong>and</strong> caus<strong>in</strong>g <strong>the</strong> accumulation <strong>of</strong> gasesreleased from soils or CSG <strong>in</strong>frastructure. The release <strong>of</strong> radonat <strong>the</strong> soil-air <strong>in</strong>terface has been shown to follow a diurnalpattern with variations governed by temperature <strong>and</strong> w<strong>in</strong>dspeeds, 13 which is consistent with our observations. The effects<strong>of</strong> night-time <strong>in</strong>version layers on 222 Rn concentrations has beenpreviously described for non-CSG regions. 14 Lower w<strong>in</strong>dspeeds <strong>and</strong> a lower atmospheric mix<strong>in</strong>g height at night mayallow <strong>the</strong> accumulation <strong>of</strong> soil gas <strong>in</strong> <strong>the</strong> atmosphere. These areimportant considerations for assess<strong>in</strong>g CSG fugitive emissionsas <strong>the</strong> time <strong>of</strong> sampl<strong>in</strong>g could significantly alter <strong>the</strong>concentration <strong>of</strong> gases <strong>in</strong> <strong>the</strong> atmosphere, <strong>and</strong> as such sampl<strong>in</strong>g<strong>of</strong> full 24-h cycles is essential. A dist<strong>in</strong>ct spike <strong>in</strong> CO 2 <strong>and</strong> 222 Rnconcentrations occurred at <strong>the</strong> Central site approximately 13.5to 15 h after <strong>the</strong> start <strong>of</strong> monitor<strong>in</strong>g. This spike correspondedto a dist<strong>in</strong>ct shift <strong>in</strong> w<strong>in</strong>ds from NNE at ∼1.3 m s −1 to easterlyat ∼0.5 m s −1 before return<strong>in</strong>g to a NNE direction.The highest average CO 2 concentration dur<strong>in</strong>g <strong>the</strong> 24-hperiod was measured at <strong>the</strong> Central site (∼468 ppm) while <strong>the</strong>lowest was at <strong>the</strong> Control site (∼391 ppm) (Figure 2). ThereFigure 2. Average CO 2 (a) <strong>and</strong> 222 Rn (b) concentrations ±1 SDatdifferent sampl<strong>in</strong>g sites. The maximum CO 2 (a) <strong>and</strong> 222 Rn (b)concentrations dur<strong>in</strong>g <strong>the</strong> day <strong>and</strong> night are <strong>in</strong>dicated with a solidcircle.dx.doi.org/10.1021/es304538g | Environ. Sci. Technol. 2013, 47, 3099−3104