Enrichment of Radon and Carbon Dioxide in the Open Atmosphere ...
Enrichment of Radon and Carbon Dioxide in the Open Atmosphere ...
Enrichment of Radon and Carbon Dioxide in the Open Atmosphere ...

You also want an ePaper? Increase the reach of your titles
YUMPU automatically turns print PDFs into web optimized ePapers that Google loves.
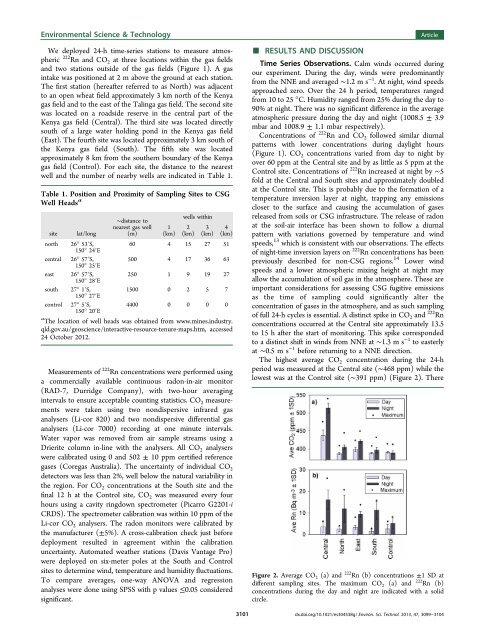
Environmental Science & TechnologyWe deployed 24-h time-series stations to measure atmospheric222 Rn <strong>and</strong> CO 2 at three locations with<strong>in</strong> <strong>the</strong> gas fields<strong>and</strong> two stations outside <strong>of</strong> <strong>the</strong> gas fields (Figure 1). A gas<strong>in</strong>take was positioned at 2 m above <strong>the</strong> ground at each station.The first station (hereafter referred to as North) was adjacentto an open wheat field approximately 3 km north <strong>of</strong> <strong>the</strong> Kenyagas field <strong>and</strong> to <strong>the</strong> east <strong>of</strong> <strong>the</strong> Tal<strong>in</strong>ga gas field. The second sitewas located on a roadside reserve <strong>in</strong> <strong>the</strong> central part <strong>of</strong> <strong>the</strong>Kenya gas field (Central). The third site was located directlysouth <strong>of</strong> a large water hold<strong>in</strong>g pond <strong>in</strong> <strong>the</strong> Kenya gas field(East). The fourth site was located approximately 3 km south <strong>of</strong><strong>the</strong> Kenya gas field (South). The fifth site was locatedapproximately 8 km from <strong>the</strong> sou<strong>the</strong>rn boundary <strong>of</strong> <strong>the</strong> Kenyagas field (Control). For each site, <strong>the</strong> distance to <strong>the</strong> nearestwell <strong>and</strong> <strong>the</strong> number <strong>of</strong> nearby wells are <strong>in</strong>dicated <strong>in</strong> Table 1.Table 1. Position <strong>and</strong> Proximity <strong>of</strong> Sampl<strong>in</strong>g Sites to CSGWell Heads asitenorthcentraleastsouthcontrollat/long26° 53′S,150° 24′E26° 57′S,150° 25′E26° 57′S,150° 28′E27° 1′S,150° 27′E27° 5′S,150° 20′E∼distance tonearest gas well(m)1(km)wells with<strong>in</strong>2(km)3(km)4(km)60 4 15 27 51500 4 17 36 63250 1 9 19 271500 0 2 5 74400 0 0 0 0a The location <strong>of</strong> well heads was obta<strong>in</strong>ed from www.m<strong>in</strong>es.<strong>in</strong>dustry.qld.gov.au/geoscience/<strong>in</strong>teractive-resource-tenure-maps.htm, accessed24 October 2012.Measurements <strong>of</strong> 222 Rn concentrations were performed us<strong>in</strong>ga commercially available cont<strong>in</strong>uous radon-<strong>in</strong>-air monitor(RAD-7, Durridge Company), with two-hour averag<strong>in</strong>g<strong>in</strong>tervals to ensure acceptable count<strong>in</strong>g statistics. CO 2 measurementswere taken us<strong>in</strong>g two nondispersive <strong>in</strong>frared gasanalysers (Li-cor 820) <strong>and</strong> two nondispersive differential gasanalysers (Li-cor 7000) record<strong>in</strong>g at one m<strong>in</strong>ute <strong>in</strong>tervals.Water vapor was removed from air sample streams us<strong>in</strong>g aDrierite column <strong>in</strong>-l<strong>in</strong>e with <strong>the</strong> analysers. All CO 2 analyserswere calibrated us<strong>in</strong>g 0 <strong>and</strong> 502 ± 10 ppm certified referencegases (Coregas Australia). The uncerta<strong>in</strong>ty <strong>of</strong> <strong>in</strong>dividual CO 2detectors was less than 2%, well below <strong>the</strong> natural variability <strong>in</strong><strong>the</strong> region. For CO 2 concentrations at <strong>the</strong> South site <strong>and</strong> <strong>the</strong>f<strong>in</strong>al 12 h at <strong>the</strong> Control site, CO 2 was measured every fourhours us<strong>in</strong>g a cavity r<strong>in</strong>gdown spectrometer (Picarro G2201-iCRDS). The spectrometer calibration was with<strong>in</strong> 10 ppm <strong>of</strong> <strong>the</strong>Li-cor CO 2 analysers. The radon monitors were calibrated by<strong>the</strong> manufacturer (±5%). A cross-calibration check just beforedeployment resulted <strong>in</strong> agreement with<strong>in</strong> <strong>the</strong> calibrationuncerta<strong>in</strong>ty. Automated wea<strong>the</strong>r stations (Davis Vantage Pro)were deployed on six-meter poles at <strong>the</strong> South <strong>and</strong> Controlsites to determ<strong>in</strong>e w<strong>in</strong>d, temperature <strong>and</strong> humidity fluctuations.To compare averages, one-way ANOVA <strong>and</strong> regressionanalyses were done us<strong>in</strong>g SPSS with p values ≤0.05 consideredsignificant.3101■ArticleRESULTS AND DISCUSSIONTime Series Observations. Calm w<strong>in</strong>ds occurred dur<strong>in</strong>gour experiment. Dur<strong>in</strong>g <strong>the</strong> day, w<strong>in</strong>ds were predom<strong>in</strong>antlyfrom <strong>the</strong> NNE <strong>and</strong> averaged ∼1.2 m s −1 . At night, w<strong>in</strong>d speedsapproached zero. Over <strong>the</strong> 24 h period, temperatures rangedfrom 10 to 25 °C. Humidity ranged from 25% dur<strong>in</strong>g <strong>the</strong> day to90% at night. There was no significant difference <strong>in</strong> <strong>the</strong> averageatmospheric pressure dur<strong>in</strong>g <strong>the</strong> day <strong>and</strong> night (1008.5 ± 3.9mbar <strong>and</strong> 1008.9 ± 1.1 mbar respectively).Concentrations <strong>of</strong> 222 Rn <strong>and</strong> CO 2 followed similar diurnalpatterns with lower concentrations dur<strong>in</strong>g daylight hours(Figure 1). CO 2 concentrations varied from day to night byover 60 ppm at <strong>the</strong> Central site <strong>and</strong> by as little as 5 ppm at <strong>the</strong>Control site. Concentrations <strong>of</strong> 222 Rn <strong>in</strong>creased at night by ∼5fold at <strong>the</strong> Central <strong>and</strong> South sites <strong>and</strong> approximately doubledat <strong>the</strong> Control site. This is probably due to <strong>the</strong> formation <strong>of</strong> atemperature <strong>in</strong>version layer at night, trapp<strong>in</strong>g any emissionscloser to <strong>the</strong> surface <strong>and</strong> caus<strong>in</strong>g <strong>the</strong> accumulation <strong>of</strong> gasesreleased from soils or CSG <strong>in</strong>frastructure. The release <strong>of</strong> radonat <strong>the</strong> soil-air <strong>in</strong>terface has been shown to follow a diurnalpattern with variations governed by temperature <strong>and</strong> w<strong>in</strong>dspeeds, 13 which is consistent with our observations. The effects<strong>of</strong> night-time <strong>in</strong>version layers on 222 Rn concentrations has beenpreviously described for non-CSG regions. 14 Lower w<strong>in</strong>dspeeds <strong>and</strong> a lower atmospheric mix<strong>in</strong>g height at night mayallow <strong>the</strong> accumulation <strong>of</strong> soil gas <strong>in</strong> <strong>the</strong> atmosphere. These areimportant considerations for assess<strong>in</strong>g CSG fugitive emissionsas <strong>the</strong> time <strong>of</strong> sampl<strong>in</strong>g could significantly alter <strong>the</strong>concentration <strong>of</strong> gases <strong>in</strong> <strong>the</strong> atmosphere, <strong>and</strong> as such sampl<strong>in</strong>g<strong>of</strong> full 24-h cycles is essential. A dist<strong>in</strong>ct spike <strong>in</strong> CO 2 <strong>and</strong> 222 Rnconcentrations occurred at <strong>the</strong> Central site approximately 13.5to 15 h after <strong>the</strong> start <strong>of</strong> monitor<strong>in</strong>g. This spike correspondedto a dist<strong>in</strong>ct shift <strong>in</strong> w<strong>in</strong>ds from NNE at ∼1.3 m s −1 to easterlyat ∼0.5 m s −1 before return<strong>in</strong>g to a NNE direction.The highest average CO 2 concentration dur<strong>in</strong>g <strong>the</strong> 24-hperiod was measured at <strong>the</strong> Central site (∼468 ppm) while <strong>the</strong>lowest was at <strong>the</strong> Control site (∼391 ppm) (Figure 2). ThereFigure 2. Average CO 2 (a) <strong>and</strong> 222 Rn (b) concentrations ±1 SDatdifferent sampl<strong>in</strong>g sites. The maximum CO 2 (a) <strong>and</strong> 222 Rn (b)concentrations dur<strong>in</strong>g <strong>the</strong> day <strong>and</strong> night are <strong>in</strong>dicated with a solidcircle.dx.doi.org/10.1021/es304538g | Environ. Sci. Technol. 2013, 47, 3099−3104