Environmental Science & Technologywere significantly higher night-time average CO 2 concentrationsat sites with<strong>in</strong> <strong>the</strong> gas field (North, Central <strong>and</strong> East)(p < 0.01) than at sites outside (South <strong>and</strong> Control), while <strong>the</strong>Central <strong>and</strong> East sites had significantly higher CO 2 concentrationsdur<strong>in</strong>g <strong>the</strong> day compared to <strong>the</strong> o<strong>the</strong>r sites (p < 0.01).The only significant difference <strong>in</strong> 222 Rn concentrations betweensites occurred at night between <strong>the</strong> Central site <strong>and</strong> <strong>the</strong> Controlsite (p = 0.04). This was caused by <strong>the</strong> relatively large st<strong>and</strong>arddeviations due to <strong>the</strong> steady <strong>in</strong>crease <strong>in</strong> 222 Rn concentrationsdur<strong>in</strong>g <strong>the</strong> night coupled with <strong>the</strong> long averag<strong>in</strong>g times used (2h).Correlations between Gas Concentrations <strong>and</strong> Number<strong>of</strong> CSG Wells. There was a significant relationshipbetween <strong>the</strong> number <strong>of</strong> wells with<strong>in</strong> 3 km <strong>of</strong> sampl<strong>in</strong>g sites <strong>and</strong><strong>the</strong> maximum radon concentration over <strong>the</strong> 24 h period (r 2 =0.81, p = 0.04) (Figure 3a). If we use <strong>the</strong> average radonFigure 3. Regression plots <strong>of</strong> <strong>the</strong> number <strong>of</strong> CSG wells with<strong>in</strong> 3 km <strong>of</strong>study sites <strong>and</strong> maximum 222 Rn (a), average 222 Rn (b), maximum CO 2(c), <strong>and</strong> average CO 2 (d) concentrations. Control (Co), South (S),East (E), North (N), <strong>and</strong> Central (Ce) study sites are <strong>in</strong>dicated.concentration, <strong>the</strong>n <strong>the</strong> r 2 value is higher (r 2 = 0.87, p = 0.02)(Figure 3b). It is difficult to estimate <strong>the</strong> exact area <strong>in</strong>fluenc<strong>in</strong>ggas concentrations at each station. If we use <strong>the</strong> number <strong>of</strong>wells with<strong>in</strong> 1 km, <strong>the</strong>n <strong>the</strong> correlations illustrated <strong>in</strong> Figure 3aare weaker (r 2 = 0.74, p = 0.06), while if we use <strong>the</strong> number <strong>of</strong>wells with<strong>in</strong> 4 km <strong>of</strong> each monitor<strong>in</strong>g station, <strong>the</strong> correlationsare similar but slightly lower (r 2 = 0.83, p = 0.03). There was nosignificant relationship between <strong>the</strong> number <strong>of</strong> wells at 3 km<strong>and</strong> <strong>the</strong> average day (r 2 = 0.30, p = 0.34) <strong>and</strong> average night (r 2 =0.65, p = 0.10) 222 Rn concentrations largely due to <strong>the</strong> 222 Rnconcentrations at <strong>the</strong> south site be<strong>in</strong>g comparably low dur<strong>in</strong>g<strong>the</strong> day (1.48 ± 1.07 bq m −3 ) <strong>and</strong> high at night (11.21 ± 4.17bq m −3 ).There was a positive, but statistically nonsignificant relationshipbetween <strong>the</strong> number <strong>of</strong> wells with<strong>in</strong> 3 km <strong>of</strong> sampl<strong>in</strong>gstations <strong>and</strong> <strong>the</strong> maximum CO 2 concentration at each station(r 2 = 0.72, p = 0.07) (Figure 3c). A weaker (but still positive)correlation was found when <strong>the</strong> average CO 2 concentration ateach site was used (r 2 = 0.56, p = 0.14) (Figure 3d). TheCentral site, which had <strong>the</strong> highest CO 2 concentrations, waslocated approximately 30 m from a service road <strong>in</strong> <strong>the</strong> centralpart <strong>of</strong> <strong>the</strong> Kenya gas field (Central). No short-term CO 2 spikessimilar to what would be expected from pass<strong>in</strong>g vehicles wasobserved. The relatively low concentrations <strong>of</strong> CO 2 at <strong>the</strong>ArticleNorth site may be partially due to <strong>the</strong> location <strong>of</strong> <strong>the</strong> station <strong>in</strong>relation to <strong>the</strong> prevail<strong>in</strong>g w<strong>in</strong>d direction. The North site had amuch smaller number <strong>of</strong> wells upw<strong>in</strong>d compared to <strong>the</strong> Centralsite. However, similar patterns <strong>of</strong> low 222 Rn concentrations at<strong>the</strong> North site were not observed. The diurnal variations <strong>in</strong>CO 2 concentrations was likely driven by ecosystem metabolism,lead<strong>in</strong>g to a reduction <strong>in</strong> CO 2 through plant uptake dur<strong>in</strong>g <strong>the</strong>day <strong>and</strong> an <strong>in</strong>crease <strong>in</strong> CO 2 at night due to respiration. Therelatively higher background CO 2 concentration <strong>in</strong> <strong>the</strong>atmosphere associated with a longer residence time thanradon may also have prevented stronger correlations fromemerg<strong>in</strong>g as a larger source could be needed to significantlyalter CO 2 concentrations <strong>in</strong> <strong>the</strong> atmosphere. CO 2 is only asmall fraction (98% <strong>of</strong> Walloon CoalCSG 16 ) may be oxidized to CO 2 , <strong>and</strong> account for <strong>the</strong> generaltrend observed. For example CH 4 oxidation rates, <strong>and</strong> firstorderrate constants, <strong>of</strong> 45 g m −2 d −1 <strong>and</strong> −2.37 h −1respectively have been reported for CH 4 -rich l<strong>and</strong>fill soils. 17In contrast to CO 2 , uptake <strong>and</strong> release <strong>of</strong> atmospheric 222 Rnby vegetation can be considered negligible due to its lowreactivity as a noble gas as supported by experiments withplants grow<strong>in</strong>g <strong>in</strong> soils conta<strong>in</strong><strong>in</strong>g high uranium concentrations.18 This, along with <strong>the</strong> nearly constant production <strong>of</strong>222 Rn <strong>in</strong> soils <strong>and</strong> short residence time (several days) makes222 Rn an excellent tracer <strong>of</strong> physical processes that drive soil gasexchange. <strong>Radon</strong> has been extensively used to assess gasexchange <strong>in</strong> conventional coal m<strong>in</strong>es 19,20 <strong>and</strong> soils. 21 In <strong>the</strong>open atmosphere, 222 Rn has been used <strong>in</strong> conjunction with14 CO 2 to quantify CO 2 emissions from fossil fuels <strong>in</strong> Europe. 6,22However, <strong>the</strong> present study is <strong>the</strong> first to use 222 Rnconcentrations to assess potential emissions from a CSGproduction field.Conceptual Model. We hypo<strong>the</strong>size that <strong>the</strong> highconcentrations <strong>of</strong> 222 Rn <strong>and</strong> CO 2 measured <strong>in</strong>side a CSGfield dur<strong>in</strong>g this study are derived not only from gas extraction<strong>in</strong>frastructure, but also from <strong>the</strong> depressurization (horizontaldrill<strong>in</strong>g, hydraulic fractur<strong>in</strong>g, groundwater extraction) <strong>of</strong> <strong>the</strong>coal seams which may <strong>in</strong>crease diffuse soil emissions (Figure 4).The changes to subsurface strata <strong>in</strong>fluenc<strong>in</strong>g gas exhalationprocesses before an earthquake may be conceptually similar to<strong>the</strong> changes imposed by CSG extraction. Variation <strong>in</strong> 222 Rnconcentrations <strong>in</strong> groundwater 23 <strong>and</strong> <strong>the</strong> open atmosphere 24has preceded large earthquakes. This is likely due to <strong>in</strong>creasedsubsurface stress which alters sediment pore spaces <strong>and</strong> opensor closes cracks <strong>in</strong> <strong>the</strong> strata which releases 222 Rn. For example,an approximate 5-fold <strong>in</strong>crease <strong>in</strong> atmospheric 222 Rn concentrations<strong>in</strong> <strong>the</strong> five months lead<strong>in</strong>g up to an earthquake wasobserved <strong>in</strong> Kobe, Japan. 8The groundwater level <strong>in</strong> <strong>the</strong> general Tara region is predictedto drop as a result <strong>of</strong> CSG extraction 12 <strong>and</strong> has been reportedto drop by approximately 100 m <strong>in</strong> certa<strong>in</strong> locations s<strong>in</strong>ce <strong>the</strong>commencement <strong>of</strong> widespread CSG m<strong>in</strong><strong>in</strong>g. 25 This would<strong>in</strong>crease <strong>the</strong> unsaturated soil volume, which may <strong>in</strong>crease gasexchange with <strong>the</strong> atmosphere. The depressurization <strong>of</strong> aquiferscan change <strong>the</strong> geological structure <strong>of</strong> <strong>the</strong> soil pr<strong>of</strong>ile <strong>and</strong> createcracks <strong>and</strong> fissures that may enhance gas exchange. Maximumhydraulic fracture heights <strong>of</strong> ∼588 m have been reported <strong>in</strong>stimulated hydraulic fractures <strong>in</strong> U.S. shales, 26 however no data3102dx.doi.org/10.1021/es304538g | Environ. Sci. Technol. 2013, 47, 3099−3104
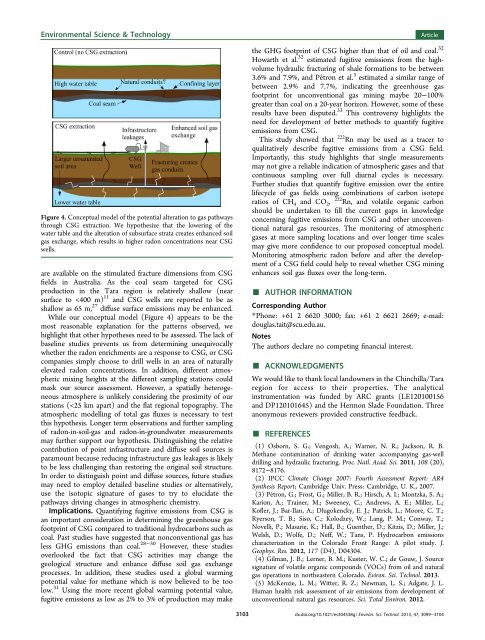
Environmental Science & TechnologyArticleFigure 4. Conceptual model <strong>of</strong> <strong>the</strong> potential alteration to gas pathwaysthrough CSG extraction. We hypo<strong>the</strong>size that <strong>the</strong> lower<strong>in</strong>g <strong>of</strong> <strong>the</strong>water table <strong>and</strong> <strong>the</strong> alteration <strong>of</strong> subsurface strata creates enhanced soilgas exchange, which results <strong>in</strong> higher radon concentrations near CSGwells.are available on <strong>the</strong> stimulated fracture dimensions from CSGfields <strong>in</strong> Australia. As <strong>the</strong> coal seam targeted for CSGproduction <strong>in</strong> <strong>the</strong> Tara region is relatively shallow (nearsurface to