The Great Oyster Mystery Teacher Guide - Estuaries NOAA
The Great Oyster Mystery Teacher Guide - Estuaries NOAA
The Great Oyster Mystery Teacher Guide - Estuaries NOAA

You also want an ePaper? Increase the reach of your titles
YUMPU automatically turns print PDFs into web optimized ePapers that Google loves.
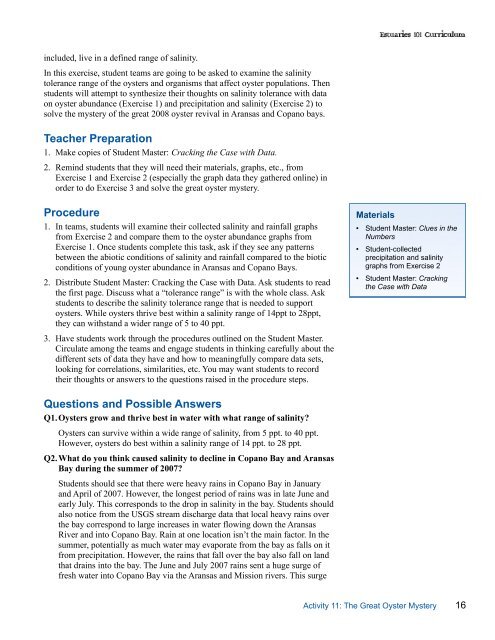
included, live in a defined range of salinity.In this exercise, student teams are going to be asked to examine the salinitytolerance range of the oysters and organisms that affect oyster populations. <strong>The</strong>nstudents will attempt to synthesize their thoughts on salinity tolerance with dataon oyster abundance (Exercise 1) and precipitation and salinity (Exercise 2) tosolve the mystery of the great 2008 oyster revival in Aransas and Copano bays.<strong>Teacher</strong> Preparation1. Make copies of Student Master: Cracking the Case with Data.2. Remind students that they will need their materials, graphs, etc., fromExercise 1 and Exercise 2 (especially the graph data they gathered online) inorder to do Exercise 3 and solve the great oyster mystery.Procedure1. In teams, students will examine their collected salinity and rainfall graphsfrom Exercise 2 and compare them to the oyster abundance graphs fromExercise 1. Once students complete this task, ask if they see any patternsbetween the abiotic conditions of salinity and rainfall compared to the bioticconditions of young oyster abundance in Aransas and Copano Bays.2. Distribute Student Master: Cracking the Case with Data. Ask students to readthe first page. Discuss what a “tolerance range” is with the whole class. Askstudents to describe the salinity tolerance range that is needed to supportoysters. While oysters thrive best within a salinity range of 14ppt to 28ppt,they can withstand a wider range of 5 to 40 ppt.3. Have students work through the procedures outlined on the Student Master.Circulate among the teams and engage students in thinking carefully about thedifferent sets of data they have and how to meaningfully compare data sets,looking for correlations, similarities, etc. You may want students to recordtheir thoughts or answers to the questions raised in the procedure steps.Materials• Student Master: Clues in theNumbers• Student-collectedprecipitation and salinitygraphs from Exercise 2• Student Master: Crackingthe Case with DataQuestions and Possible AnswersQ1.<strong>Oyster</strong>s grow and thrive best in water with what range of salinity?<strong>Oyster</strong>s can survive within a wide range of salinity, from 5 ppt. to 40 ppt.However, oysters do best within a salinity range of 14 ppt. to 28 ppt.Q2.What do you think caused salinity to decline in Copano Bay and AransasBay during the summer of 2007?Students should see that there were heavy rains in Copano Bay in Januaryand April of 2007. However, the longest period of rains was in late June andearly July. This corresponds to the drop in salinity in the bay. Students shouldalso notice from the USGS stream discharge data that local heavy rains overthe bay correspond to large increases in water flowing down the AransasRiver and into Copano Bay. Rain at one location isn’t the main factor. In thesummer, potentially as much water may evaporate from the bay as falls on itfrom precipitation. However, the rains that fall over the bay also fall on landthat drains into the bay. <strong>The</strong> June and July 2007 rains sent a huge surge offresh water into Copano Bay via the Aransas and Mission rivers. This surgeActivity 11: <strong>The</strong> <strong>Great</strong> <strong>Oyster</strong> <strong>Mystery</strong> 16