The Great Oyster Mystery Teacher Guide - Estuaries NOAA
The Great Oyster Mystery Teacher Guide - Estuaries NOAA
The Great Oyster Mystery Teacher Guide - Estuaries NOAA
Create successful ePaper yourself
Turn your PDF publications into a flip-book with our unique Google optimized e-Paper software.
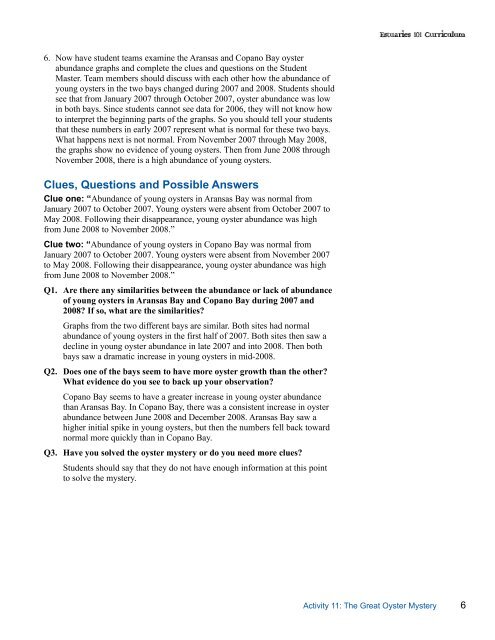
6. Now have student teams examine the Aransas and Copano Bay oysterabundance graphs and complete the clues and questions on the StudentMaster. Team members should discuss with each other how the abundance ofyoung oysters in the two bays changed during 2007 and 2008. Students shouldsee that from January 2007 through October 2007, oyster abundance was lowin both bays. Since students cannot see data for 2006, they will not know howto interpret the beginning parts of the graphs. So you should tell your studentsthat these numbers in early 2007 represent what is normal for these two bays.What happens next is not normal. From November 2007 through May 2008,the graphs show no evidence of young oysters. <strong>The</strong>n from June 2008 throughNovember 2008, there is a high abundance of young oysters.Clues, Questions and Possible AnswersClue one: “Abundance of young oysters in Aransas Bay was normal fromJanuary 2007 to October 2007. Young oysters were absent from October 2007 toMay 2008. Following their disappearance, young oyster abundance was highfrom June 2008 to November 2008.”Clue two: “Abundance of young oysters in Copano Bay was normal fromJanuary 2007 to October 2007. Young oysters were absent from November 2007to May 2008. Following their disappearance, young oyster abundance was highfrom June 2008 to November 2008.”Q1. Are there any similarities between the abundance or lack of abundanceof young oysters in Aransas Bay and Copano Bay during 2007 and2008? If so, what are the similarities?Graphs from the two different bays are similar. Both sites had normalabundance of young oysters in the first half of 2007. Both sites then saw adecline in young oyster abundance in late 2007 and into 2008. <strong>The</strong>n bothbays saw a dramatic increase in young oysters in mid-2008.Q2. Does one of the bays seem to have more oyster growth than the other?What evidence do you see to back up your observation?Copano Bay seems to have a greater increase in young oyster abundancethan Aransas Bay. In Copano Bay, there was a consistent increase in oysterabundance between June 2008 and December 2008. Aransas Bay saw ahigher initial spike in young oysters, but then the numbers fell back towardnormal more quickly than in Copano Bay.Q3. Have you solved the oyster mystery or do you need more clues?Students should say that they do not have enough information at this pointto solve the mystery.Activity 11: <strong>The</strong> <strong>Great</strong> <strong>Oyster</strong> <strong>Mystery</strong> 6


