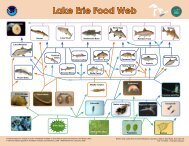
The Great Oyster Mystery Teacher Guide - Estuaries NOAA
The Great Oyster Mystery Teacher Guide - Estuaries NOAA
The Great Oyster Mystery Teacher Guide - Estuaries NOAA

You also want an ePaper? Increase the reach of your titles
YUMPU automatically turns print PDFs into web optimized ePapers that Google loves.
T E A C H E R G U I D E<strong>The</strong> <strong>Great</strong> <strong>Oyster</strong> <strong>Mystery</strong>Research QuestionHow is ongoing research and monitoring of oysters increasing our understandingof estuaries?Content ObjectivesStudents will understand that:• Environmental conditions, such as salinity, have a direct influence on estuaryorganisms.• Testing hypotheses through scientific investigation helps answer questionsabout the natural world.ExercisesExercise 1: Clues in the NumbersStudents read oyster abundance graphs to describe how young oyster abundancein Aransas and Copano bays changed over time.Exercise 2: A Salty Tale of IntrigueStudents access and print monthly average salinity and rainfall data for a twoyearperiod during which oyster abundance in Aransas and Copano bays declinedand then rebounded.Exercise 3: Cracking the Case with DataStudents describe and interpret the relationship between several abiotic and bioticconditions in the estuary, including salinity, rainfall, oyster abundance, and theabundance of parasites and predators that attack oysters.Assessment QuestionsAssessment questions based on content covered in <strong>The</strong> <strong>Great</strong> <strong>Oyster</strong> <strong>Mystery</strong> canbe downloaded on the web page for this activity in the Middle SchoolCurriculum section of the Estuary Education website at estuaries.noaa.gov.Activity 11: <strong>The</strong> <strong>Great</strong> <strong>Oyster</strong> <strong>Mystery</strong> 2
VocabularyAbiotic – the nonliving, physical components of the environment. Some abioticcomponents that impact oysters include salinity, temperature, and dissolvedoxygen level.Abundance – how much of something that can be found in a particular place.Example: <strong>The</strong> abundance of people is high in New York City.Biotic – a component of the environment that is or was once alive. Some bioticcomponents that impact oysters include predators, such as the oyster drill andstone crab.Dermo – a parasite that infects and kills oysters.Hypothesis – a prediction or statement that can be tested and that is based onprior knowledge, new information, and / or observation.Predator – an organism that preys on (hunts, kills, and eats) other organisms.<strong>Oyster</strong> drills and stone crabs are predators that eat oysters.ppt – means parts per thousand.Range – all that is found between the upper and lower limits. All living thingshave a range of conditions in which they thrive. <strong>Oyster</strong>s, for instance, thrive bestwithin a salinity range of 14 ppt. to 28 ppt.Salinity – a measure of the amount of salt in solution. <strong>The</strong> salinity of the oceanis about 35 ppt.AcknowledgementWe thank Dr. Jennifer Pollack, Assistant Professor at Texas A&M University -Corpus Christi, for providing the data for this activity. Dr. Pollack and hercolleagues published the results of their oyster research in a paper entitled, “Roleof Flood Disturbance in Natural <strong>Oyster</strong> (Crassostrea virginica) PopulationMaintenance in an Estuary in South Texas, USA.” This publication may beaccessed online:http://tamucc.academia.edu/JenniferPollack/Papers/314707/Role_of_Flood_Disturbance_in_Natural_<strong>Oyster</strong>_Crassostrea_virginica_Population_Maintenance_in_an_Estuary_in_South_Texas_USAActivity 11: <strong>The</strong> <strong>Great</strong> <strong>Oyster</strong> <strong>Mystery</strong> 3
E X E R C I S E 1Clues in the NumbersEstuary ConceptEnvironmental conditions have a direct influence on estuary organisms, such asoysters.Focus QuestionHow did young oyster abundance change during 2007 and 2008 in the Aransasand Copano bays?Performance TasksStudents will:• Observe oyster abundance graphs from two locations and describe how youngoyster abundance in those bays changed over time.<strong>Teacher</strong> BackgroundBecause the activity is presented to students as a mystery, do not reveal the causeof the oyster decline and rebound described next.Over a two-year period, researchers examined the effects of flood disturbance onthe eastern oyster in the Mission-Aransas Estuary of south Texas. Researcherscollected oyster samples each month from 2007 through 2008. During July 2007,El Niño related storms sent large amounts of fresh water into Copano Bay andAransas Bay via the Aransas and Mission rivers. Researchers found that these2007 fresh water surges caused short-term reductions of salinity in the estuary,which in turn resulted in lower oyster abundance. However, in just one year, theoyster population recovered beyond the pre-flood level. <strong>The</strong> researchersconcluded that although oyster abundance decreased dramatically after thefloods, the retention of freshwater in the estuary resulted in salinity levels thatwere too low to support large populations of predators and disease causingparasites. <strong>The</strong> reduction in parasites and diseases allowed the oyster population torebound beyond pre-flood levels. Other researchers suggest that oysters respondto some disease-causing parasites by attempting to “outrun” the parasites byreproducing at a faster rate.OverviewIn this activity, students areasked to solve an “<strong>Oyster</strong><strong>Mystery</strong>.” As they complete thethree exercises in this activity,students will learn thatenvironmental conditions havea direct influence on estuarineorganisms because an estuaryis a system. A change in onecomponent of that system canhave repercussions on othercomponents and in the way thewhole system works.In Exercise 1, students will lookat maps and graphs of realscientific data to describe anevent that happened in Texas ina valuable oyster-growing area,where a decline and then anincrease of oysters took placein a very short period of time.Students are challenged todiscover what caused theoysters to disappear and thendramatically reappear the nextyear.Time requiredOne 45-minute class periodActivity 11: <strong>The</strong> <strong>Great</strong> <strong>Oyster</strong> <strong>Mystery</strong> 4
<strong>Teacher</strong> Preparation1. Download and view the presentation <strong>Oyster</strong> Recycling (available as a PDFdocument), on the web page for this activity.2. Download the image of the Mission-Aransas Estuary found on the web pagefor this activity.3. Copy Student Master: Clues in the Numbers, including the <strong>Oyster</strong> AbundanceGraphs.Procedures1. Show your students the presentation slideshow, <strong>Oyster</strong> Recycling, which youdownloaded from the web page for this activity on the Estuary Educationwebsite. This slideshow describes reasons why oysters are an importantestuary species and discusses threats to the oysters from both humans andother sources.2. Project the image of the Mission-Aransas Estuary found on the web page forthis activity. Point out the locations of Aransas Bay and Copano Bay withinthe Mission-Aransas Estuary. Also point out the locations where the Aransasand Mission rivers enter Copano Bay. Tell students that they are going tosolve a real life oyster mystery that happened several years ago in this estuary.Tell your students that the oyster population of both Aransas Bay and CopanoBay fell in 2007. Researchers and oyster farmers were worried. But in 2008,the oyster population rebounded significantly. Estuary researchers wanted toknow why this happened. Tell the students that Dr. Jennifer Pollack and herfellow researchers are asking them to join the hunt for answers. Your students’challenge is to try and solve this real-life oyster mystery and to suggestreasons why the oyster populations changed, using real data.3. Divide your students into teams of two to four students each. Students willwork in the same teams for all three exercises in this activity. Distributecopies of Student Master: Clues in the Numbers. This Master includes Young<strong>Oyster</strong> Abundance Graphs for both Aransas Bay and Copano Bay.4. Using the PDF file containing the Exercise 1 Masters, project the images ofthe young oyster abundance graphs from Aransas and Copano bays on ascreen. Review with your students how to read the bar graphs. Tell studentsthat the purpose of these graphs is to show changes in the numbers of youngoysters over time. Ask students if they can find the time period on the graph.Students should see that the horizontal axis of both graphs goes from January2007 to December 2008.5. Ask the students what they think the numbers on the vertical axis indicate.Based on the graphs, do they think the numbers represent all oysters or justyoung oysters? Do the numbers represent all young oysters in the entire bayor just an average of how many young oysters were found in one area?Student answers will vary. You should tell them that the researcher was onlycounting young oysters and reporting the average numbers found within alimited sample. So the bar graphs show the mean (average) number of youngoysters each month in samples taken from the Aransas and Copano bays.You'll find multimedia and otherresources on the web page forthis activity in the Middle SchoolCurriculum section of theEstuary Education website:http://estuaries.noaa.gov.Materials• Presentation: <strong>Oyster</strong>Recycling• Student Master: Clues in theNumbersActivity 11: <strong>The</strong> <strong>Great</strong> <strong>Oyster</strong> <strong>Mystery</strong> 5
6. Now have student teams examine the Aransas and Copano Bay oysterabundance graphs and complete the clues and questions on the StudentMaster. Team members should discuss with each other how the abundance ofyoung oysters in the two bays changed during 2007 and 2008. Students shouldsee that from January 2007 through October 2007, oyster abundance was lowin both bays. Since students cannot see data for 2006, they will not know howto interpret the beginning parts of the graphs. So you should tell your studentsthat these numbers in early 2007 represent what is normal for these two bays.What happens next is not normal. From November 2007 through May 2008,the graphs show no evidence of young oysters. <strong>The</strong>n from June 2008 throughNovember 2008, there is a high abundance of young oysters.Clues, Questions and Possible AnswersClue one: “Abundance of young oysters in Aransas Bay was normal fromJanuary 2007 to October 2007. Young oysters were absent from October 2007 toMay 2008. Following their disappearance, young oyster abundance was highfrom June 2008 to November 2008.”Clue two: “Abundance of young oysters in Copano Bay was normal fromJanuary 2007 to October 2007. Young oysters were absent from November 2007to May 2008. Following their disappearance, young oyster abundance was highfrom June 2008 to November 2008.”Q1. Are there any similarities between the abundance or lack of abundanceof young oysters in Aransas Bay and Copano Bay during 2007 and2008? If so, what are the similarities?Graphs from the two different bays are similar. Both sites had normalabundance of young oysters in the first half of 2007. Both sites then saw adecline in young oyster abundance in late 2007 and into 2008. <strong>The</strong>n bothbays saw a dramatic increase in young oysters in mid-2008.Q2. Does one of the bays seem to have more oyster growth than the other?What evidence do you see to back up your observation?Copano Bay seems to have a greater increase in young oyster abundancethan Aransas Bay. In Copano Bay, there was a consistent increase in oysterabundance between June 2008 and December 2008. Aransas Bay saw ahigher initial spike in young oysters, but then the numbers fell back towardnormal more quickly than in Copano Bay.Q3. Have you solved the oyster mystery or do you need more clues?Students should say that they do not have enough information at this pointto solve the mystery.Activity 11: <strong>The</strong> <strong>Great</strong> <strong>Oyster</strong> <strong>Mystery</strong> 6
S T U D E N T M A S T E RClues in the Numbers<strong>Oyster</strong>s are a valuable part of estuary ecosystems. <strong>The</strong>y help purify the water and control erosion. <strong>Oyster</strong> reefsprovide habitat for numerous other species. However, oysters can also be an “indicator species.” Like a canary in acoal mine, oyster health and oyster abundance can tell us about changing conditions in an estuary.A few years ago, something odd happened to the oysters in Mission-Aransas Estuary in south Texas, a valuableoyster-growing area. In the first half of 2007, young oyster populations within the estuary’s Copano Bay and AransasBay were normal. But then, the numbers of young oysters mysteriously decreased, only to dramatically increase againthe next year. To Dr. Jennifer Pollack, an oyster researcher at Texas A&M University, this was a real mystery. Nowyou can look at some of the data researchers used to solve the great oyster mystery.Activity 11: <strong>The</strong> <strong>Great</strong> <strong>Oyster</strong> <strong>Mystery</strong> 7
Think of yourself as an armchair sleuth. You must mount a virtual research expedition to Aransas and Copano bays inthe Mission-Aransas Estuary to collect data that will help you answer the following research question:“What caused oysters to decline in 2007 and why did the population rebound so dramatically thefollowing year?”Along the way, you will look at maps and graphs of real scientific data and have the opportunity to gather your owndata online. <strong>The</strong>re’s no rest until you find out what happened! It’s time to get your first clues.Procedure1. In this exercise, you will be using two bar graphs showing the abundance of young oysters in samples taken byresearchers in Aransas Bay and Copano Bay, which are both located within the Mission-Aransas Estuary.2. Look at the Aransas Bay Young <strong>Oyster</strong> Abundance Graph. Decide what the bars on the graph indicate and what thedata tells you about the young oyster abundance in Copano Bay at different times. Use the Aransas Bay Young<strong>Oyster</strong> Abundance Graph to fill in the statement below:Clue one: “Abundance of young oysters in Aransas Bay was normal from January 2007 to October 2007. Youngoysters were absent from _________ (month and year) to _________ (month and year). Following theirdisappearance, young oyster abundance was _________ (high, low, or normal) from _________ to _________(months and year).”3. Now look at the Copano Bay Young <strong>Oyster</strong> Abundance Graph. Use this graph to in the statement below:Clue two: “Abundance of young oysters in Copano Bay was normal from January 2007 to October 2007. Youngoysters were absent from _________ (month and year) to _________ (month and year). Following theirdisappearance, young oyster abundance was _________ (high, low, or normal) from _________ to _________(months and year).”QuestionsQ1. Are there any similarities between the abundance or lack of abundance of young oysters in Aransas Bay andCopano Bay during 2007 and 2008? If so, what are the similarities?Q2. Does one of the bays seem to have more oyster growth than the other? What evidence do you see to back upyour observation?Q3. Have you solved the oyster mystery or do you need more clues?Activity 11: <strong>The</strong> <strong>Great</strong> <strong>Oyster</strong> <strong>Mystery</strong> 8
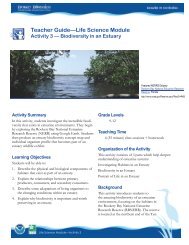
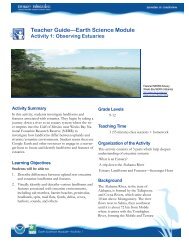
<strong>Oyster</strong> Abundance GraphsActivity 11: <strong>The</strong> <strong>Great</strong> <strong>Oyster</strong> <strong>Mystery</strong> 9
<strong>Oyster</strong> Abundance GraphsNotes on the dataWhat does it mean in the above graph when it says that there were nearly 150 young oysters measured in Copano Bayin June 2008? <strong>The</strong> “young” oysters counted by researchers are the spat — larval oysters that have attached to biggeroysters. Researchers dredged oyster samples from the bottom of the bays. <strong>The</strong>y picked out five oysters from whateverthey dredged up and counted the number of spat on those five oysters. <strong>The</strong> counts were then averaged to give themonthly numbers you’re seeing above. Since the same method was used for the entire period of time, you cancompare months and know that what you see should represent actual increases or decreases in larval oysters in thatbay over time. And because the same sampling method was used in both bays, the numbers can be compared witheach other.Activity 11: <strong>The</strong> <strong>Great</strong> <strong>Oyster</strong> <strong>Mystery</strong> 10
E X E R C I S E 2A Salty Tale of IntrigueEstuary ConceptExplain how the National Estuarine Research Reserve System Wide MonitoringProgram (SWMP) can provide real data for research on abiotic factors that affectoysters, such as salinity and precipitation.Focus QuestionHow can graphs of real data be generated to collect information about salinityand precipitation?Performance TasksStudents will:• Access and print real salinity and rainfall data from a two-year period duringwhich oyster abundance in the Mission-Aransas estuary declined and thenrebounded.<strong>Teacher</strong> BackgroundIn this exercise, students will access real data from the NERRS System wideMonitoring Program (SWMP). SWMP is used to monitor the health of thereserves. It measures changes in estuarine waters to record how human activitiesand natural events affect coastal habitats. Data-collecting instruments are locatedat over 100 data stations (about 4 stations at each reserve).OverviewStudents will access theNERRS System WideMonitoring Program (SWMP)data on the Estuary Educationwebsite to investigate changesin salinity and rainfall patternsthat occurred in Aransas andCopano bays during the studyperiod. Students will need thecollected data from thisexercise to use in Exercise 3,which is the final part of thisactivity.Time RequiredOne 45-minute class periodYou'll find multimedia and otherresources on the web page forthis activity in the Middle SchoolCurriculum section of theEstuary Education website:http://estuaries.noaa.gov.SWMP data stations collect data on a variety of factors. <strong>The</strong>re are stations thatrecord water quality data, including pH, salinity, oxygen saturation, and otherabiotic factors. Other stations record weather data, such as temperature andprecipitation. Still other stations record factors relating to biology, such asdissolved nutrients and concentration of chlorophyll in the water.Your students will be accessing the SWMP data through the online graphing toolon estuaries.noaa.gov. <strong>The</strong>y will create salinity and precipitation graphs to use indetermining why the oyster populations in Copano Bay and Aransas Baydeclined in 2007 and then increased in 2008.<strong>Teacher</strong> Preparation1. Practice accessing and using the graphing function for SWMP data beforeworking with students in Exercise 2. See instructions in Student Master:Clues in the Numbers.2. It is highly recommended that students go online to collect their own salinityand precipitation data. However, if this option is not available to you, you cangenerate a graph of the Water Salinity and the Precipitation Time Series forAransas Bay and Copano Bay ahead of time and have students copy data fromthat.Activity 11: <strong>The</strong> <strong>Great</strong> <strong>Oyster</strong> <strong>Mystery</strong> 11
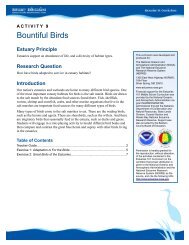
<strong>The</strong> generated graphs should look something like this:Copano Bay SalinityCopano Bay PrecipitationAransas Bay SalinityProcedure1. Have each student team from Exercise 1 use a computer with Internet accessto go online to gather data and create graphs in this exercise.2. Give each student a copy of Student Master: A Salty Tale of Intrigue. Studentswill follow directions on the master to create salinity and precipitation graphsfor data in Aransas and Copano bays for the time interval January 1, 2007 toDecember 31, 2008.3. Circulate among your students and help them with their efforts to use theonline data tool.4. Remind students to keep their graphs and all Masters from Exercises 1 and 2organized and available to use in Exercise 3.MaterialsPer student• Student Master: A Salty Taleof IntriguePer team• Computer with InternetaccessActivity 11: <strong>The</strong> <strong>Great</strong> <strong>Oyster</strong> <strong>Mystery</strong> 12
S T U D E N T M A S T E RA Salty Tale of IntrigueClearly something affected oyster abundance in Aransas and Copano bays during 2007 and 2008. Perhaps it hadsomething to do with the water in the bays. Let’s start by looking at the water’s salinity.In this exercise, you will gather real salinity and precipitation (rainfall) data in both Aransas and Copano bays for2007 and 2008. Could salinity be the smoking gun?Procedure1. Visit estuaries.noaa.gov and click on the “Science & Data” tab near the topof the page.2. Click on “Graphing Tool” in the red bar beneath the “Science & Data” tab.3. <strong>The</strong> graphing tool application will open with a map of the United States.<strong>The</strong> green pins indicate stations gathering water data within estuariesaround the United States.4. Select “TX>> Mission Aransas> >Copano Bay East” from the list ofrecording stations.5. Now you need to select a type of water quality data to graph. Click on the “Add Data” button. A new “ChooseParameters” window will display.6. Under Step 3: Pick Parameter label, use the pull down list to select “Salinity” from the list of available waterquality data parameters gathered at this site.7. Finally, you will need to choose which range of dates to include in your graph. Under Step 4: Pick Date andRange, specify a start date of January 1, 2007 and an end date of December 31, 2008.8. Click on the “Add” button to generate your salinity graph. <strong>The</strong>re may be a delay in seeing your graph.9. Use the minus button below the graph to shrink the graph until you can see the entire date range (January 1,2007 to December 31, 2008) on your graph. (Date labels on the x-axis are for the first of the month. Forexample, 2/08 is February 1, 2008.)10. Right-click inside the graph area and select Print from the popup menu to print your graph. (You may also savethe graph as a PDF file for later use.) Be sure to write in missing number labels on the vertical axis (salinity) ifthey do not print.11. Use a ruler to draw a horizontal line across your graph equivalent to a salinity value of 17 psu. (A psu. is a“practical salinity unit.” One psu. is equal to one part per thousand dissolved solids.) Label the line “20-yearaverage salinity.” Any salinity value below this line is below average for water in Copano Bay over a 20 yearperiod; any value above this line is above average, if we ignore seasonal effects.12. Now you will get the precipitation data for Copano Bay. Beneath the graph, select “Weather.” This will reset thetool and you will see the map of the United States again. <strong>The</strong> blue pins indicate stations gathering weather datawithin estuaries around the United States.13. Select “TX>> Mission Aransas> >Copano East” from the list of recording stations.14. Now you need to select a type of weather data to graph. Click on the “Add Data” button. A new “ChooseParameters” window will display.15. Under Step 3: Pick Parameter label, use the pull down list to select “Precipitation” from the list of availableweather data parameters gathered at this site.16. Under Step 4: Pick Date and Range, be sure that you still have a start date of January 1, 2007 and an end date ofActivity 11: <strong>The</strong> <strong>Great</strong> <strong>Oyster</strong> <strong>Mystery</strong> 13
December 31, 2008.17. Click on the “Add” button to generate your precipitation graph. When you are asked if you want to add the newdata as a second set of labels on your y-axis of your previous graph, select “No” to create a new graph.18. Right-click inside the graph area and select Print from the popup menu to print your graph. You may also savethe graph as a PDF file for later use. Be sure to write in missing number labels on the vertical axis (precipitation)if they do not print.19. Now create a salinity graph for Aransas Bay. Select “Water” data again. Follow Steps 4 through 10 above, exceptthis time choose the “TX>>Mission Aransas>>Aransas Bay” station. Be sure to print or save your graph.20. Use a ruler to draw a horizontal line across your graph equivalent to a salinity value of 20 psu. Label the line“20-year average salinity.” Any salinity value below this line is below average for water in Aransas Bay over a20 year period; any value above this line is above average.21. <strong>The</strong>re is no weather station data in Aransas Bay. You will be using the precipitation graph from Copano Bay Eastas an approximation of data in nearby Aransas Bay.22. Here is one more piece of information that might be related to precipitation in the estuary during 2007 and 2008.This data comes from a United States Geological Survey (USGS) water data collection station on the AransasRiver, near where the river empties into Copano Bay.Stream Discharge Data for Aransas River south of Skidmore, Texas(USGS Station 08189700) Drainage area 247 square milesMonth/Year Monthly average river discharge(cubic feet per second)January 2007 96February 2007 9March 2007 105April 2007 17May 2007 10June 2007 29July 2007 727August 2007 17September 2007 21October 2007 8November 2007 7December 2007 7January 2008 7February 2008 6March 2008 9April 2008 6May 2008 4June 2008 4July 2008 8August 2008 58September 2008 25October 2008 5November 2008 3December 2008 3Source: USGS Surface-Water Monthly Statistics for the Nation23. Save your collected data to analyze in Exercise 3: Cracking the Case with Data.Activity 11: <strong>The</strong> <strong>Great</strong> <strong>Oyster</strong> <strong>Mystery</strong> 14
E X E R C I S E 3Cracking the Case with DataEstuary ConceptA better understanding of estuarine processes can be identified when abiotic andbiotic conditions are examined.Focus Questions• What caused the changes in young oyster abundance during 2007 and 2008 inAransas and Copano bays?Performance TasksStudents will:• Analyze real data to explain variations in water salinity and abundance ofoysters and oyster parasites/predators within Aransas and Copano bays.<strong>Teacher</strong> BackgroundIn order to answer the research question: “What caused the changes in youngoyster abundance during 2007 and 2008 in Aransas and Copano bays?” studentswill need to examine the team-collected salinity and precipitation data fromSWMP. <strong>The</strong>y will also explore the types of enemies that attack oysters. One suchenemy is the single-celled protozoan, Perkinsus marinus, a parasite that causesdermo disease in oysters. Other oyster enemies are the predators, oyster drills andstone crabs.OverviewIn this activity, students areasked to solve an <strong>Oyster</strong><strong>Mystery</strong>. In this last of threeexercises, students are askedto analyze the data they havegathered in the first twoexercises. <strong>The</strong>y are also askedto consider the impact of oysterenemies (parasites andpredators) on oysterpopulations and whether or notthose oyster enemies are alsoaffected by the same abioticfactors (e.g., salinity) as theoysters themselves.Time RequiredTwo 45-minute class periodsFirst, it is important to understand that the oysters live in bays found within theMission-Aransas Estuary. In order to thrive in these locations — and estuaries ingeneral — oysters must live within certain environmental ranges that containupper and lower limits. As an example, oysters thrive best within a salinity rangeof 14 to 28 parts per thousand (ppt.). If oysters are in water outside of this rangeat either end for too long, they will not thrive. At extreme levels outside of thisrange, the oysters will die.Next, it is important to realize that the salinity of the water within the estuarydoes not always stay the same. Salinity is a measure of the amount of dissolvedsalts in water. In the open ocean, salinity varies little. Salinity in an estuary,however, varies according to location, tidal fluctuations, and the volume offreshwater entering the estuary, either via runoff or directly via precipitation.Overall salinity levels in many estuaries decline in the spring, when snowmeltand spring rains produce elevated freshwater flows from streams and groundwater. <strong>The</strong> added fresh water “dilutes” the water in the estuary, lowering salinitylevels. In the Mission-Aransas Estuary, salinity is more likely to be lowered bylarge storms that send enormous surges of fresh water down into the bays via theAransas and Mission rivers.<strong>Oyster</strong>s are not the only organism with a salinity tolerance range. <strong>The</strong> protozoanthat causes dermo disease has a salinity tolerance range. So do the oysterpredators, the oyster drill and the stone crab. All of these organisms, oystersActivity 11: <strong>The</strong> <strong>Great</strong> <strong>Oyster</strong> <strong>Mystery</strong> 15
included, live in a defined range of salinity.In this exercise, student teams are going to be asked to examine the salinitytolerance range of the oysters and organisms that affect oyster populations. <strong>The</strong>nstudents will attempt to synthesize their thoughts on salinity tolerance with dataon oyster abundance (Exercise 1) and precipitation and salinity (Exercise 2) tosolve the mystery of the great 2008 oyster revival in Aransas and Copano bays.<strong>Teacher</strong> Preparation1. Make copies of Student Master: Cracking the Case with Data.2. Remind students that they will need their materials, graphs, etc., fromExercise 1 and Exercise 2 (especially the graph data they gathered online) inorder to do Exercise 3 and solve the great oyster mystery.Procedure1. In teams, students will examine their collected salinity and rainfall graphsfrom Exercise 2 and compare them to the oyster abundance graphs fromExercise 1. Once students complete this task, ask if they see any patternsbetween the abiotic conditions of salinity and rainfall compared to the bioticconditions of young oyster abundance in Aransas and Copano Bays.2. Distribute Student Master: Cracking the Case with Data. Ask students to readthe first page. Discuss what a “tolerance range” is with the whole class. Askstudents to describe the salinity tolerance range that is needed to supportoysters. While oysters thrive best within a salinity range of 14ppt to 28ppt,they can withstand a wider range of 5 to 40 ppt.3. Have students work through the procedures outlined on the Student Master.Circulate among the teams and engage students in thinking carefully about thedifferent sets of data they have and how to meaningfully compare data sets,looking for correlations, similarities, etc. You may want students to recordtheir thoughts or answers to the questions raised in the procedure steps.Materials• Student Master: Clues in theNumbers• Student-collectedprecipitation and salinitygraphs from Exercise 2• Student Master: Crackingthe Case with DataQuestions and Possible AnswersQ1.<strong>Oyster</strong>s grow and thrive best in water with what range of salinity?<strong>Oyster</strong>s can survive within a wide range of salinity, from 5 ppt. to 40 ppt.However, oysters do best within a salinity range of 14 ppt. to 28 ppt.Q2.What do you think caused salinity to decline in Copano Bay and AransasBay during the summer of 2007?Students should see that there were heavy rains in Copano Bay in Januaryand April of 2007. However, the longest period of rains was in late June andearly July. This corresponds to the drop in salinity in the bay. Students shouldalso notice from the USGS stream discharge data that local heavy rains overthe bay correspond to large increases in water flowing down the AransasRiver and into Copano Bay. Rain at one location isn’t the main factor. In thesummer, potentially as much water may evaporate from the bay as falls on itfrom precipitation. However, the rains that fall over the bay also fall on landthat drains into the bay. <strong>The</strong> June and July 2007 rains sent a huge surge offresh water into Copano Bay via the Aransas and Mission rivers. This surgeActivity 11: <strong>The</strong> <strong>Great</strong> <strong>Oyster</strong> <strong>Mystery</strong> 16
of fresh water diluted the salty water in the bay, causing the salinity levels tofall.Q3.What happened to oyster abundance in the two bays when salinitydeclined?Young oyster abundance was low before the salinity declined. However,those were normal low numbers. After the salinity declined, the oysterabundance stayed mostly the same for another two months before falling tolevels approaching zero.Q4.What happened to oyster abundance in the two bays as salinityincreased from fall 2007 and into 2008? Relate your observations tooysters’ salinity tolerance range?At first, there was no change in oyster abundance. Salinity increased steadilyfrom July 2007 until December 2008. <strong>Oyster</strong>s did not reappear until June2008. However, when the young oysters did reappear, their numbers were ata higher level than before the salinity drop. Students may expect to see oysternumbers recover quickly once the water salinity reaches the oyster’stolerance range. However, what they will see in the data is a lag time ofseveral months. This is probably due to the oyster’s reproductive cycle,seasonal spawning events, etc.Q5.If oysters have a lower limit of salinity tolerance than oyster enemies,what would you expect to see in a bay where salinity levels are increasingfrom near zero (almost fresh water) to 20 ppt. or greater? Do you seeevidence of oysters recovering before oyster enemies or vice-versa?As salinity levels increase, the organism with the lowest tolerance level will“feel comfortable” first and start to thrive before the organisms with higherlower limits. In the graph showing percent of market-size oysters infectedwith P. marinus in Copano Bay, it appears the protozoan that causes dermostarted to revive at about the same time as the oyster.Q6.Drawing Conclusions: Use the data you gathered to answer the originalresearch question: “What caused oysters to decline in the Mission-Aransas Estuary in 2007 and why did the population rebound sodramatically the following year?” Describe what you learned andwhether you think you’ve solved the “great oyster mystery.”Major storms in watersheds draining into the estuary caused temporaryreductions in salinity. This decline in salinity is associated with observedreductions in young oyster abundance. <strong>Oyster</strong> populations generallyrecovered within one year’s time as salinity levels increased back within theoyster’s preferred tolerance range. Students may or may not feel they havesolved the mystery. Some questions were answered by the data; somequestions were not answered and would require more research.Activity 11: <strong>The</strong> <strong>Great</strong> <strong>Oyster</strong> <strong>Mystery</strong> 17
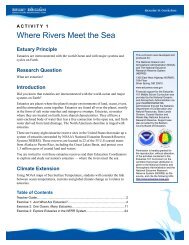
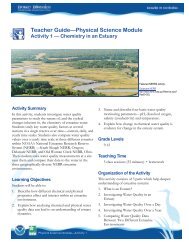
S T U D E N T M A S T E RCracking the Case with DataStone CrabSouthern <strong>Oyster</strong> Drillcredit: Brittany BlombergPerkinsus marinus (causes dermo disease)credit: Dr. David Bushek. Used with permission.<strong>Oyster</strong>What is a Tolerance Range?All living things have a range of abiotic (non-living) environmental conditions in which they can live. For example,you need high quality air to breathe and you couldn’t live in extreme temperatures without adequate shelter. <strong>Oyster</strong>sare also affected by abiotic environmental conditions. For oysters to survive, they need water with specific ranges ofsalinity, temperature, water depth, and water clarity. A range means that there are upper and lower limits. Beyondthose limits in either direction, the oyster will die.Salinity is one of the abiotic conditions affecting oyster growth. Water salinity is measured in parts per thousand(ppt.). A salinity of 1 ppt. means that there is one gram of salts dissolved in 1000 grams of water. <strong>The</strong> average salinityof sea water is 35 ppt. <strong>The</strong> salinity of totally fresh water is close to 0 ppt. <strong>Oyster</strong>s live in estuaries, where fresh waterfrom rivers and streams mixes with salt water from the ocean. In terms of salinity, oysters thrive in areas that have ahigher salinity than a freshwater stream, but a lower salinity than the open ocean.Activity 11: <strong>The</strong> <strong>Great</strong> <strong>Oyster</strong> <strong>Mystery</strong> 18
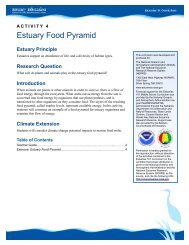
<strong>The</strong> <strong>Oyster</strong>’s Enemies<strong>Oyster</strong>s are able to tolerate lower salinity levels than many of their predators (oyster drills and stone crabs) andparasites (Perkinsus marinus that causes dermo disease). This is important because oysters cannot run away from theirenemies and they have no way to defend themselves, except their protective shells, which oyster drills, stone crabs,and Perkinsus marinus can easily get into. <strong>The</strong> oyster’s tolerance for lower salinity levels means that freshwaterinflow into oyster beds can help oysters thrive because it tends to lower the numbers of oyster predators and parasites.<strong>Oyster</strong>s can survive within a wide range of salinity, from 5 ppt. to 40 ppt, but they do best within the range of 14 ppt.to 28 ppt. <strong>Oyster</strong> drills and stone crabs cannot tolerate salinities less than 15 ppt. for long periods of time andPerkinsus marinus does not tolerate salinities below 8 ppt. <strong>The</strong> table below shows the lower limits of salinitytolerances for oysters, oyster drills, stone crabs, and Perkinsus marinus.Organism<strong>Oyster</strong><strong>Oyster</strong> DrillStone CrabPerkinsus marinus(cause of dermo disease)Lower Limit of Salinity Tolerance5 ppt.15 ppt.15 ppt.8 ppt.Procedure1. Compare the salinity graphs for Copano Bay and Aransas Bay (from Exercise 2) with the young oyster abundancegraphs (from Exercise 1). During what time period were oysters within their preferred tolerance range for salinityin each bay? Is there a relationship between when oysters were in their preferred salinity conditions and whenyoung oysters were abundant?2. Compare the precipitation graph for Copano Bay with the salinity graph for Copano Bay. Also, examine the streamdischarge data for the Aransas River. Are there any clues in the precipitation graph and discharge data that suggestwhy salinity in Copano Bay and Aransas Bay fell so dramatically in July 2007?3. Look at the graph below that shows number of “market-sized” oysters infected with Perkinsus marinus in CopanoBay during 2007 and 2008. Is there a relationship with the salinity graph? Is there a correlation with the youngoyster abundance graph?Activity 11: <strong>The</strong> <strong>Great</strong> <strong>Oyster</strong> <strong>Mystery</strong> 19
4. Use your observations and all of your data to answer the questions below.QuestionsQ1. <strong>Oyster</strong>s grow and thrive best in water with what range of salinity?Q2. What do you think caused salinity to decline in Copano Bay and Aransas Bay during the summer of 2007?Q3. What happened to oyster abundance in the two bays when salinity declined?Q4. What happened to oyster abundance in the two bays as salinity increased from the fall 2007 and into 2008?Relate your observations to oysters’ salinity tolerance range.Q5. If oysters have a lower limit of salinity tolerance than oyster enemies, what would you expect to see in a baywhere salinity levels are increasing from near zero (almost fresh water) to 20 ppt. or greater? Do you seeevidence of oysters recovering before oyster enemies or vice-versa?Q6. Drawing Conclusions: Use the data you gathered to answer the original research question: “What causedoysters to decline in the Mission-Aransas Estuary in 2007 and why did the population rebound sodramatically the following year?” Describe what you learned and whether you think you’ve solved the “greatoyster mystery.”Activity 11: <strong>The</strong> <strong>Great</strong> <strong>Oyster</strong> <strong>Mystery</strong> 20