Teacher GuideâEarth Science Module - Estuaries NOAA
Teacher GuideâEarth Science Module - Estuaries NOAA
Teacher GuideâEarth Science Module - Estuaries NOAA

Create successful ePaper yourself
Turn your PDF publications into a flip-book with our unique Google optimized e-Paper software.
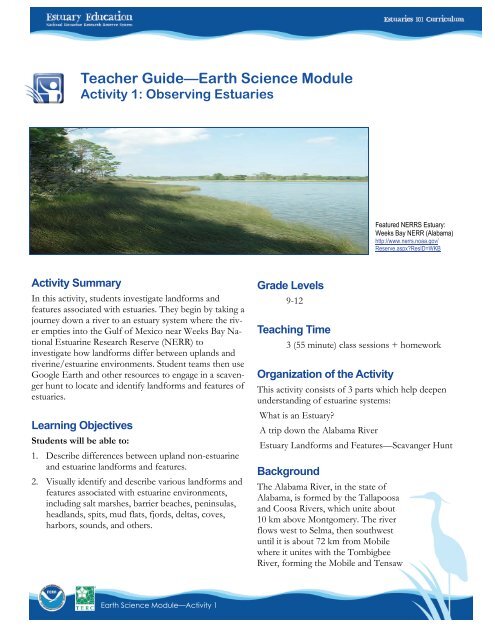
<strong>Teacher</strong> Guide—Earth <strong>Science</strong> <strong>Module</strong>Activity 1: Observing <strong>Estuaries</strong>Featured NERRS Estuary:Weeks Bay NERR (Alabama)http://www.nerrs.noaa.gov/Reserve.aspx?ResID=WKBActivity SummaryIn this activity, students investigate landforms andfeatures associated with estuaries. They begin by taking ajourney down a river to an estuary system where the riverempties into the Gulf of Mexico near Weeks Bay NationalEstuarine Research Reserve (NERR) toinvestigate how landforms differ between uplands andriverine/estuarine environments. Student teams then useGoogle Earth and other resources to engage in a scavengerhunt to locate and identify landforms and features ofestuaries.Learning ObjectivesStudents will be able to:1. Describe differences between upland non-estuarineand estuarine landforms and features.2. Visually identify and describe various landforms andfeatures associated with estuarine environments,including salt marshes, barrier beaches, peninsulas,headlands, spits, mud flats, fjords, deltas, coves,harbors, sounds, and others.Grade Levels9-12Teaching Time3 (55 minute) class sessions + homeworkOrganization of the ActivityThis activity consists of 3 parts which help deepenunderstanding of estuarine systems:What is an Estuary?A trip down the Alabama RiverEstuary Landforms and Features—Scavanger HuntBackgroundThe Alabama River, in the state ofAlabama, is formed by the Tallapoosaand Coosa Rivers, which unite about10 km above Montgomery. The riverflows west to Selma, then southwestuntil it is about 72 km from Mobilewhere it unites with the TombigbeeRiver, forming the Mobile and TensawEarth <strong>Science</strong> <strong>Module</strong>—Activity 1
The river flows west to Selma, then southwest until it isabout 72 km from Mobile where it unites with theTombigbee River, forming the Mobile and TensawRivers. Both rivers discharge into Mobile Bay.The Alabama River meanders a lot. It is 502 km longand varies in width from 200 to 300 m, and its depthranges from 1 to 2 m. The river crosses the richestagricultural and timber districts of the state, and railwaysconnect it with the mineral regions of north centralAlabama.See the PowerPoint Estuary Landforms and Features formore background information on the major landformsand features of estuaries.Download and prepare to present the PowerPointEstuary Landforms and Features.PreparationDownload Google Earth and install it on your classroomcomputer(s) or computer lab machines. To find atutorial for using Google Earth, please check the box onthe next page.Preset the locations of your school and the beginning ofthe Alabama River trip (31 08' 53.46 N, 87 56' 56.46W; altitude 4 km) in Google Earth. Refer to Using GoogleEarth to Explore <strong>Estuaries</strong> for a brief how-to guide. (Seeside-box for instructions on how to access this tutorial.)In Google Earth, choose a starting point for students’Part 3 exploration of a coastal area and determine anaddress or location name to enter that will zoom in onthis starting place. For example, if you want yourstudents to begin exploring the coast of the Gulf ofMexico, a starting location might be Port Isabel, Texas.Or select one of the National Estuarine ResearchReserves for students to investigate.MaterialsBrowse the coastal area that you want your students toexamine and identify potentially confusing borders orareas with only low-resolution imagery available.StudentsNeed to work in a computer lab or with acomputer and projectorCopy of the Student ReadingObserving <strong>Estuaries</strong>Copy of the Student WorksheetObserving <strong>Estuaries</strong>Copy of Student ReadingIntroduction to Weeks Bay NERRCopy of Student Worksheet — Scavenger HuntCopy of Student ReadingUsing Google Earth to Explore <strong>Estuaries</strong>(assuming you have computer access)<strong>Teacher</strong>sDownload Google EarthIf you wish to use hardcopy materials instead ofGoogle Earth, obtain topographic or other typesof maps for students to use in Part 2 of theactivityPowerPoint Estuary Landforms and Features(available on the <strong>Estuaries</strong>.noaa.gov site, clickunder Curriculum, High-School Curriculum, Earth<strong>Science</strong>, and find the presentation underSupporting Materials, Activity 1)Equipment:Computer lab orComputer and ProjectorEarth <strong>Science</strong> <strong>Module</strong>—Activity 12
AlternativesIf you want to use a local river and estuary instead of theAlabama River, produce an alternate river trip for Part 1using Google Earth.If you wish to use hardcopy materials instead of GoogleEarth, obtain topographic or other types of maps forstudents to use in Part 2 of the activity.ProcedurePart 1 — What is an Estuary?1. Begin by asking students what they know aboutestuaries.2. Have students each sketch or describe what it mightlook like where the river meets the ocean. Selectstudents to hold up their diagrams and describe whatthey drew. Emphasize the variety of estuaries andthe fact that different types exist.3. During the discussion, ask the following questionsto get students to think more deeply about theseplaces where fresh water from rivers and streamsrun into ocean water:National <strong>Science</strong> Education StandardsContent Standard A: <strong>Science</strong> as InquiryA3. Use technology and mathematics to improveinvestigations and communications.A4. Formulate and revise scientific explanationsusing logic and evidence.A6. Communicate and defend a scientific argument.Content Standard C: Life <strong>Science</strong>C4. Interdependence of organismsContent Standard E: <strong>Science</strong> and TechnologyE1. Identify a problem or identify an opportunityE6. Understandings about science and technologyContent Standard F: <strong>Science</strong> in Personal andSocial PerspectivesF4. Environmental qualityF5. Natural and human-induced hazardsGoogle EarthThis activity requires the use of Google Earth. Ifstudents have computer access, the use of Google Earth(http://earth.google.com/) can help themdevelop spatial skills.How big are these places?How can you tell where the fresh water endsand ocean water starts? Can you see itclearly, like a waterfall into the sea or is it alittle less obvious, like a hose underwater in aswimming pool?What do you know about where fresh watermeets the ocean? What landforms orfeatures may be present?Find the Tutorial “Using Google Earth to Explore<strong>Estuaries</strong>” in <strong>Estuaries</strong>.noaa.gov, click under Curriculum,and then the sub-tab titled “Tutorials”.Earth <strong>Science</strong> <strong>Module</strong>—Activity 13
Part 2 — A Trip Down the Alabama River4. Explain to students that they will now take a tripdown a river in Alabama to investigate one type ofestuary and the kinds of features that are presentwhen a river meets the sea.5. Show students an image of their school in GoogleEarth at an altitude of 4 km. Ask students if theyrecognize the image and its location. You may haveto point out a few familiar landmarks.6. Ask students to describe the environment aroundtheir school, pointing out the specific landforms andfeatures they see. (Ponds, rivers, streams, lakes, hills,canyons, and valleys are commonly mentioned, or there mayonly be city streets.)7. Demonstrate how to zoom in and out, move leftand right, and up and down using Google Earth.Also show students how to leave a place mark on aGoogle image. Distribute Student Reading — UsingGoogle Earth to Explore <strong>Estuaries</strong>.8. Click on the placeholder for the beginning of theAlabama River trip if you have marked it or go to:31 08' 53.46 N, 87 56' 56.46 W. Ask students whatkinds of features they see in the image. (Sand bars,farmland, forests, and a tributary flowing into the AlabamaRiver)Check for UnderstandingDiscuss the following:How do the terrain and types of landforms change asyou travel down a river toward a source of salt water?Which of the landforms and features on your scavengerhunt list were fairly common?9. Hand out Student Worksheet — Observing <strong>Estuaries</strong>.Instruct students to explore the Alabama River,following the directions and answering the questionson the worksheet.Part 3 — Estuary Landforms and FeaturesScavenger Hunt10. Divide your class into teams and hand out theStudent Worksheet — Scavenger Hunt.11. Show the Estuary Landforms and Features PowerPointpresentation so students have a basis for selectingfeatures in the scavenger hunt.12. In Google Earth, have the teams go to yourpre-selected starting point and challenge them tolocate as many of the features as they can in 30minutes.13. Have teams exchange lists and verify the objects oneach other’s lists. Have students place questionmarks on features that they either cannot find orthose they feel are misidentified.14. Have students answer the summary questions.Optional Extension InquiriesHave students create a travelogue that documents a tripdown a river that flows into another NERRS estuary.Have students make a PowerPoint presentation that describesthe differences between the geological landformsand features in upland versus estuarine environments.Which landforms were not present at all?Have students sketch an imaginary estuary system on apiece of paper. Direct them to draw and label as manylandforms and features on their diagram as possible. Collectand evaluate them for accuracy, clarity, and the numberof landforms correctly identified.Earth <strong>Science</strong> <strong>Module</strong>—Activity 14
<strong>Teacher</strong> Worksheet with AnswersActivity 1: Observing <strong>Estuaries</strong>Part 2 — A Trip Down the Alabama River2a. Use the vertical slider in the upper right-hand corner of the screen to zoom towards the river. What kinds ofland and terrain border the river? Use the navigation buttons to survey the area. Can you locate farms or other signsof human habitation or industry?Answer: Students will see a few patches of farmland and mostly flat, forested riverbanks. They will also notice sandbars on the insideof each curve of the river.2b. Use the slider in the upper right-hand corner of the image to set your viewing altitude at 4 kilometers (2.4 miles).For the rest of your journey, zoom back to this altitude before moving further downriver. As you travel downriver,what signs of human interaction with the river (industry, towns, ships, etc.) do you see?Answer: Large freighters, bridges, and large-scale mining operations can be seen as students go downriver.2c. When you reach a fork in the river, take the west channel. When you reach Whitehouse Bend (31 00' 07.06) onthe river, you will see a large brown feature. Zoom in and explore this region. What do you think this feature is?Answer: The feature at Whitehorse Bend appears to be a large borrow pit or surface mining operation.2d. After you cross highway I-65, you will see two large areas on both sides of the river. Zoom in and zoom out toexplore this area. Can you identify what type of terrain these areas consist of?Answer: The terrain on both sides of the river consists of extensive bayous and swamps.2e. Follow the river to Twelve Mile Island. How do you think this island formed? What kind of terrain surroundsthe island?Answer: Twelve Mile Island was formed by the river changing course. Bayous flank the river on both sides.2f. When you reach Bear Creek, a channel of the Alabama River empties into a larger body of water. What is it?Answer: The tributary of the Alabama River empties into Grand Bay.2g. When you arrive at Blakely Island Reach in Mobile, Alabama, how has the terrain on both rivers changed?Answer: Industrial sites line both sides of the river. No vegetation exists.Earth <strong>Science</strong> <strong>Module</strong>—Activity 15
2h. Center the river and fly south until you see Gaillard Island. Find latitude 30 30' 31" (on the right shoreline ofthe island) and zoom in. Describe what you see.Answer: Students should point out the estuarine environment formed by a fresh water river flowing into a long linear lagoon. Thebarrier beach that forms the eastern shore of the island forms the lagoon.2i. Move back to 4 km of altitude, and fly directly south from Gaillard Island to Mobile Point. Zoom in and describethe terrain you see.Answer: Mobile Point has many beaches and salt marshes behind them. There are a few ponds situated toward the center. There isan old fort (star-shaped formation) there as well.2j. Now fly east and explore the region to the north of the beach area beginning with Navy Cove. Describe thetypes of features and terrain you find there.Answer: Headlands, coves, bays, bayous, inlets, ponds, and barrier beaches occur in this vicinity.2k. Now fly directly north across the bay until you reach Weeks Bay National Estuarine Research Reserve. Canyou identify a sediment plume at the mouth of the bay? Identify other features in the neighborhood of the estuaryreserve.Answer: Yes, a sediment plume is evident. Other features include a peninsula, wetlands, forested areas, beaches, and salt marshes.2l. In your journey, you traveled from an upland region to an estuarine environment (Mobile Bay) to a coastal area.In general, how did the types of terrain change in each region as you made your way downriver?Answer: The terrain changes dramatically as you travel downriver—from forested areas with occasional farmland to a complex ofbayous, deltas, beaches, and salt marshes.2m. How does the water change as you move down the river? What evidence can you give for any changes you see?Answer: Students should notice that many different kinds of bodies of water increase the complexity of the river system as it movestowards the sea (inlets, bays, streams, bayous, wetlands, salt marshes, etc.). Evidence includes seeing sediment plumes and sand barsas streams and rivers empty into larger bodies of water.2n. Describe how different human activities affect the nature of the river and the terrain on both sides of it.Answer: Large-scale industrial activity on both sides of the river has in some cases diverted the flow of the river and certainly hascontributed to waste products being washed into the river.Earth <strong>Science</strong> <strong>Module</strong>—Activity 16
Part 3 — Estuary Landforms and Features Scavenger Hunt3a. Which landforms and features were easiest to find?Answer: Students’ answers will vary depending on which section of coastline they are investigating.3b. Which landforms or features were the most difficult to find?Answer: Students’ answers will vary. In particular, students may have difficulty finding reefs unless they search in tropical climates.Earth <strong>Science</strong> <strong>Module</strong>—Activity 17
Student Reading—1Activity 1: Observing <strong>Estuaries</strong>An estuary is a partially enclosed body of water, and itssurrounding coastal habitats, where saltwater from theocean mixes with fresh water from rivers, streams, orgroundwater. In fresh water, the concentration of salts,or salinity, is nearly zero. The salinity of water in theocean averages about 35 parts per thousand (ppt). Themixture of seawater and fresh water in estuaries is calledbrackish water.softer rocks are eroded away by relentlesswave action occurring over thousands ofyears. In contrast, sand bars, spits, and evenentire beaches can form, or be completelyobliterated, in a single severe storm. Estuaryfeatures such as salt marshes, bayous, andmangrove forests form in the areas protected bybarrier beaches, islands, and strips of coastal land.<strong>Estuaries</strong> are transitional areas that connect the landand the sea, as well as freshwater and saltwater habitats.The daily tides (the regular rise and fall of the sea’s surface)are a major influence on many of these dynamicenvironments. Most areas of the Earth experience twohigh and two low tides each day. Some areas, like theGulf of Mexico, have only one high and one low tideeach day. The tidal pattern in an estuary depends on itsgeographic location, the shape of the coastline andocean floor, the depth of the water, local winds, andany restrictions to water flow. For example, tides at theend of a long, narrow inlet might be heightened becausea large volume of water is being forced into avery small space. However, the change in sea level fortides in wetlands composed of broad mud flats mightappear to be rather small.While strongly affected by tides and tidal cycles, manyestuaries are protected from the full force of oceanwaves, winds, and storms by reefs, barrier islands, orfingers of land, mud, or sand that surround them. Thecharacteristics of each estuary depend upon the localclimate, freshwater input, tidal patterns, and currents.Truly, no two estuaries are the same.Besides the constant erosional forces of water andwind, coastal landforms and features are influenced byother large, long-term geologic events. Glaciersretreating during the last ice age sculpted the northeastcoastline of the United States. One look at thepeninsulas of Maine clearly shows the direction ofretreat of the mile-thick ice sheets. Only the hardestrock was left behind to form the islands and thepeninsulas of the coast. During this period, the entirebulk of Long Island was left behind by the forwardedge of a massive glacier, deposited like a load of dirtfrom a huge dump truck. Long Island Sound formed inthe gouge behind the rubble.In this activity, you will explore how landforms andfeatures change as you travel from the interior of ourcountry to the place where rivers empty into thesea—estuaries. Then, you will explore coastal regionsfrom above using Google Earth or other resources toidentify landforms and features associated withestuarine and coastal environments.Landforms that occur on or near the coast are shapedby wave and wind erosion and glacial transport. Headlandsare composed of the very hard rock left behind asEarth <strong>Science</strong> <strong>Module</strong>—Activity 1
Student Reading—2Activity 1: Introduction to Weeks Bay NERRThe Weeks Bay National Estuarine Research Reserve(NERR) includes over 6,000 acres of coastal wetlandsthat provide rich and diverse habitats for a variety offish, crustaceans and shellfish, as well as many uniqueand rare plants. Weeks Bay is a small estuary, about 8km 2 , receiving freshwater from the Magnolia and Fishrivers, and draining a 500 km 2 watershed into thelower portion of Mobile Bay. This sub-estuary ofMobile Bay averages just 1.5 meters in depth and isfringed with salt marshes dominated by black needlerush and cordgrass, as well as extensive swamps withpine, oak, magnolia, maple, cypress, bayberry, andtupelo trees.The Weeks Bay ecosystem contains many freshwaterand marine fish and invertebrate species. Collectively,these species support large commercial andrecreational fishing industries. Weeks Bay is especiallya critical nursery for shrimp, bay anchovy, blue craband multitudes of other fish, crustaceans andshellfish. The Reserve lands also include upland andbottomland hardwood forests, freshwater marsh,submerged aquatic vegetation, and unique boghabitats. Many of these areas are especially importantto the large number of trans-Gulf migratory birds as aresting and feeding area.Additionally, the Weeks Bay NERR is home to manythreatened or endangered species, including the WestIndian manatee, eastern fox squirrel, red-cockadedwoodpecker, wood stork, Alabama red-bellied turtle,gopher tortoise, and Alabama sturgeon.Although the Reserve is relatively undisturbed,increasing development pressure and populationgrowth within areas of the Weeks Bay watershed hasresulted in increasing sources of pollution. Theseinclude storm water runoff from parking lots,industrial sites, leaking septic tanks, and landfills, aswell as, agricultural runoff. Input of excessivenutrients and sediments from this runoffcan have detrimental affects on estuarylife including reduction in submergedaquatic vegetation, increase in algalblooms which cause fish kills, andaccumulation of toxic substances withinshellfish.Figure 1. Weeks Bay NERR is home to many species ofplants and animals.Earth <strong>Science</strong> <strong>Module</strong>—Activity 12
Figure 2.Location of Weeks Bay ReserveEarth <strong>Science</strong> <strong>Module</strong>—Activity 13
Student Worksheet - 1Activity 1: Observing <strong>Estuaries</strong>Student Name:Part 1 — What is an Estuary?1. Use a blank piece of paper to sketch what you think an estuary looks like.Part 2 — A Trip Down the Alabama RiverTake an aerial tour of a section of the Alabama River in Alabama, following the river’s course from a point in thesouth-central portion of the state, through to Mobile Bay where it empties into the Gulf of Mexico. To begin:1.Open Google Earth2.Click on the Fly To button, and enter these coordinates (31 08' 53.46 N, 87 56' 56.46 W).3.Under the Layers menu, click on Terrain, Geographic Web, Places of Interest, and RoadsFigure 3.The Alabama River in Alabama—the starting point for your tour.Earth <strong>Science</strong> <strong>Module</strong>—Activity 14
2a. Use the vertical slider in the upper right-hand corner of the screen to zoom towards the river. What kinds ofland and terrain border the river? Use the navigation buttons to survey the area. Can you locate farms or other signsof human habitation or industry?2b. Use the slider in the upper right-hand corner of the image to set your viewing altitude at 4 kilometers (2.4miles). For the rest of your journey, zoom back to this altitude before moving further downriver. As you traveldownriver, what signs of human interaction with the river (industry, towns, ships, etc.) do you see?2c. When you reach a fork in the river, take the left channel. When your reach Whitehouse Bend (31 00' 07.06)on the river, you will see a large brown feature. Zoom in and explore this region. What do you think this feature is?2d. After you cross highway I-65, you will see two large areas on both sides of the river. Zoom in and zoom outto explore this area. Can you identify what type of terrain these areas are?2e. Follow the river to Twelve Mile Island. How do you think this island formed? What kind of terrainsurrounds the island?2f. When you reach Bear Creek, a channel of the Alabama River empties into a larger body of water. What is it?Earth <strong>Science</strong> <strong>Module</strong>—Activity 15
2g. When you arrive at Blakely Island Reach in Mobile, Alabama, how has the terrain on both rivers changed?2h. Center the river and fly south until you see Gaillard Island. Find latitude 30 30' 31" (on the right shorelineof the island) and zoom in. Describe what you see.2i. Move back to 4 km of altitude, and fly directly south from Gaillard Island to Mobile Point. Zoom in anddescribe the terrain you see.2j. Now fly east and explore the region to the north of the beach area beginning with Navy Cove. Describe thetypes of features and terrain you find there.2k. Now fly directly north across the bay until you reach Weeks Bay National Estuarine Research Reserve.Can you identify a sediment plume at the mouth of the bay? Identify other features in the neighborhood of theestuary reserve.Earth <strong>Science</strong> <strong>Module</strong>—Activity 16
Figure 4. The end point of your Alabama River trip in the Weeks Bay NERR2l. In your journey, you traveled from an upland region to an estuarine environment (Mobile Bay) to a coastalarea. In general, how did the types of terrain change in each region as you made your way downriver?2m. How does the water change as you move down the river? What evidence can you give for any changes yousee?2n. Describe how different human activities affect the nature of the river and the terrain on both sides of it.Earth <strong>Science</strong> <strong>Module</strong>—Activity 17
Part 3 — Estuary Landforms and Features Scavenger HuntView the Estuary Landforms and Features PowerPoint presentation and take notes about the various structures andfeatures.Using Google Earth, explore regions of coastline and find as many landforms and features as you can on theStudent Worksheet — Scavenger Hunt.Your teacher may start you in a particular coastal region. You may then “fly” to other coastal areas and search formissing landforms and features if time allows.Exchange your list with another team and check that team’s results by flying to each location they recorded toverify whether the landforms and features have been correctly identified.3a. Which landforms and features were easiest to find?3b. Which landforms and features were the most difficult to find?Earth <strong>Science</strong> <strong>Module</strong>—Activity 18
Student Worksheet - 2Activity 1: Scavenger HuntTeam Member Names:______When you identify a landform or feature in Google Earth, give the name if provided, and the exact coordinates(latitude and longitude). NOTE: You may not find all landforms and features in a particular stretch of coastlineor estuarine region.Landformbarrier beachbaybayoucovedeltaharborheadlandlagoonmangrove forestpeninsulasloughsoundreefsalt marshtidal or mud flatsName/Location (latitude and longitude)____________________________________________________________________________________________________________________________________________________________________________________________________________________________________________________________________________________________________________________________________________________________________________________________________________________________________________________________________________________________________________________________________________________________________________________________________________________________________________________________________________________________________________________________________________________________________________________________________________________________________________________________________________________________________________________________________Earth <strong>Science</strong> <strong>Module</strong>—Activity 19
<strong>Teacher</strong> Guide—Earth <strong>Science</strong> <strong>Module</strong>Activity 2: Salinity & TidesFeatured NERRS Estuary:Chesapeake Bay Virginia NationalEstuarine Research Reservehttp://nerrs.noaa.gov/Reserve.aspx?ResID=CBVActivity SummaryIn this activity, students learn about tides and salinity inestuaries. They observe time-lapse models of tides andsalinity distribution in the York River, part of theChesapeake Bay, VA NERR. Learn how salinity changeswith an incoming and outgoing tide, observing thedynamics of the salt wedge at various sites along the river.Students also make predictions about the salinitychanges at each site based upon their observations ofthe animation. They then use salinity data frommonitoring stations along the river to see changes duringa typical day. And, then describe the patterns of eachsalinity graph and compare the graphs.Learning ObjectivesStudents will be able to:1. Analyze different forms of data and synthesizeinformation to develop a hypothesis.2. Explain how tides and the geology of the estuaryaffect water circulation in an estuary.3. Describe daily patterns of salinity changes in theestuary.Grade Levels9-12Teaching Time3 (55 minute) class sessions + homeworkOrganization of the ActivityThis activity consists of 3 parts which help deepenunderstanding of estuarine systems:Tides in Chesapeake BaySalinity as York River Flows into the BayInteraction of Tides and River FlowBackgroundYork River is one of several riversflowing into Chesapeake Bay. As thenation’s largest estuary, ChesapeakeBay contains a diverse collection ofhabitats including oyster reefs, seagrassbeds, tidal wetlands, sandy shoals andmudflats. Chesapeake Bay and YorkRiver illustrate the complexities of tidalEarth <strong>Science</strong> <strong>Module</strong>—Activity 2
variation that respond not just to the gravitational pull ofthe sun and the moon, but also to the underlyingtopography of the bay and the dynamics of the estuarineriver systems.Chesapeake Bay Virginia National Estuarine ResearchReserve has four sites on the York River, enablingresearch and education about the estuary, includingextensive data from water quality stations and otherobservations by reserve scientists. In this learningactivity, students use this multi-site system to exploretides and salinity from tidal freshwater to high salinityconditions along the York River estuary. Reservecomponents include Sweet Hall Marsh, Taskinas Creek,Catlett Island and Goodwin Islands.Rivers. Both riversdischarge into Chesapeake Bay.Additional Resources For background on tides and estuaries, refer toStudent Reading — Estuarine Tides. For a more thorough background on tides, see theNOS Tutorial on Tides and Water Levels:oceanservice.noaa.gov/education/kits/tides/welcome.htmlPreparationMake copies of Student Reading — Estuarine Tides, StudentWorksheet — Salinity and Tides, and if you will not beproviding computer-access to the data, Student Data Sheet— Salinity and Tide Data for York River. (Note that thedata on the Student Data Sheet are for a specific date:March 21, 2007.)Arrange for students to work with the animation anddata, either in a computer lab or with a computer andprojector. Bookmark the following sites: http://nerrs.noaa.gov/Reserve.aspx?ResID=CBV tidesandcurrents.noaa.gov/ofs/cbofs/wl_nowcast.shtml www.vims.edu/physical/web/presnt/qtime/Kimplot3.mov http://www3.vims.edu/vecos/Figure 2.Close-up Map of York River with NERR sitesFigure 1.The location of York River with respect toChesapeake BayEarth <strong>Science</strong> <strong>Module</strong>—Activity 22
ProcedurePart 1 — Tides in Chesapeake Bay1. Introduce students to the Chesapeake Bay. If needbe, use a U.S. Map to show students the location ofChesapeake Bay. Students can also learn more aboutthe bay using Google Earth (refer to the StudentReading — Using Google Earth to Explore <strong>Estuaries</strong> for abrief how-to guide) or they can read more on theChesapeake Bay Virginia NERR web site:http://nerrs.noaa.gov/Reserve.aspx?ResID=CBV2. Using a computer projector for the whole class orletting students work individually or in teams in thecomputer lab, demonstrate the Tides in ChesapeakeBay web site:tidesandcurrents.noaa.gov/ofs/cbofs/wl_nowcast.shtml3. Have students complete Part 1 of the StudentWorksheet — Salinity and Tides.National <strong>Science</strong> Education StandardsContent Standard A: <strong>Science</strong> as InquiryA3. Use technology and mathematics to improveinvestigations and communications.A4. Formulate and revise scientific explanationsusing logic and evidence.A6. Communicate and defend a scientific argument.Content Standard B: Physical <strong>Science</strong>B4. Motions and forcesB5. Conservation of energy and the increase indisorderB6. Interactions of energy and matterContent Standard D - Earth and Space <strong>Science</strong>D1. Energy in the earth system 189D2. Geochemical cycles 189MaterialsStudentsNeed to work in a computer lab or with acomputer and projectorCopy of the Student Reading — Estuarine TidesCopy of the Student Worksheet — Salinity andTidesCopy of the Student Data Sheet — Salinity andTide Data for York River (if there is nocomputer-access to the data)U.S. Map and/or Google Earth<strong>Teacher</strong>sBookmark the following sites:http://nerrs.noaa.gov/Reserve.aspx?ResID=CBVtidesandcurrents.noaa.gov/ofs/cbofs/wl_nowcast.shtmlwww.vims.edu/physical/web/presnt/qtime/Kimplot3.movhttp://www3.vims.edu/vecos/Equipment:Computer lab orComputer and ProjectorCopy of Student Reading — Using GoogleEarth to Explore <strong>Estuaries</strong> (assuming you havecomputer access) - Find the tutorial in <strong>Estuaries</strong>.noaa.gov,click under Curriculum, High-School Curriculum, Supplementary MaterialsEarth <strong>Science</strong> <strong>Module</strong>—Activity 23
Part 2 — Salinity as York River Flows into the BayHere, you focus on salinity, helping students think, in ageneral way, about the salinity gradient in the York Riveras the fresh water flows into the salty bay.4. Make sure the students understand the locationof York River in Chesapeake Bay.5. Have students complete Part 2 of the StudentWorksheet — Salinity and Tides, labeling the YorkRiver map with “fresh,” “nearly fresh,” “fairlysalty,” “close to seawater,” or “seawater.”If students have hands-on experiences in mixingfresh and seawater and/or have measuredsamples of fresh, brackish, and seawater, theycan label the map with their best guesses aboutsalinity, which will range from 0 (fresh) to about35 parts per thousand (ocean).6. Have students compare maps in small groupsand explain why they marked them as they did.7. Discuss daily and seasonal factors and Earthprocesses that affect salinity in an estuary.8. Have students read Student Reading — EstuarineTides. (This can be assigned as homework.)Part 3 — Interaction of Tides and River FlowWith this part, students deepen their understanding ofestuarine systems, focusing on the interaction of tidesand rivers and how this affects salinity in the estuary.9. Using a computer projector for the whole class orletting students work individually or in teams in thecomputer lab, demonstrate the animation of tidesand salinity in York River at this web site:.Make sure students are aware that the animationshows the change in salinity over a tidal cycle of 24hours. Explain that the animation is not arepresentation of salinity changes for a specific date,but rather a model of what salinity distributionmight be like in the river on any given day.Provide a general orientation about the animationfor students: The bottom and larger part of the animationshows horizontal distribution—salinitychanging from upstream to downstream. There are four reference points on theanimation. Three are sites for which studentswill analyze salinity graphs in Part 2. (GLPT isGloucester Point, #1 is Yorktown, and #3 isClay Bank.) The three images to the right show transverseslices of each of the three points—cut-awayviews of those locations—and show how saltierand fresher water is mixing from the surface ofthe water to the bottom. The scale on the left shows the amount ofsalinity in parts per thousand (ppt). Studentsshould generally know that moving from blueto red on the scale represents fresh toincreasingly saltier water. Students should also be aware that arrows onthe image indicate the direction of water flow. The hour on the animation indicates the time ofday on the 24-hour clock. The isohalines (lines on a chart connecting allpoints of equal salinity) help students determinelevels of salinity.10. Encourage students to play this animation severaltimes, looking for general patterns first, then atspecific phenomena and distribution at specificplaces.11. Have students answer the first set of questions inPart 3 of the Student Worksheet — Salinity and Tides.12. Have students look at the cross-section views in theupper right of the animation, showing salinity withdepth in the river, at the lines marked 1, 2 & 3, andanswer the remaining questions.Earth <strong>Science</strong> <strong>Module</strong>—Activity 24
Part 4 — Salinity as Measured by Water QualityStations in York RiverHaving seen what a theoretical salinity distribution canlook like in the river, students now observe actual salinitydata for a specific day at five different sites along theriver. You can do this activity either using computeraccess to near-current data or using the prepared datagraphs in the Student Data Sheet — Salinity and Tide Data forYork River.Select data for the same date at each station.Students may select a date of their own choosing,but for the purposes of this initial activity, it willbe best for the whole class to choose the samedate for the sake of consistency when they arediscussing results.Observe graphs of salinity data for that day at eachsite. It will be helpful for students to print outgraphs for each site so they can compare changesfrom site to site, over time.13. If you use the computer access to data, follow theinstructions in the Student Worksheet — Salinity andTides. If you use the prepared graphs, hand them outto students.Students will: Read information about the station including Salinityregime, Mean tidal range, Meanwater depth, and Adjacent water. Make predictions about how fresher and saltier waterwill mix, and how salinity changes throughout the daywill differ from site to site.14. Encourage students to correlate the salinity graphsat the five sites with the generalizeddistribution shown in the animation. Studentsshould pay particular attention to the graphs ofGloucester Point, Yorktown, and Clay Bankbecause this is the area marked by the threereference points in the animation.15. Have students answer the questions in Part 4 ofthe Student Worksheet — Salinity and Tides.Check for Understanding1. Discuss the following: How do the changes at each monitoring stationcompare with changes at those same areas in theanimation? Name several factors that determine why salinitychanges are different depending on your locationwithin the estuary.2. Ask small groups to use their handouts to answer thisquestion. Collect this assignment and use it as a final assessment.Imagine that an intense rainstorm dumps 3 inches ofrain over the entire Chesapeake Bay region. Predicthow the salinity would change at all four stations in thebay for a period of 24 hours after the storm ends. Supplya graph and an explanation of what you might expectto see at each station.Optional Extension Inquiries1. Have students access other data from the VIMS site tosee how factors such as precipitation and temperaturemight have affected salinity on that date.2. Have students investigate tides and salinity from otherNERRS estuaries, using the Data Graphing Applicationon: http://estuaries.gov/<strong>Science</strong>Data/Graphing.aspx3. Other related activities include: NOS Tides Lesson Plansoceanservice.noaa.gov/education/kits/tides/supp_tides_lessons.htmlEarth <strong>Science</strong> <strong>Module</strong>—Activity 25
<strong>Teacher</strong> Worksheet with AnswersActivity 2: Salinity & TidesPart 1 — Tides in Chesapeake Bay1a. At what time is the tide highest at the mouth of the bay near Norfolk? How high is the tide?Answer: Student answers will vary since this model is constantly updated to show near real-time. To determine the answer, workthrough the animation to find when the color at the mouth is deepest orange (or even red). Then read the time. For height, read theheight (2-3 feet is a likely answer).1b. At what time did this tidal rise reach the northern tip of the bay near Baltimore? How high is the tide?Answer: Student answers will vary since this model is constantly updated to show near-real-time. To determine the answer, workthrough the animation to find when the color at the tip of the bay is towards the blue end of the scale. Then read the time. Forheight, read the height (.5 feet is a likely answer).1c. How long did it take the tide to move this distance?Answer: Student answers will vary. A typical answer is 12 hours.1d. Which location has higher tides? Why?Answer: Mouth of the bay because it is closer to the ocean where the tidal water enters the bay.1e. Which location do you think has saltier water? Why?Answer: Mouth of the bay because it is closer to the ocean where the salty ocean water enters the bay.Part 2 — Salinity as York River Flows into the Bay2a. The map below shows the York River where it empties into Chesapeake Bay. On the map, indicate how youthink the salinity might differ throughout the river and into Chesapeake Bay. Label parts of the map “fresh,”“nearly fresh,” “fairly salty,” “close to seawater,” or “seawater.”Answer: Student areas will vary. However, students should show some gradation of salinity, moving from less salty water upriver(upper left of the map) to more salty as they approach the ocean. The actual mean salinity of Taskinas Creek (upriver) ranges fromabout 3-5 ppt in winter to about 14-16 ppt in summer. The actual mean salinity of Goodwin Islands (in Chesapeake Bay) rangesfrom about 13-15 ppt in winter/spring to about 23-25 ppt in summer/fall.Earth <strong>Science</strong> <strong>Module</strong>—Activity 26
Part 3 — Interaction of Tides and River Flow3a. At the mouth of the river (lower right), what are the highest and lowest salinity levels, in ppt, during this timeframe?Answer: High 22, low 20 ppt (approximately)3b. Now look up river at the upper left of the animation. What are the highest and lowest salinity levels there?Answer: High 13, low 6 ppt (approximately)3c. Why is there such a difference between these two locations?Answer: Fresh water enters up river, salt water enters from Chesapeake Bay.3d. Play the animation and study the full extent of the river. How often do the arrows change direction? How doesthat affect salinity throughout the river?Answer: The arrows flow up (as the tide rises) for about 6 hours, then down (as the tide falls) for 6 hours. As tide rises, salinityincreases and works it way up river, then vice-versa as tide falls.3e. At what point are there greatest changes in salinity throughout the day? Why do you think so?Answer: Saltier water moves up the river at high tide and fresher water moves seaward at low tide. Water with salinity of about22 ppt moves from the mouth of the river to beyond Point 1 when the tide comes in. The area from Point 1 to Point 3 ranges fromabout 22 to 12 ppt. The area from Point 3 upriver ranges from about 16 to below 5 ppt.3f. Does the freshest water (the darkest blue) ever appear on the image? Where and for how long? Does the saltiestwater (red) ever appear on the image? Where and for how long?Answer: The freshest water (less than 5 ppt) appears in the upper-most part of the river about every six hours when the arrowsare moving seaward. Water of 25 ppt does not seem to appear on the map. The saltiest water is about 22 ppt and appears in thelower right-hand corner of the map. It does not go upriver much past station 1.3g. How does the water get mixed from top to bottom as the salinity changes from upstream to downstream?Answer: The water seems to get most thoroughly mixed from top to bottom in the area that is farthest upstream and especiallywhere the river is shallow. The salinity in the areas most seaward, and especially the deeper parts of the river, does not change muchat all.Earth <strong>Science</strong> <strong>Module</strong>—Activity 27
Part 4 — Salinity as Measured by Water Quality Stations in York River4a. Describe the general pattern of salinity data for each site: Goodwin Island, Gloucester Point, Yorktown (thisstation is not included in the data sheets provided for March 21-22, 2007), Clay Bank, and Taskinas Creek.Answer: Student answers for all the sites will vary depending on the dates they select.4b. Describe changes in salinity from site to site.Answer: Generally, salinity decreases as you go from the coastal areas up the York River. Generally the lowest salinity values fora day occur during low tide (when water depth is low). Students will find that stations further upriver have salinity patterns thatmore closely resemble patterns of water depth or tide height. This is clearly seen in the graphs for Taskinas Creek. Stations closer tothe ocean have more irregular patterns that may not resemble patterns in graphs of water depth. Salinity graphs at these sites showmore frequent peaks and valleys.4c. What do you think explains the differences in salinity from site to site?Answer: Sites further upriver are influenced not only by the brackish water of the York River, but also by fresh water enteringfrom creeks and groundwater. High tides bring saltier water and salinity goes up. During low tides, fresher water predominates andsalinity goes down. Salinity for sites closer to the coast may seem more erratic throughout the day. These sites are subject to morethorough mixing of fresher and saltier water because of waves, winds, and currents.Earth <strong>Science</strong> <strong>Module</strong>—Activity 28
Student ReadingActivity 2: Estuarine Tides — It’s Not Just the Sun andMoonWhat Affects Tides in Addition to the Sun and Moon?The relative distances and positions of the sun, moon and Earth all affect the size and magnitude of theEarth’s two tidal bulges. At a smaller scale, the magnitude of tides can be strongly influenced by the shape ofthe shoreline. When oceanic tidal bulges hit wide continental margins, the height of the tides can be magnified.Conversely, mid-oceanic islands not near continental margins typically experience very small tides of 1 meter orless. The shape of bays and estuaries also can magnify the intensity of tides. Funnel-shaped bays in particular candramatically alter tidal magnitude. The Bay of Fundy in Nova Scotia is the classic example of this effect, and hasthe highest tides in the world—over 15 meters. Narrow inlets and shallow water also tend to dissipate incomingtides. Inland bays such as Laguna Madre, Texas, and Pamlico Sound, North Carolina, have areas classified asnon-tidal even though they have ocean inlets. In estuaries with strong tidal rivers, such as the Delaware River andColumbia River, powerful seasonal river flows in the spring can severely alter or mask the incoming tide. Localwind and weather patterns also can affect tides. Strong offshore winds can move water away from coastlines,exaggerating low tide exposures. Onshore winds may act to pile up water onto the shoreline, virtually eliminatinglow tide exposures. High-pressure systems can depress sea levels, leading to clear sunny days with exceptionallylow tides. Conversely, low-pressure systems that contribute to cloudy, rainy conditions typically are associatedwith tides that are much higher than predicted.— Adapted from <strong>NOAA</strong>’s National Ocean Service website, section on Tides &Water Levels.URL:http://oceanservice.noaa.gov/education/kits/tides/tides08_othereffects.html.Accessed: 2008-07-20. (Archived by WebCite ® at http://www.webcitation.org/5ZS2dFx8h)For a more thorough background on tides, see the NOS Tutorial on Tides and Water Levels:Earth <strong>Science</strong> <strong>Module</strong>—Activity 2
Student WorksheetActivity 2: Salinity & TidesPart 1 — Tides in Chesapeake BayYou might think of tides as the simple rising and lowering of the sea level based on the gravitational pullof the sun and moon. However, tides are much more dynamic and interesting, especially in estuaries. InChesapeake Bay, it can take several hours for the high tide to move from the mouth of the bay to thenorthern tip. The rivers feeding into the bay add their own dynamics to the tidal variations. Here, you willstudy animations of tides in the Chesapeake Bay and York Rivers to understand these tidal dynamics andtheir effect on salinity.Tides in Chesapeake BayGo to the following web site, which has an animation that shows tides throughout the bay for the past 3 days:.Watch the animation and look for patterns in the tidal pulse as it works its way up the bay. Notice the scale on theright, with yellows and reds as high tide, greens and blues as low tides. Step through the animation, pressing the“Prev” and “Next” buttons, to watch the tide move up the bay.1a. At what time is the tide highest at the mouth of the bay near Norfolk? How high is the tide?1b. At what time did this tidal rise reach the northern tip of the bay near Baltimore? How high is the tide?1c. How long did it take the tide to move this distance?1d. Which location has higher tides? Why?Earth <strong>Science</strong> <strong>Module</strong>—Activity 22
1e. Which location do you think has saltier water?Why?Part 2 — Salinity as York River Flows intothe BayNext, you take a closer look at York River to see howtides and the flowing river interact and affect salinity ofthe water.The map below shows the York River where it emptiesinto Chesapeake Bay. On the map, indicate how youthink the salinity might differ throughout the river andinto Chesapeake Bay. Label parts of the map “fresh,”“nearly fresh,” “fairly salty,” “close to seawater,” or“seawater.”Figure 1.The location of York River with respect toChesapeake BayFigure 2.Yorktown, Virginia is situated at the mouth of the York River.Earth <strong>Science</strong> <strong>Module</strong>—Activity 23
Part 3 — Interaction of Tides and River FlowGo to this web site: . The animation shows salinity in York River,and how it changes with the incoming and outgoing tide, over 24 hours.Use the slide bar to control the animation at your own pace. Watch the animation several times, looking for patternsin the salinity. Notice the time counter at the top, marking half-hour increments, and the scale bar on the left showingsalinity in parts-per-thousand (ppt).3a. At the mouth of the river (lower right), what are the highest and lowest salinity levels, in ppt, during this timeframe?3b. Now look up river at the upper left of the animation. What are the highest and lowest salinity levels there?3c. Why is there such a difference between these two locations?3d. Play the animation and study the full extent of the river. How often do the arrows change direction? How doesthat affect salinity throughout the river?3e. At what point are there greatest changes in salinity throughout the day? Why do you think so?3f. Does the freshest water (the darkest blue) ever appear on the image? Where and for how long? Does the saltiestwater (red) ever appear on the image? Where and for how long?Earth <strong>Science</strong> <strong>Module</strong>—Activity 24
3g. Now look at the cross-section views in the upper right of the animation, showing salinity with depth in the river,at the lines marked 1, 2 & 3. How does the water get mixed from top to bottom as the salinity changes from upstreamto downstream?Part 4 — Salinity as Measured by Water Quality Stations in York RiverThe animations showed salinity distribution throughout a river based on a computer model. Now, you will observeactual salinity data for a specific day at five different sites along the York River. These sites use data buoys and otherwater quality stations to measure water depth, salinity, and other important data. These instruments support researchat the Chesapeake Bay Virginia NERR and the affiliated Virginia Institute of Marine <strong>Science</strong> (VIMS).You can do this activity in either of two ways: Use your computer to access real-time data and display your owngraphs (see instructions below) or use the Student Data Sheet with its graphs for a sample date.If you use your computer, follow theseinstructions:Open the Virginia Estuarine and Coastal ObservingSystem site at: http://www3.vims.edu/vecos/This will bring up a page showing a regional view withsome of the York River stations.Starting with Goodwin Island Continuous MonitoringStation (CHE019.38), click on each station, movingprogressively up river (to Gloucester Point (YRK—5.40), Yorktown (YRK006.77), Clay Bank(YRKO15.09), and Taskinas Creek (TSK000.23).For each station, print the graphs of salinity and waterdepth.Read other information about the station includingSalinity regime, Mean tidal range: 0.85 meters, andMean water depth.Figure 3. Location of selected monitoring stationsin the Chesapeake Bay region.Earth <strong>Science</strong> <strong>Module</strong>—Activity 25
Whether you use computer to access data or the pre-printed graphs, answer the following questions:4a. Describe the general pattern of salinity data for each site:Goodwin IslandGloucester PointYorktown (this station is not included in the data sheets provided for March 21-22, 2007)Clay BankTaskinas Creek.4b. Describe changes in salinity from site to site.Earth <strong>Science</strong> <strong>Module</strong>—Activity 26
Student Data SheetActivity 2: Salinity and Tide Data for York RiverSalinity Data for March 21-22, 2007Goodwin Islands Continuous Monitoring Station: CHE019.38http://www3.vims.edu/vecos/StationDetail.aspx?param=CHE019.38&program=CMONLocation: N 37º 13’ 01.2” W 76º 23’ 19.2”Tributary: York RiverSalinity regime: PolyhalineMean tidal range: 0.79 meterMean water depth: 1.0 meterAdjacent Water: located on the southern side of the York River, near the mouth of the River.Figure 4. Salinity atGoodwin IslandsMonitoring StationFigure 5. Water depth atGoodwin IslandsMonitoring StationEarth <strong>Science</strong> <strong>Module</strong>—Activity 27
Gloucester Point (GP) Continuous Monitoring Station: YRK005.40Location: N 37º 14’ 53.82” W 76º 29’ 47.46” Tributary: York RiverSalinity regime: PolyhalineMean tidal range: 0.73 metersMean water depth: 1.8 metersAdjacent water: The Gloucester Point station is located north of the York River channel, approximately 5.4 nauticalmiles upstream from the River’s mouth.Figure 6. Salinity atGloucester PointMonitoring StationFigure 7. Water depth atGloucester PointMonitoring StationEarth <strong>Science</strong> <strong>Module</strong>—Activity 28
Claybank (CB) Continuous Monitoring Station: YRK015.09Location: N 37º 20’ 49.5” W76º 36’ 41.94”Tributary: York RiverSalinity regime: MesohalineMean tidal range: 0.85 metersMean water depth: 1.2 metersAdjacent water: The Clay Bank station is located northeast of the York River channel, approximately 15.1 nauticalmiles upstream from the River’s mouth.Figure 8. Salinity atClaybank MonitoringStationFigure 9. Water depth atClaybank PointMonitoring StationEarth <strong>Science</strong> <strong>Module</strong>—Activity 29
Taskinas Creek (TC) Continuous Monitoring Station: TSK000.23Location: N 37º 24’ 54.79” W 76º 42’ 52.74Tributary: York RiverSalinity regime: MesohalineMean tidal range: 0.85 metersMean water depth: 1.5 metersAdjacent water: The Taskinas Creek station is located southwest of the York River channel, approximately 23 milesupstream from the River’s mouth.Figure 10. Salinity atTaskinas CreekMonitoring StationFigure 11. Water depth atTaskinas CreekMonitoring StationEarth <strong>Science</strong> <strong>Module</strong>—Activity 210
<strong>Teacher</strong> Guide—Earth <strong>Science</strong> <strong>Module</strong>Activity 3: Estuary and WatershedFeatured NERRS Estuary:San Francisco BayNational Estuarine Research Reservehttp://nerrs.noaa.gov/Reserve.aspx?ResID=SFBActivity SummaryIn this activity, students investigate the nature of watershedsand their relationship to the dynamic changes thatoccur in estuaries due to drainage and runoff. Studentsbegin by examining the San Francisco Bay EstuarineResearch Reserve and tracing the extent of thewatershed using Google Earth. Then they identifypossible sources of pollution and contamination alongthe major rivers that feed into the bay. Students alsoexamine water quality data in the San Pablo region ofthe estuary and identify changes that occur due to astorm event.Learning ObjectivesStudents will be able to:1. Identify the processes in the watershed that affectconditions in the estuary and explain some specificexamples.2. Apply their understanding of changes in thewatershed and the resulting effects on the estuary toexplain real-life situations regarding land use andweather in watersheds.3. Understand how water quality factors are affected bynatural and man-made sources of pollution andcontamination.Grade Levels9-12Teaching Time4 (55 minute) class sessions + homeworkOrganization of the ActivityThis activity consists of 4 parts which help deepenunderstanding of estuarine systems:Exploring the San Francisco WatershedWhat’s Upstream Comes DownstreamWater Quality at the Mouth of the WatershedOptional: Mapping Your Local WatershedBackgroundSan Francisco Bay is an extensive andshallow estuary that drainsapproximately 40% of California.Ninety percent of the water flowinginto the bay comes from theSacramento and San Joaquin rivers,whose headwaters are in the SierraEarth <strong>Science</strong> <strong>Module</strong>—Activity 3
Nevada Mountains. Both rivers flow into the Delta, avast network of channels, agricultural lands and freshwater wetlands, and then into Suisun Bay where theybegin mixing with salt water from the Pacific Ocean.San Francisco Bay has lost approximately 80% percentof its historic tidal wetlands due to developmentpressures within and around the bay. Tidal wetlands arecritical for flood prevention; sediment management; andhabitats for small mammals, migratory birds and fishspecies, many of which are threatened or endangered.PreparationDownload Google Earth and install it on yourclassroom computer(s) or computer lab machines. Tofind a tutorial for using Google Earth, please read thebox below.Optional: Obtain topographic maps for plotting yourlocal watershed for Part 4 of the activity.You can obtain such a map from a nearby store or orderone at .Endangered species in the bay include the Californiaclapper rail and salt marsh harvest mouse. Thesouthwestern end of San Pablo Bay, near the town ofSan Rafael, was the site of a Chinese shrimp-fishing villagewhere some 500 people lived in the 1880s, sendingsome 90% of their catch of bay shrimp back to China orto Chinese communities throughout the U.S. Thelocation is now part of China Camp State Park. ChinaCamp Park is part of the San Francisco Bay NationalEstuarine Research Reserve (NERR). The water qualitydata in this activity is taken from a monitoring station onthis historic pier.Google EarthThis activity requires the use of Google Earth. Ifstudents have computer access, the use of Google Earth(http://earth.google.com/) can help themdevelop spatial skills.To find the Tutorial “Using Google Earth to Explore<strong>Estuaries</strong>” go to <strong>Estuaries</strong>.noaa.gov, click the tab titledCurriculum and then the sub-tab titled Tutorials.MaterialsStudentsNeed to work in a computer lab or with acomputer and projectorCopy of Student ReadingEstuary and WatershedCopy of Student WorksheetEstuary and Watershed, Student Data Sheet 1— Orienting Yourself to the San FranciscoEstuary and WatershedCopy of Student Data Sheet 2 — Water QualityData<strong>Teacher</strong>sSheets of Mylar, acetate, or tracing paperDifferent colored markersMap(s) of the greater San Francisco areaDownload Google Earth.Equipment:Computer lab orComputer and ProjectorEarth <strong>Science</strong> <strong>Module</strong>—Activity 32
ProcedurePart 1 — Exploring the San Francisco Watershed1. Ask students what, if anything, they know aboutwatersheds. If possible, walk outside your schooland scanning your neighborhood, discuss your localwatershed with students. Where does the water thatpasses through ditches, gutters, creeks, or steamsnear your school go?2. Hand out all the student sheets (Student Reading —Estuary and Watershed, Student Worksheet — Estuaryand Watershed, Student Data Sheet 1 — OrientingYourself to the San Francisco Estuary and Watershed,and Student Data Sheet 2 — Water QualityData) and materials, and have students read and lookthrough them.3. Have students follow the directions on the StudentWorksheet — Estuary and Watershed to outline thegeneral limits and confines of the San Franciscowatershed. Explain to students that there are certainlywatersheds within this huge area outlined on theirimage. Point out the Sacramento and SanJoaquin Rivers if they have difficulty locating them.4. Show students their starting point (Golden GateBridge) in Google Earth and have them completePart 1 of the Student Worksheet — Estuary andWatershed.If students are using Google Earth for the first time,show them how to use the search tool, how to zoomin and out to change viewing altitude, and how touse the motion buttons to navigate around the image.(If necessary, refer to the Student Reading —Using Google Earth to Explore <strong>Estuaries</strong> in Activity 1 fora brief how-to guide.)5. Review and discuss the Part 1 tasks and questions.Part 2 — What's Upstream Comes Downstream6. Have students complete Part 2 of the Student Worksheet— Estuary and Watershed, choosing one of thetwo rivers and taking a Google Earth trip to identifyNational <strong>Science</strong> Education StandardsContent Standard A: <strong>Science</strong> as InquiryA3. Use technology and mathematics to improveinvestigations and communications.A4. Formulate and revise scientific explanationsusing logic and evidence.A6. Communicate and defend a scientificargument.Content Standard D: Earth and Space <strong>Science</strong>D2. Geochemical CyclesContent Standard E: <strong>Science</strong> and TechnologyE6. Understandings about science and technologyContent Standard F: <strong>Science</strong> in Personal andSocial PerspectivesF4. Environmental qualityF5. Natural and human-induced hazardsareas and man-made features that may bepotential sources of pollutants and contaminants ina heavy rain/flooding event.7. Review and discuss the Part 2 tasks and questions.Have students who studied each river report theirfindings to the class.Part 3 — Water Quality at the Mouth of aWatershed8. Ask students what might happen to the salinity andturbidity in the San Francisco Bay-Delta Estuaryafter a rainstorm. Go over the water quality factorsstudents will be analyzing.9. Have students complete Part 3 of the StudentWorksheet — Estuary and Watershed.The data given in this section reveals a major rain event inthe San Francisco watershed during the first days of January(1st -3rd). Several inches of rain fell over the area over theEarth <strong>Science</strong> <strong>Module</strong>—Activity 33
two-day span.10. Review and discuss the Part 3 tasks and questions.Part 4 — Optional: Mapping Your LocalWatershedIt is said that everyone lives in a watershed. Do streamsor rivers in your community flow into an estuary? Havestudents map their own watershed and identify the estuarinefeatures and geologic landforms that comprise it.11. Hand out copies of the topographic map of yourlocal watershed, new clear sheets of Mylar, acetate,or tracing paper, and the markers, and have studentscomplete Part 4 of the Student Worksheet — Estuaryand Watershed.Check for UnderstandingOptional Extension Inquiries1. Discuss the following:How do agricultural areas, industrial sites, landfills, andsewage treatment plants affect water quality in a watershed?Explain how an estuary can act as a filtration systemfor runoff in a watershed.2. Supply students with a road map of the eastern U.S. andproject a satellite image of the Chesapeake Bay watershed.http://gallery.usgs.gov/photos/03_08_2010_bFVi0MLyx6_03_08_2010_0Ask students to identify major urban areas around ChesapeakeBay and major rivers that drain the watershed. Askstudents to predict where they would expect areas in themost danger of contamination and pollution if a major stormevent such as a hurricane struck the region.1. Investigate the National Estuarine Research Reserveclosest to the location of your school. If possible,arrange to take your students on a field trip to the reserve.2. Have your students construct a map of the watershedfor the reserve using a topographic map of the region.3. Have students locate possible sources of pollution andcontamination in the watershed.4. Establish a water-monitoring program at a stream orriver near your school.5. Report the results of your monitoring program to yourtown council or other governing body (water company).Earth <strong>Science</strong> <strong>Module</strong>—Activity 34
<strong>Teacher</strong> Worksheet with AnswersActivity 3: Estuary and WatershedPart 1 — Exploring the San Francisco Watershed1a. Fly around the bay in a clockwise direction, identify the rivers that empty into the bay, and list them.Answer: The Pentaluma River, Napa River, San Joaquin River, Sacramento River, and several streams and creeks empty intoSan Francisco Bay.1b. Where is the source of the Sacramento River?Answer: The source is in the Sierra Nevada Mountains.1c. Where is the source of the San Joaquin River located?Answer: The source is in the Sierra Nevada Mountains.1d. Describe what kinds of human activity you see along sequence of bays and channels from San Pablo Bay to thejunction of the Sacramento and San Joaquin Rivers.Answer: There is widespread industrial activity, as well as golf courses, farmland, housing developments, parks, and othercommercial enterprises along this stretch of the bay complex/estuary. Many ships and docks can be seen as well.1e. Describe how the terrain up the rivers differs from the types of terrain along the coast. Can you detect anygeologic landforms or features that might be a source for salts, minerals, or materials that would affect water qualityin the estuary?Answer: The terrain upriver is mostly farmland until the rivers enter more urban areas such as the cities of Sacramento and SanJoaquin. Sewage treatment plants can be seen at the junction of the two rivers.Part 2 — What’s Upstream Comes Downstream2a. List ten possible sources of pollutants or contaminants along the river. Record the source and a place name orlatitude and longitude coordinates for each site.Answer: Student responses will vary. Students may find factories, sewage treatment plants, farm fields (sources of fertilizer), golfcourses (also a source of nitrates and phosphate fertilizer), parks, housing developments, and parking lots along both rivers’ banks.Earth <strong>Science</strong> <strong>Module</strong>—Activity 35
2b. What do you think is the most likely source of pollution and contamination along the river you investigated?Answer: Most of the land is composed of fields upriver. Runoff from farms carries fertilizer and animal wastes into the river andsubsequently into the estuary and bay complex.2c. Can you see any evidence that contaminants are being released in the estuary and San Francisco Bay?Answer: Students should be able to see sediment plumes in evidence at various places where the rivers enter Suisun and San PabloBays.Part 3 — Water Quality at the Mouth of a Watershed3a. Predict how this event would affect these water quality factors in the estuary:Answer: Student answers will vary.3b. Consult the Student Data Sheet 2 — Water Quality Data to look for evidence of a major storm event that occurredin 2006 and list its approximate dates.Answer: A major rain and storm event appears to have taken place in October between the 12th and the 16th based on theenormous increase in turbidity and drop in salinity.3c. What happened to each of the water quality indicators during and immediately following this event?Answer:water surface temperature: temperature dropped almost 2 FpH :changes slightly, drops .1 to .2 of a unitdissolved oxygen:stays about the sameSalinity:salinity decreased due to the influx of fresh water and stayed low for many daysTurbidity:quadrupled (200 to 800 NTUs)3d. How well did your predictions match what actually happened during the storm event?Answer: Student answers will vary.Earth <strong>Science</strong> <strong>Module</strong>—Activity 36
3e. What geologic landforms, features, farming, or industrial concerns affect the quality of water at the mouth ofyour local watershed?Answer: Student answers will vary.Part 4 — Mapping Your Local Watershed4a. Compare the watershed model you made with the watershed formed by the Sacramento and San Joaquin Rivers.How are they similar? How are they different?Answer: Answers will depend on your watershed and its characteristics.4b. What geologic landforms, features, farming, or industrial concerns affect the quality of water in the estuary ormouth of your local watershed?Answer: Answers will depend on your watershed and its characteristics.Earth <strong>Science</strong> <strong>Module</strong>—Activity 37
Student Reading—1Activity 3: Estuary and WatershedA watershed, also called a drainage basin, is the area inwhich all water, sediments, and dissolved materialsdrain from the land into a common body of water, suchas a river, lake, estuary, or ocean. A watershedencompasses not only the water but also the surroundingland from which the water drains. Watersheds rangein size from huge areas like the Mississippi Riverdrainage basin to small areas like your backyard.banks and shorelines by maintaining vegetatedbuffer strips, treating all wastes to removeharmful pollutants, or using grass-linedcatchment basins in urban areas to trapsediment and pollutants. Also, protectingwetlands is essential since they are important inslowing runoff, absorbing floodwaters, and cleaningstorm water.Whether large or small, a watershed’s characteristics cangreatly affect how water flows through it. Heavy stormsmay cause streams to rise rapidly. Human-madefeatures of the watershed like dams or large paved areascan change stream flow and alter the watershed. If theterrain is steep, changes in stream flow due to runoffcan be significant.In some watersheds, stream flow may take a long timeto respond to rainfall runoff. On heavily vegetated,relatively flat terrain, much of the rainfall is absorbed bythe soil and the vegetation slows runoff. In these areas,stream flow will rise slowly, but also recede slowly. Onsteep terrain with a scarcity of vegetation, heavy raincan cause rapid stream flow and runoff with very littleabsorption by the ground. These grade changes createdifferent habitats in the stream that support differentforms of life and change the quality of water in thewatershed.Water quality is critically impacted by everything thatgoes on within the watershed. Mining, forestry,agriculture, and construction practices, urban runofffrom streets, parking lots, chemically-treated lawns andgardens, failing septic systems, and improperly treatedmunicipal sewage discharges all affect water quality.Reducing pollution and protecting water qualityrequires identifying, regulating, monitoring, andcontrolling potential sources of pollution. Someexamples of control practices include protecting stream<strong>Estuaries</strong> lie at the mouth of watersheds. San FranciscoBay is a shallow, extremely large estuary that drainsabout forty percent of California. Nearly ninety percentof the fresh water flowing into the bay comes from theSacramento and San Joaquin rivers. Technically, bothrivers flow into Suisun Bay, which flows through theCarquinez Strait to meet with the Napa River at theentrance to San Pablo Bay, which then connects at itssouth end to San Francisco Bay. This entire group ofinterconnected bays is referred to as San Francisco Bay.San Francisco Bay has lost approximately 80-90% of itshistoric tidal wetlands due to human and industrialactivities within and around the bay. Tidal wetlands arecritical for flood prevention; sediment management;and habitats for small mammals, migratory birds andfish species, many of which are threatened andendangered.What happens upstream can affect the quality of waterand the living conditions for organisms that live in thetidal estuary. In this activity, you will investigate the SanFrancisco Bay watershed and estuary.The North or San Pablo Bay receiveshe waters of the Sacramento andSan Joaquin rivers via Suisun Bayand the Carquinez Strait on its eastend, and it connects to San FranciscoBay on its south end.Earth <strong>Science</strong> <strong>Module</strong>—Activity 3
Student Reading—1Continues…. Activity 3: Estuary and WatershedSan Pablo Bay is a primary wintering stop for thecanvasback duck population on the Pacific Flyway, aswell as a migratory staging ground for numerous speciesof waterfowl. Endangered species that are foundin the bay include the salt marsh harvest mouse.Endangered saltwater fishes found in the bay includestriped bass, sturgeon, starry flounder, leopard shark,and anchovy. The southwestern end, near the townof San Rafael, was the site of a Chinese shrimpfishingvillage where some 500 people lived in the1880s, sending some 90% of their catch of bayshrimp back to China. The location is now part ofChina Camp State Park, which is part of the SanFrancisco Bay National Estuarine Research Reserve(NERR). The water quality data you will examine inPart 3 of this activity was taken at this site.Figure 1. San Pablo Bay or North BayEarth <strong>Science</strong> <strong>Module</strong>—Activity 32
Student WorksheetActivity 3: Estuary and WatershedPart 1 — Exploring the San Francisco WatershedIn this part of the activity, you will examine the San Francisco Bay watershed and then investigate the impact of thenatural and man-made features that cause materials to be carried down river into parts of the estuary.Obtain a piece of plastic overlay and put it over the Oblique View of the San Francisco area on Student Data Sheet 1— Orienting Yourself to the San Francisco Estuary and Watershed.Use a marker and outline any high ridges or mountains you see surrounding low basin areas.Use a map of California to label cities and the names of mountains present in the image.Sketch the path of the Sacramento and San Joaquin Rivers as far as you can. (The lines marking the tops of themountains outline the huge watershed of San Francisco Bay.)Figure 2. South Bay is the large bay at the bottom of this image.South Bay has very little fresh water flowing into it.(Image courtesy of US Geological Survey)Earth <strong>Science</strong> <strong>Module</strong>—Activity 33
Take a closer look at both the estuary and the nature of the watershed using Google Earth.If you are unfamiliar with Google Earth, your teacher will give you a short demonstration on how to navigate andchange your viewing altitude using the software.If San Francisco Bay is not preset, enter 37° 48' 53.12 N, 122° 28' 38.26 W, the coordinates of the Golden GateBridge, into the Search box.Press the Go button (magnifying glass).Consult the Road Map on Student Data Sheet to orient yourself to the series of bays in the estuary and to the locationof the city of San Francisco.After taking a look at the bridge, increase your viewing altitude to 20 km.Fly straight north by pressing the “up“ arrow until you reach North Bay (San Pablo Bay). You should see the town ofGallinas on the western shore of the bay.1a. Fly around the bay in a clockwise direction, identify the rivers that empty into the bay, and list them.As you reach the eastern side of the bay, notice a large channel heading towards the right side of the screen. Follow itpast Grizzly and Suisun Bay to Sherman Island. Two major rivers intersect here—the Sacramento and San JoaquinRivers.Follow the northern river (Sacramento) along its course. When it branches, keep taking the northern branch until youcan no longer observe its course. This point is the river’s source or headwater.1b. Where is the source of the Sacramento River?Earth <strong>Science</strong> <strong>Module</strong>—Activity 34
Figure 3. Most of the fresh water that mixes with ocean waterin the estuary comes from two sources —the Sacramento and San Joaquin Rivers.Figure 4. An oblique satellite image of the same scene.The vertical scale of this image is enhanced 5 times.Travel back to the junction of the two rivers and trace the path of the San Joaquin River and locate its headwaters.1c. Where is the source of the San Joaquin located?Travel back to the Golden Gate Bridge and explore the rest of the estuary, including South Bay. List any additionalsources of fresh water flowing into the estuary.1d. Describe what kinds of human activity you see along the sequence of bays and channels from San Pablo Bayto the junction of the Sacramento and San Joaquin Rivers.Earth <strong>Science</strong> <strong>Module</strong>—Activity 35
1e. Describe how the terrain up the rivers differs from the types of terrain along the coast. Can you detect anygeologic landforms or features that might be a source for salts, minerals, or materials that would affect water quality inthe estuary?Part 2 — What's Upstream Comes DownstreamYou will now take a closer look at the watershed and try to determine the nature of the pollutants and contaminantsthat might be washed downstream into the estuary by heavy rain and floods.Pick one of the two major rivers (Sacramento or San Joaquin) flowing into San Pablo Bay to follow upstream. Flylow—one kilometer or less—to see features like chemical or other industrial plants, sewage treatment plants, golfcourses, and other possible sources of contaminants.Selected River (circle one): Sacramento River San Joaquin River2a. List ten possible sources of pollutants or contaminants along the river. Record the source and a place name orlatitude and longitude coordinates for each site.Possible Source of Pollution/ContaminantsName or Location1. ___________________________________ ______________________________2. ___________________________________ ______________________________3. ___________________________________ ______________________________4. ___________________________________ ______________________________5. ___________________________________ ______________________________6. ___________________________________ ______________________________7. ___________________________________ ______________________________8. ___________________________________ ______________________________Earth <strong>Science</strong> <strong>Module</strong>—Activity 36
9. ___________________________________ ______________________________10. __________________________________ ______________________________2b. What do you think is the most likely source of pollution and contamination along the river you investigated?2c. Can you see any evidence that contaminants are being released in the estuary and San Francisco Bay?Part 3 — Water Quality at the Mouth of a WatershedYou will attempt to determine how a major weather event might affect water quality near the mouth of a watershed,in this case, in the San Pablo Bay region of the estuary at China Camp State Park.Imagine the following: A major storm dumps several inches of rain in the Sierra Nevada mountains and the cities ofSacramento and San Joaquin. Regional flooding occurs along the banks of both rivers and the runoff increases thevolume of fresh water running into the bay and estuary system.3a. Predict how this event would affect these water quality factors in the estuary:water surface temperature ____________________________________________________pH ___________________________________________________________________________dissolved oxygen _____________________________________________________________salinity _______________________________________________________________________turbidity ______________________________________________________________________Earth <strong>Science</strong> <strong>Module</strong>—Activity 37
3b. Consult the Student Data Sheet 2 — Water Quality Data, look for evidence of a major storm event that occurredin 2006, and list its approximate dates.3c. What happened to each of the water quality indicators during and immediately following this event?water surface temperature _________________________________________________pH ________________________________________________________________________dissolved oxygen __________________________________________________________salinity ____________________________________________________________________turbidity ___________________________________________________________________3d. How well did your predictions match what actually happened during the storm event?3e. What geologic landforms, features, farming, or industrial concerns affect the quality of water at the mouthof your local watershed?Part 4 — Mapping Your Local WatershedCover the topographic map of a watershed supplied by your teacher with a piece of clear plastic.Earth <strong>Science</strong> <strong>Module</strong>—Activity 38
Find, mark, and label with blue pen the following items on the map:• streams • ditches • ponds• rivers • lakes • ocean• water wells • water treatment plant • water storage tanks• schools• sewage lagoon or catchment pondsFind the highest and lowest points in the watershed. Mark all the high points (hilltops) with a black “H.” Mark thelowest spot with a red “L.”From the black “H” high points, draw arrows on your map to show the flow of runoff. Where does water flow intoponds, lakes, streams, rivers, or ocean?Draw a black line around the perimeter of the watershed. To do this, start at the lowest point (the mouth of astream or river where it drains into another body of water) and start clockwise up the nearest ridge. Connect the“Hs” on the ridge until you have completely enclosed the stream and end up back at the starting point.4a. Compare the watershed model you made with the watershed formed by the Sacramento and San JoaquinRivers. How are they similar? How are they different?4b. What geologic landforms, features, farming, or industrial concerns affect the quality of water in the estuaryor mouth of your local watershed?Earth <strong>Science</strong> <strong>Module</strong>—Activity 39
Student Data Sheet - 1Activity 3: Orienting Yourself to the San FranciscoEstuary and WatershedOblique ViewFigure 5. An oblique view of the San Francisco Bay area showing the outer margins of the large watersheddrained by the San Joaquin and Sacramento Rivers. The Sierra Nevada Mountains are on the top right edge of the image.The vertical scale has been exaggerated by a factor of 5.Earth <strong>Science</strong> <strong>Module</strong>—Activity 310
Road MapFigure 6. Road map of the San Francisco Bay areaEarth <strong>Science</strong> <strong>Module</strong>—Activity 311
Satellite ViewFigure 7. A satellite view of the San Francisco Bay area. Your tour of the rivers that drainthe San Francisco Bay watershed begins in the upper-right portion of this image.Earth <strong>Science</strong> <strong>Module</strong>—Activity 312
View of the EstuaryFigure 8. The San Francisco estuary has many parts.Earth <strong>Science</strong> <strong>Module</strong>—Activity 313
Student Data Sheet - 2Activity 3: Water Quality DataChina Camp, San Pablo BayAll data from the China Camp Monitoring Station in San Pablo Bay, Dec 20, 2005 to Jan 19, 2006Figure 9. Salinity Drop with StormFigure 10 . Water TemperatureEarth <strong>Science</strong> <strong>Module</strong>—Activity 314
Figure 11. pHFigure 12. Dissolved OxygenEarth <strong>Science</strong> <strong>Module</strong>—Activity 315
Figure 13. TurbidityEarth <strong>Science</strong> <strong>Module</strong>—Activity 316
<strong>Teacher</strong> Guide—Earth <strong>Science</strong> <strong>Module</strong>Activity 4: Extreme Weather and <strong>Estuaries</strong>Featured NERRS Estuary:North Carolina National EstuarineResearch Reservehttp://nerrs.noaa.gov/Reserve.aspx?ResID=NOCActivity SummaryStudents investigate how hurricanes can affect NERRSestuaries. Students begin by studying the North CarolinaNational Estuarine Research Reserve (NCNERR) in theCape Fear area with Google Earth and predict whichareas of the reserve might be more vulnerable to theonslaught of high winds, heavy rain and storm surgethan others. Then students monitor and interpret thechanges in water quality factors day by day as a severestorm approaches, strikes the estuary, and then dissipates.Learning ObjectivesStudents will be able to:1. Describe the features and landforms associated witha coastal estuary.2. Predict how major storm events affect NERRSreserves in the United States.3. Investigate and interpret changes in water quality inan estuary due to a severe weather event.4. Determine the relationship between thecharacteristics of an extreme weather event (heavywind, torrential rains and storm surge) and thesubsequent change in water quality over time.Grade Levels9-12Teaching Time3 (55 minute) class sessions + homeworkOrganization of the ActivityThis activity consists of 3 parts which help deepenunderstanding of estuarine systems:Investigating an EstuaryWhich NERRS are Affected by Hurricanes?Impact of Extreme Weather on an EstuaryBackgroundThe activity focuses on a portion ofthe North Carolina NERR centered onZeke’s Island, which is a little north ofCape Fear. Zeke’s Island is located inBrunswick and New Hanover counties,approximately four miles south of KureBeach. This component of theNorth Carolina NERR is bounded byEarth <strong>Science</strong> <strong>Module</strong>—Activity 4
Federal Point to the north, Smith Island to the south,the Atlantic Ocean to the east, and the Cape Fear Riverto the west. The lagoon-like complex at the Zeke’sIsland site is one of the most unusual areas of the NorthCarolina coast. There are three main islands within thecomponent of the reserve—Zeke’s Island covering 42acres of high ground, North Island encompassing 138upland acres, No Name Island covering about threeacres, and the beach barrier spit of 64 acres. The islandsare fringed with extensive marshes and tidal flats.Habitat and communities in the reserve include tidalflats, intertidal salt marshes, supratidal salt marshes,shrub thicket, maritime forest, dune areas, sandy beach,and rock jetty.Zeke’s Island is part of the lower Cape Fear region, anarea whose outstanding estuarine and ocean resourceshave long-supported an important commercial fishingindustry. The Cape Fear estuary drains the largest watershedin North Carolina, containing 27 percent of thestate's population. The Cape Fear River itself (about 320km in length) is formed in the Piedmont province by theconfluence of the Haw and Deep Rivers in ChathamCounty. Two tributaries join it just upstream ofWilmington, the Black River and the Northeast CapeFear River. The Black River drainage represents about17 percent of the Cape Fear drainage system and theNortheast Cape Fear River about 18 percent. (Adaptedfrom the North Carolina NERR site.)PreparationDownload Google Earth and install it on yourclassroom computer(s) or computer lab machines. Tofind a tutorial for using Google Earth, please read thebox below.Google EarthThis activity requires the use of Google Earth.If students have computer access, the use of GoogleEarth (http://earth.google.com/) can help themdevelop spatial skills.To find the Tutorial “Using Google Earth to Explore<strong>Estuaries</strong>” go to <strong>Estuaries</strong>.noaa.gov, click the tab titledCurriculum and then the sub-tab titled Tutorials.MaterialsStudentsNeed to work in a computer lab or with acomputer and projectorCopy of Student Worksheet — Extreme Weatherin an Estuary.Copy of Student Reading — Extreme Weatherin an Estuary.Copy of Student Data Sheet 1 — Which NERRsAre Affected by Hurricanes?Copy of Student Worksheet — Extreme Weatherin an Estuary.<strong>Teacher</strong>sBookmark the following sites:http://nerrs.noaa.gov/Reserve.aspx?ResID=NOChttp://www.nasa.gov/vision/earth/lookingatearth/2005hurricane_recap.htmlDownload Google Earth.If you don't want to use Google Earth, supplytopographic and road maps of the area tostudents instead.Equipment:Computer lab orComputer and ProjectorCopy of Student Data Sheet 2 — Impact on anEstuary by an Extreme Weather Event.Copy of Using Google Earth to Explore<strong>Estuaries</strong>Earth <strong>Science</strong> <strong>Module</strong>—Activity 42
ProcedurePart 1 — Investigating an Estuary1. Ask students if they have lived through a hurricaneevent. Ask what kind of damage the storm did theirhomes, community, or to their environment ingeneral.2. Have your students use the NERRS web site to learnbasic information about the North Carolina NERRand Zeke’s Island 3. Have them use Google Earth to explore it further, byentering 33 56" 41.39" N, 77 56" 40.78" W in theSearch Box. You may want to project the image to leadthe tour of the area. Or supply the coordinates to yourstudents and have them take the tour individually or insmall groups. If you don't want to use Google Earth,supply topographic and road maps of the area tostudents instead.If this is the first time students have used Google Earth,give a short tutorial and review how to navigate andchange viewing altitude. (If necessary, refer to UsingGoogle Earth to Explore <strong>Estuaries</strong>)4. Have students explore the estuarine environmentand complete Part 1 of the Student Worksheet —Extreme Weather in an Estuary.5. Review and discuss the Part 1 tasks and questions.6. Have students read Student Reading — Extreme Weatherin an Estuary.Part 2 — Which NERRs Are Affected byHurricanes?7. Supply students with copies of Student Data Sheet 1— Which NERRs Are Affected by Hurricanes?, and afterthey study the map of the 2005 hurricanes, go overthe keys and answer any questions students mayhave.8. Show the animation of the tracks of the 2005hurricanes by clicking on the map atNational <strong>Science</strong> Education StandardsContent Standard A: <strong>Science</strong> as InquiryA3. Use technology and mathematics to improveinvestigations and communications.A4. Formulate and revise scientific explanationsusing logic and evidence.A6. Communicate and defend a scientific argument.Content Standard D: Earth and Space <strong>Science</strong>D1. Structure of the Earth SystemD2. Geochemical cyclesContent Standard E: <strong>Science</strong> and TechnologyE2. Apply and adapt a variety of appropriatestrategies to solve problemsContent Standard F: <strong>Science</strong> in Personal andSocial PerspectivesF4. Environmental qualityF5. Natural and human-induced hazards. Or allowstudents to go to the site themselves. Have studentstry to match the tracks on the Student Data Sheet 1map with the movements of the storms shown inthe animation.9. Have students complete Part 2 of the Student Worksheet— Extreme Weather in an Estuary.10. Review and discuss the Part 2 tasks and questions.Part 3 — Impact of Extreme Weather on anEstuary11. Ask students what effects they would expect ahurricane to have on an estuarine environment.How might the effects of the storm combinewith normal changes in water levels and qualitysuch as tides?What would happen to the temperature, salinity,Earth <strong>Science</strong> <strong>Module</strong>—Activity 43
dissolved oxygen, and pH of the water in theestuary if the hurricane dumped 6 inches of raininto the surrounding watershed?What impact would a high storm surge have?12. Have students complete Part 3 of the Student Worksheet— Extreme Weather in an Estuary, using theStudent Data Sheet 2 — Impact on an Estuary by anExtreme Weather Event.13. Review and discuss the Part 3 tasks and questions.Check for UnderstandingDiscuss the following with students:What were the effects of a major storm event in theNorth Carolina NERR? What caused the change in each of the four abioticparameters studied in thisactivity? Why is there a difference in the time it takes for thedifferent parameters to return tonormal? What effects do you think the storm might have had ondifferent plants and animals in the estuary?Optional Extension InquiriesHurricane Katrina struck the southern coast of the UnitedStates in late August 2005. Show an image of Katrina as ithit the US on Aug. 29.Locate the Weeks Bay NERR on a map for students ortake a screen shot of Weeks Bay with Google Earth.Ask students to sketch what the salinity, pH, DO, andturbidity graphs might be look like for the Weeks BayNERR for the period of August 29 to September 4.Download data from the SWMP Web site for a stationin Weeks Bay during the given time period and give orproject the graphs so students to compare theirpredictions with the actual data.Earth <strong>Science</strong> <strong>Module</strong>—Activity 44
<strong>Teacher</strong> Worksheet with AnswersActivity 4: Extreme Weather in an EstuaryPart 1 — Investigating an Estuary1a. Adjust your Eye altitude to 3 km to get a good bird’s-eye view of the island. Describe the estuary and features oflandforms around the island.Answer: Students will see barrier beaches, salt marshes and swamps, sand bars, coves, inlets, and a large lagoon.1b. “Fly” slowly down the coast and explore the region from Zeke’s Island to Cape Fear. Can you identify any ofthe following estuary and coastal features in the region? Write the name and/or the coordinates of any features youfind—salt marshes, a headland, a bay, inlets, a slough, barrier beaches, sediment plumes, a lagoon, sand bars, andtidal flatsAnswer: Students should find each of these features as they travel between Zeke’s Island and Cape Fear.1c. Predict which areas in the region might be most liable to be damaged during a severe storm event. Explain yourreasoning.Answer: The outer beaches east of Zeke’s Island and the entire strip of land south to Cape Fear lie unprotected in the path of anymajor storm. It is a high-risk area for beach erosion and flooding.1d. Which areas in the region do think are protected somewhat from high winds and higher than normal tides?Explain your reasoning.Answer: Zeke’s Island and the coast just west of it are protected from large storm waves by barrier beaches and the interveninglagoon.Part 2 — Which NERRs Are Affected by Hurricanes?2a.Which NERRS site or sites would be hardest hit by a hurricane in 2005?Answer: Student answers will vary. Grand Bay took a direct hit from at least two hurricanes including Katrina.2b.Which NERRS sites had more than one major weather event impact them in 2005?Answer: Grand Bay and Weeks Bay seem to have had at least four encounters with severe weather events in 2005.Earth <strong>Science</strong> <strong>Module</strong>—Activity 45
Part 3 — Impact of Extreme Weather on an Estuary3a. What do you think caused the severe drop in salinity on August 26?Answer: The hurricane dumped many inches of fresh water into the estuary. After the storm passed, runoff from rivers and streamsincreased dramatically, adding to the proportion of fresh water to salt water that remained high (low salinity) for weeks afterlandfall.3b. Why do you think the salinity of the water in the reserve continued to fall and then remain at such low levels forweeks after the storm event?Answer: Runoff from streams and rivers continued to flow into the salt water of the estuary.3c. What was the change in water temperature caused by the storm?Answer: The water temperature in the estuary dropped about 5 °C, but rose to previous levels three days later.3d. How was the pH of the water in the estuary affected by the storm?Answer: The pH of the estuary water became slightly more basic due to the influx of waste products from upstream.3e. What caused the huge increase in turbidity around Zeke’s Island during the storm?Answer: Immense quantities of natural particulates (clay, mud, sand, etc.) enter the estuary from runoff of streams and rivers.3f. How long did it take for each of the water qualities to return to normal? Why do you think it took longer forsome factors to return to normal than others?Answer: The temperature, pH, and turbidity of the estuary water were restored to normal in just 2 to 4 days. The salinity, however,remained low for a month as runoff from streams and rivers continued to inundate the estuary with fresh water. Dissolved oxygenremained low for several weeks since so much raw sewage and pig farm residue were washed into it.Earth <strong>Science</strong> <strong>Module</strong>—Activity 46
Student ReadingActivity 4: Extreme Weather in an EstuaryUsually, when extreme weather occurs, the damagecaused by it is categorized in dollars and lives lost.However, the tremendous damage on animal and plantspecies is rarely addressed. <strong>Estuaries</strong> are places oftransition, a zone of constant change in which physicaland chemical properties of water constantly shift andmove in response to tides, daily cycles, and seasonalvariations. Storm events have the power to alterconditions in an estuary in a dramatic and sometimescatastrophic way that threatens the survival of thousandsof organisms that live there.The focus of this activity is the North CarolinaNational Estuarine Research Reserve (NCNERR).North Carolina’s estuarine system is the third largest inthe country, encompassing more the two million acres.This system is of prime economic importance to thecoastal area—90 percent of the commercial seafoodspecies caught in the state spend at least part of theirlives in an estuary. The North Carolina NERR was establishedto preserve these fragile natural areas and thevariety of life they support.In this activity, you will investigate the features of theNorth Carolina NERR, and then study the effect ofsevere weather on NERRS sites. Then, you will investigatewhat happened to this estuarine area as a hurricaneapproached, struck the coast with 100 mphwinds, and then moved into the Atlantic Ocean.<strong>Estuaries</strong> are in one sense resilient. After a majorstorm, water in estuaries can act as a buffer, absorbinglarge quantities of excess precipitation and floodwaterbrought in by streams and rivers. However, toxinssuch as fertilizers, animal and human wastes, and otherchemical products washed into the estuary during andafter a storm can make water quality such thatnumerous animal and plant species face destruction.After a major storm event, water quality slowly returnsto normal. As sediment settles to the bottom, plantgrowth is renewed, dissolved oxygen rises, and the pHof the water returns to normal levels. The timerequired to return to normalcy is dependent on theamount of toxic materials carried into the estuary bythe floodwaters produced by the storm.Earth <strong>Science</strong> <strong>Module</strong>—Activity 47
Figure 1. The four major portions of the North Carolina NERREarth <strong>Science</strong> <strong>Module</strong>—Activity 48
Student WorksheetActivity 4: Extreme Weather in an EstuaryStudent Name:Part 1 — Investigating an EstuaryThe North Carolina NERR consists of four different regions; in this activity, we will focus on just one of them—Zeke’s Island.Figure 2. Region between the North Carolina NERRand Cape Fear (bottom of page) showing several monitoring stations.Earth <strong>Science</strong> <strong>Module</strong>—Activity 49
Use Google Earth to investigate the North Carolina NERR. Open the Google Earth program and insert thecoordinates for Zeke’s Island into the “Fly To” box (33 56' 43.19", 77 56' 45.82").1a.Adjust your Eye altitude to 3 km to get a good bird’s-eye view of the island. Describe the estuary and features oflandforms around the island.1b.“Fly” slowly down the coast and explore the region from Zeke’s Island to Cape Fear. Can you identify any of thefollowing estuary and coastal features in the region? Write the name and/or the coordinates of any features youfind.salt marshes _______________________________________________________________a headland _______________________________________________________________a bay _____________________________________________________________________inlets ______________________________________________________________________a slough __________________________________________________________________barrier beaches ___________________________________________________________sediment plumes __________________________________________________________a lagoon __________________________________________________________________sand bars __________________________________________________________________tidal flats __________________________________________________________________Earth <strong>Science</strong> <strong>Module</strong>—Activity 410
1c. Predict which areas in the region might be most liable to be damaged during a severe storm event. Explain yourreasoning.1d. Which areas in the region do think are protected somewhat from high winds and higher than normal tides?Explain your reasoning.Part 2 — Which NERRs Are Affected by Hurricanes?You will find a chart of all hurricanes and major tropical storm events that occurred during 2005 in the AtlanticOcean on Student Data Sheet 1 — Which NERRs Are Affected by Hurricanes?. To get an idea of how these major stormstraveled through the Atlantic, your teacher will show you an animation. Or, open up http://www.nasa.gov/vision/earth/lookingatearth/2005hurricane_recap.html and click on the small map on the right side of the home page.Which NERRS sites were affected by these storms and to what degree? To answer this question, refer to thecharts and images on your data sheet and fill out the Impact on <strong>Estuaries</strong> table. Predict the severity of the impact ofeach storm on each estuary by considering the extent of the average major storm. Winds are highest near the centerof hurricanes while bands of rain may extend a hundred miles from the center of a large storm.2a. Which NERRS site or sites were hardest hit by a hurricane(s) in 2005?Earth <strong>Science</strong> <strong>Module</strong>—Activity 411
2b. Which NERRS sites had more than one major weather event impact them in 2005?Part 3 — Impact of Extreme Weather on an EstuarySevere weather has profound effects on coastal areas, tearing down trees, and washing beaches and houses away.<strong>Estuaries</strong> are particularly sensitive to severe weather since the organisms that live in them are already in a delicatelybalanced environment of a salt and fresh water transition zone.You will investigate the effect of a large storm on the North Carolina Estuarine Research Reserve. HurricaneBonnie formed off the coast of western Africa on August 14th, 1998.Although slow to develop, Bonnie grew in intensity and became a tropical storm with winds of about 40 mph aweek later. While moving more quickly, Bonnie achieved hurricane status with winds over 60 mph as the stormpasses north of Puerto Rico on August 22nd.On August 26th, Hurricane Bonnie weakens a little before she strikes the coast just east of Cape Fear near midnightwith winds around 110 mph.Bonnie was the first major hurricane (Category 3) of the 1998 season. The winds and flooding rains damagedbuildings and cut off power to nearly a half-million people. The storm was nearly 400 miles wide as it crossed thecoast.Figure 3.Hurricane Bonnie making landfall on the eastern coast of the United States.Earth <strong>Science</strong> <strong>Module</strong>—Activity 412
To understand the effects of a major storm on an estuary, refer to Student Data Sheet 2 — Impact on an Estuary by anExtreme Weather Event: A Case Study. Study the graphs of precipitation and water quality for the Zeke’s Islandreporting station for August 1 to September 17, 1998. As you review the data, remember that Hurricane Bonniemade landfall on August 26.3a. What do you think caused the severe drop in salinity on August 26?3b. Why do you think the salinity of the water in the reserve continued to fall and then remain as such low levelsfor weeks after the storm event?3c. What was the change in water temperature caused by the storm?3d. How was the pH of the water in the estuary affected by the storm?3e. What caused the huge increase in turbidity around Zeke’s Island during the storm?3f. How long did it take for each of the water qualities to return to normal? Why do you think it took longer forsome factors to return to normal than others?Earth <strong>Science</strong> <strong>Module</strong>—Activity 413
Student Data Sheet—1Activity 4: Which National Estuarine ResearchReserves Are Affected by Hurricanes?Figure 4. The hurricanes are numbered and named in the order of their appearanceduring the 2005 hurricane season. The change in color and pattern indicate the change in the intensity of the storm.Earth <strong>Science</strong> <strong>Module</strong>—Activity 414
Figure 5. Keep in mind that hurricanes are truly huge objects, sometimes hundreds of miles across.Earth <strong>Science</strong> <strong>Module</strong>—Activity 415
Figure 6 — Twenty-seven sites compose the National Estuarine Research Reserve SystemEarth <strong>Science</strong> <strong>Module</strong>—Activity 416
Table of <strong>Estuaries</strong> Affected by Severe Storm Events in 2005Site Name Storm(s) Predicted Impact (severe, moderate, mild)1)2)3)4)5)6)7)8)9)10)Earth <strong>Science</strong> <strong>Module</strong>—Activity 417
Student Data Sheet—2Activity 4: Impact on an Estuary by an Extreme WeatherEvent: A Case StudyWater Quality — Zeke’s Island Aug 1- Sept 17, 1998Figure 7 — Salinity in parts per thousand (ppt)Figure 8 — Dissolved Oxygen in mg/lEarth <strong>Science</strong> <strong>Module</strong>—Activity 418
Figure 9 — Water Temperature in CFigure 10 — Water pHEarth <strong>Science</strong> <strong>Module</strong>—Activity 419
Figure 11 — Water Turbidity in NTU unitsEarth <strong>Science</strong> <strong>Module</strong>—Activity 420
<strong>Teacher</strong> Guide—Earth <strong>Science</strong> <strong>Module</strong>Final Assessment1. Have students download 2005 SWMP abiotic and biotic data from several stations within Grand BayNERR and examine the changes wrought by the severe storm events they identified in their data. Or, downloadthe data yourself, print and copy it for students.2. Have students use Google Earth to explore the terrain around Grand Bay NERR. In general, whatlandforms and estuary features can you identify around Grand Bay NERR?Answer: Bayous, bays, headlands, coastal beaches, and extensive wetlands lie east and north of Grand Bay NERR.3. Are there specific areas (natural, suburban, or urban) areas that seem particularly vulnerable in the midst of asevere storm event?Answer: The Chevron refinery and the entire city of Pascagoula seem to be in the direct path of the storm. The bayou areas northof Bangs Lake seem to be vulnerable to storm surges and flooding.Figure 1. A Google Earth view of theGrand Bay NERR region and monitoring stations.Earth <strong>Science</strong> <strong>Module</strong>—Final Assessment
3. Download 2005 data from the Point Aux Chenes Bay and the Bayou Herron monitoring stations in Grand BayNERR.a. Describe the general pattern of values at both stations for the week that Katrina struck the estuary.b. What is the range of values for each parameter at each station? If data is missing, offer an explanation towhy no data exists for that time period.c. How long did it take for the parameter values to return to normal at each station? Explain anydifferences you find between the two stations.d. What impacts might the storm have had on organisms, habitats, or human life in the estuary?e. Do an Internet search to find the actual damage suffered by the Grand Bay area, particularly thePascagoula area.f. Can you suggest strategies that could be employed by towns and cities in the area to decrease the damageto both the suburban and estuarine environment?Earth <strong>Science</strong> <strong>Module</strong>—Final Assessment2